| Param | Original file | Final file |
|---|---|---|
| Filename | modeM0/AS1C04_001T01_9000002994_20197cztM0_level2.evt | modeM0/AS1C04_001T01_9000002994_20197cztM0_level2_quad_clean.evt |
| Size (bytes) | 122,166,720 | 30,936,960 |
| Size | 116.5 MB | 29.5 MB |
| Events in quadrant A | 789,673 | 210,458 |
| Events in quadrant B | 856,688 | 208,490 |
| Events in quadrant C | 766,004 | 199,339 |
| Events in quadrant D | 1,172,010 | 196,254 |
| Mode SS | |||
|---|---|---|---|
| Quadrant | BADHDUFLAG | Total packets | Discarded packets |
| A | 0 | 34 | 0 |
| B | 0 | 34 | 0 |
| C | 0 | 34 | 0 |
| D | 0 | 34 | 0 |
| Mode M0 | |||
|---|---|---|---|
| Quadrant | BADHDUFLAG | Total packets | Discarded packets |
| A | 0 | 3427 | 0 |
| B | 0 | 3607 | 0 |
| C | 0 | 3319 | 0 |
| D | 0 | 4553 | 0 |
| Quadrant | Total seconds | Saturated seconds | Saturation percentage |
|---|---|---|---|
| A | 1654 | 12 | 0.725514% |
| B | 1655 | 3 | 0.181269% |
| C | 1655 | 8 | 0.483384% |
| D | 1655 | 46 | 2.779456% |
Noise dominated data is calculated using 1-second bins in cleaned event files. If a bin has >2000 counts, and if more than 50% of those come from <1% of pixels, then it is considered to be noise-dominated and hence unusable.
| Quadrant | # 1 sec bins | Bins with >0 counts | Bins with >2000 counts | High rate bins dominated by noise | Noise dominated (total time) | Noise dominated (detector-on time) | Marked lightcurve |
|---|---|---|---|---|---|---|---|
| A | 1654 | 1654 | 9 | 9 | 0.54% | 0.54% | 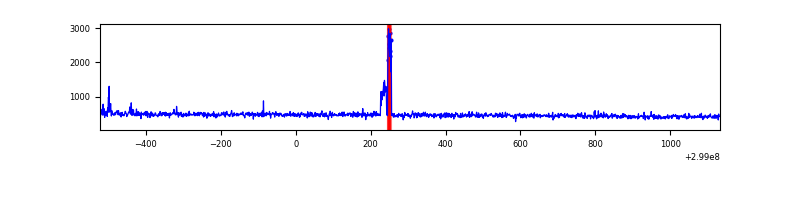 |
| B | 1655 | 1655 | 1 | 1 | 0.06% | 0.06% | 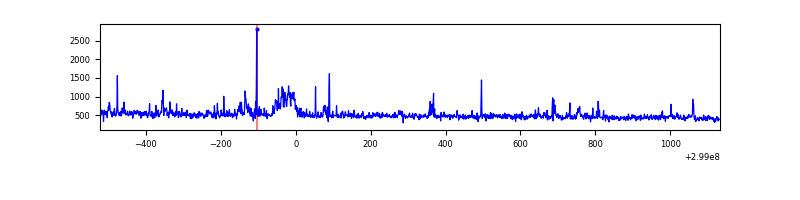 |
| C | 1655 | 1655 | 0 | 0 | 0.00% | 0.00% | 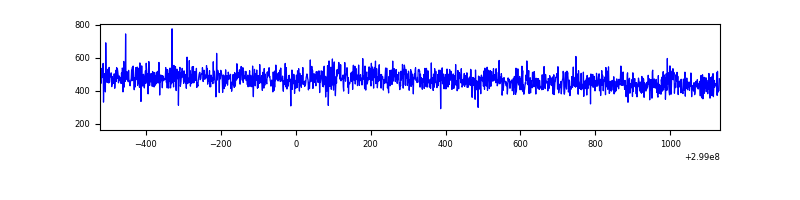 |
| D | 1655 | 1655 | 33 | 33 | 1.99% | 1.99% | 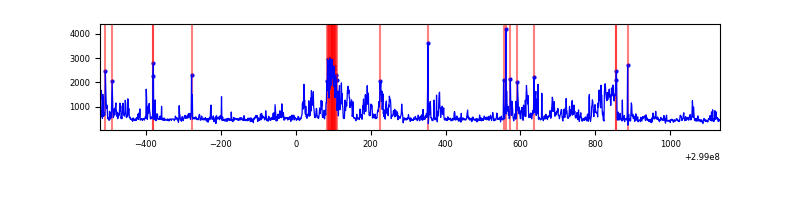 |
Top three noisy pixels from each quadrant. If the there are fewer than three noisy pixels in the level2.evt file, extra rows are filled as -1
| Pixel properties | Quadrant properties | ||||||
|---|---|---|---|---|---|---|---|
| Quadrant | DetID | PixID | Counts | Sigma | Mean | Median | Sigma |
| A | 14 | 111 | 34145 | 819.26 | 194 | 190 | 41.4 |
| A | 4 | 2 | 5231 | 121.63 | 194 | 190 | 41.4 |
| A | 0 | 226 | 1745 | 37.52 | 194 | 190 | 41.4 |
| B | 0 | 197 | 40401 | 1064.98 | 191 | 186 | 37.8 |
| B | 4 | 216 | 16909 | 442.86 | 191 | 186 | 37.8 |
| B | 4 | 171 | 14861 | 388.63 | 191 | 186 | 37.8 |
| C | 14 | 238 | 29256 | 648.72 | 186 | 186 | 44.8 |
| C | 3 | 233 | 5581 | 120.39 | 186 | 186 | 44.8 |
| C | 1 | 16 | 3632 | 76.9 | 186 | 186 | 44.8 |
| D | 7 | 38 | 224207 | 4689.53 | 190 | 184 | 47.8 |
| D | 11 | 176 | 56112 | 1170.76 | 190 | 184 | 47.8 |
| D | 9 | 1 | 49646 | 1035.4 | 190 | 184 | 47.8 |
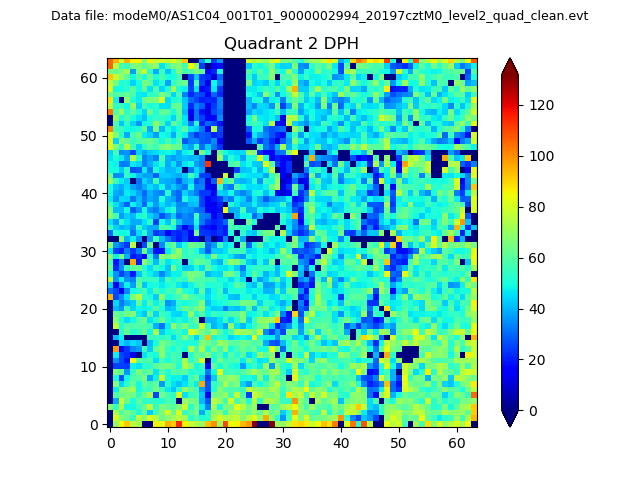
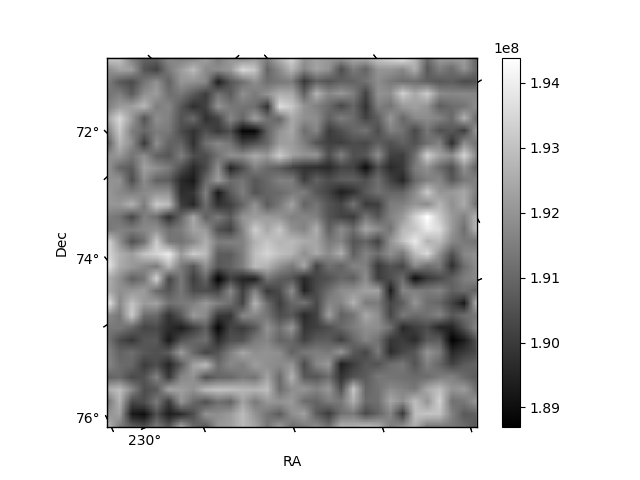
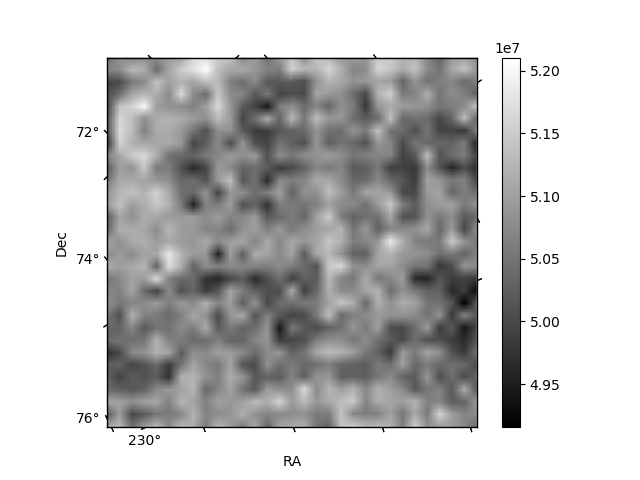
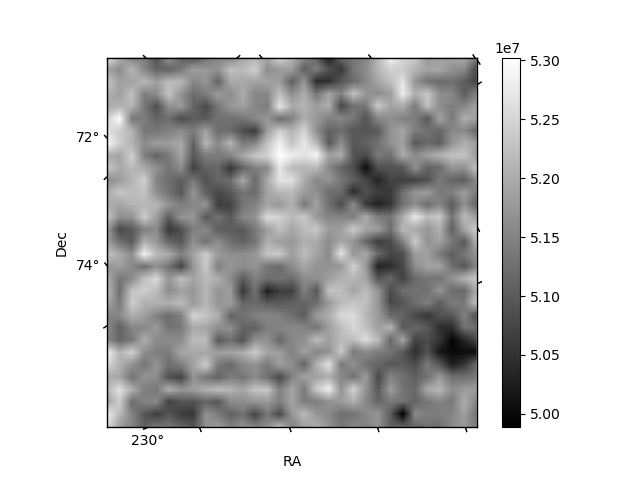
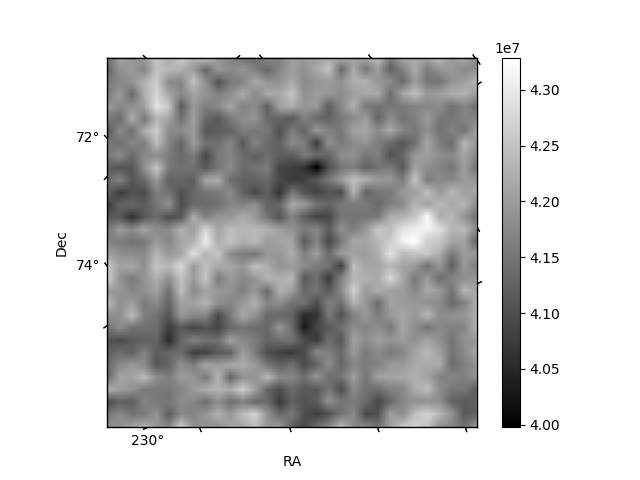
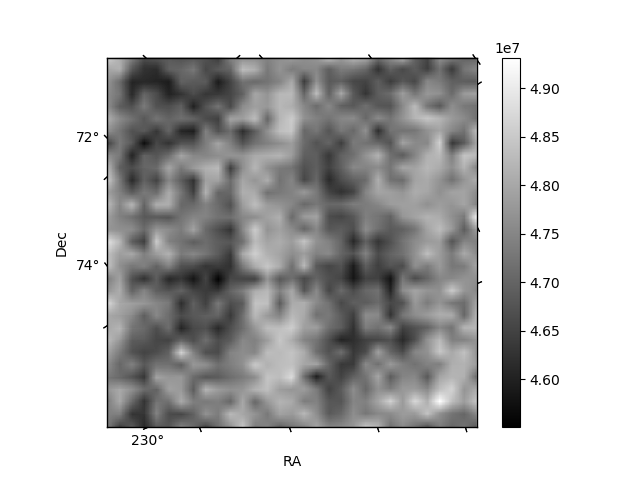
Histogram calculated using DETX and DETY for each event in the final _common_clean file
| Quadrant A | 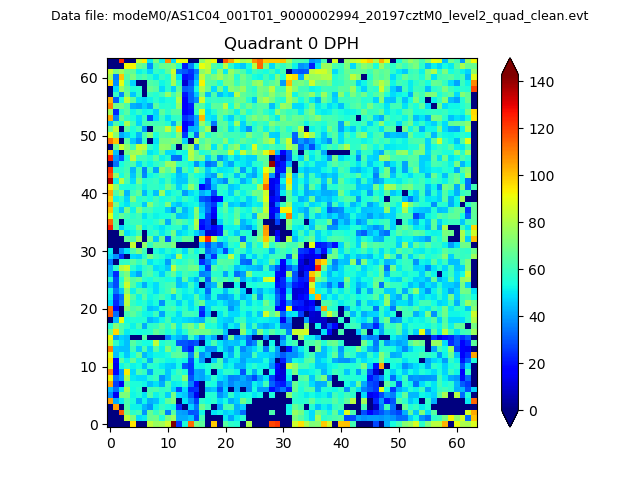 |
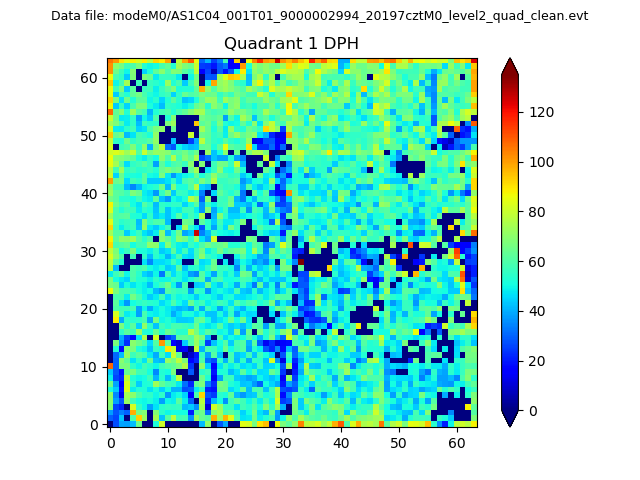 |
Quadrant B |
|---|---|---|---|
| Quadrant D | 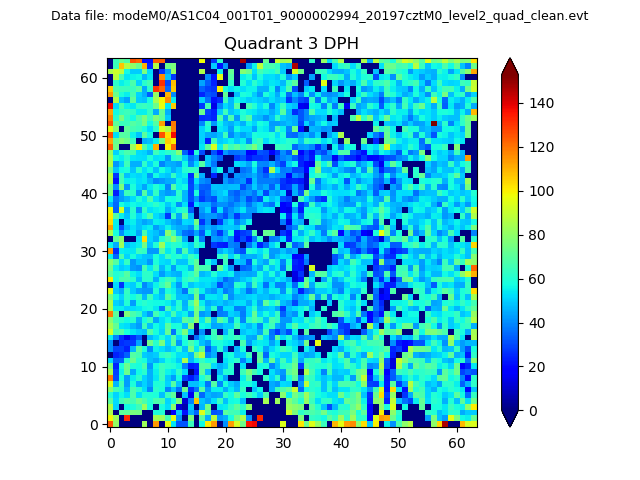 |
 |
Quadrant C |
| Plot type | Count rate plots | Images |
|---|---|---|
| Comparison with Poisson distribution Blue bars denote a histogram of data divided into 1 sec bins. Red curve is a Poisson curve with rate = median count rate of data. |
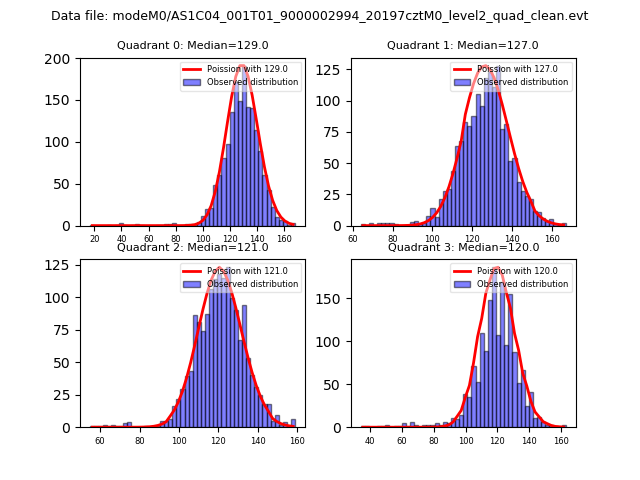 |
 |
| Quadrant-wise count rates Data is divided into 100 sec bins |
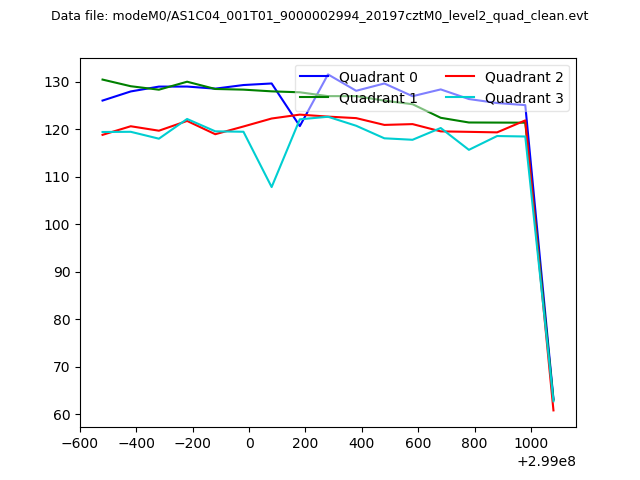 |
|
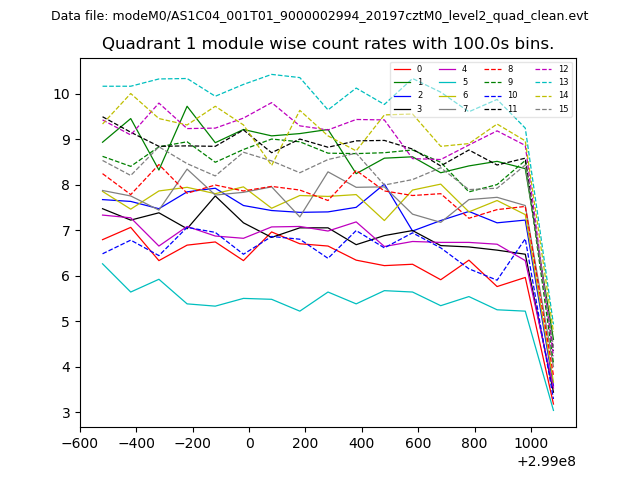
| Module-wise count rates for Quadrant A Data is divided into 100 sec bins |
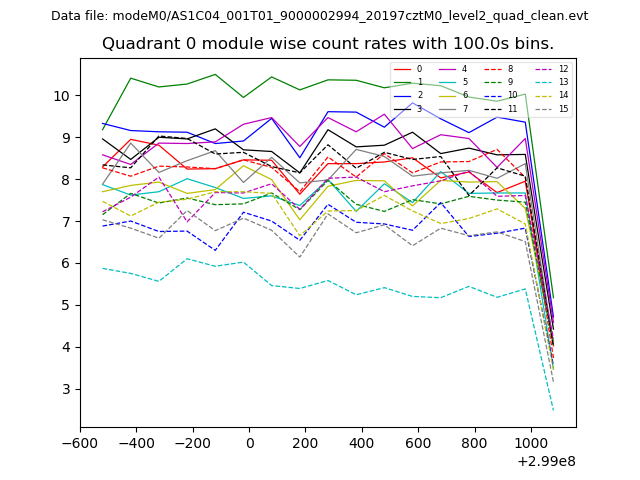 |
 |
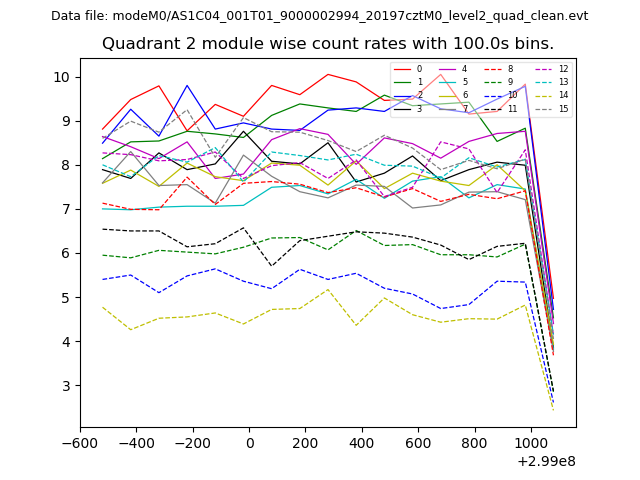
| Module-wise count rates for Quadrant B Data is divided into 100 sec bins |
 |
 |
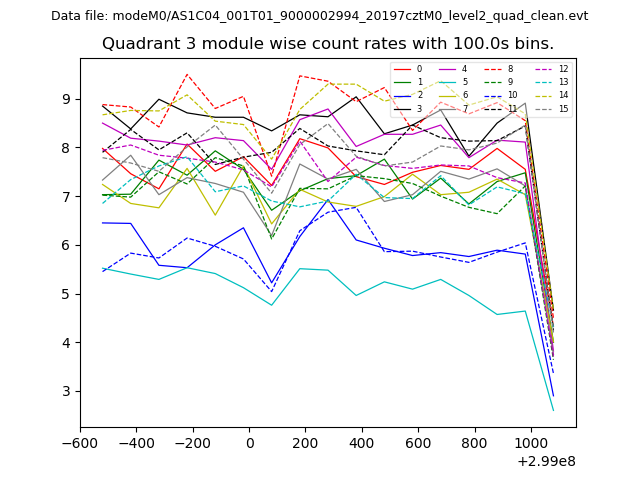
| Module-wise count rates for Quadrant C Data is divided into 100 sec bins |
 |
 |
| Module-wise count rates for Quadrant D Data is divided into 100 sec bins |
 |
 |
| Parameter | Plot |
|---|---|
| CZT HV Monitor | 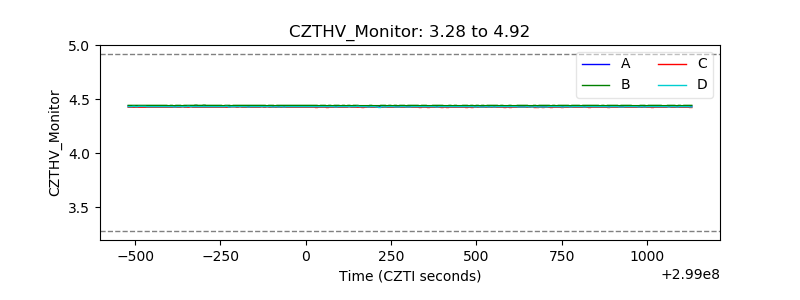 |
| D_VDD | 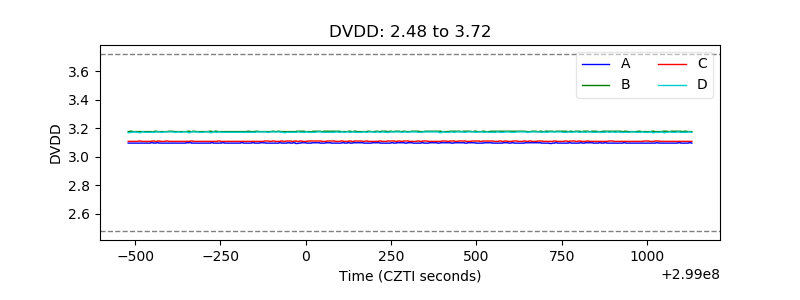 |
| Temperature 1 |  |
| Veto HV Monitor | 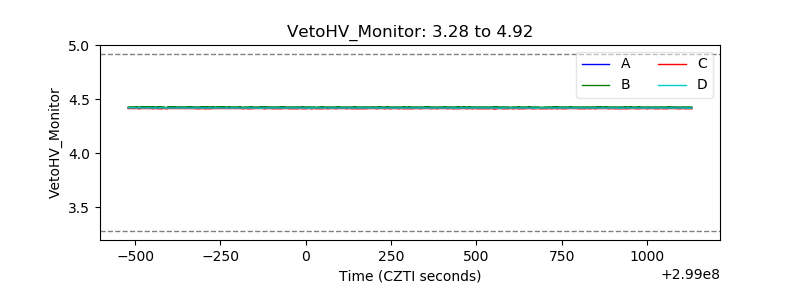 |
| Veto LLD | 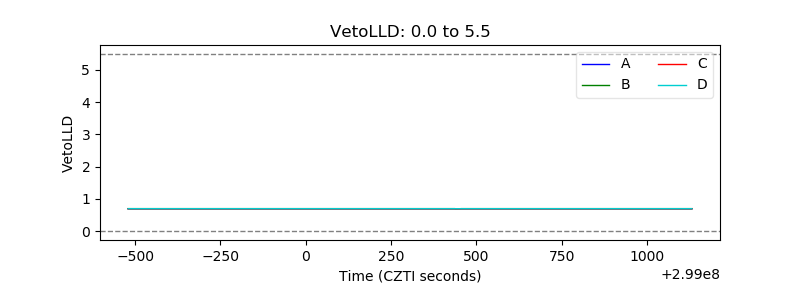 |
| Alpha Counter | 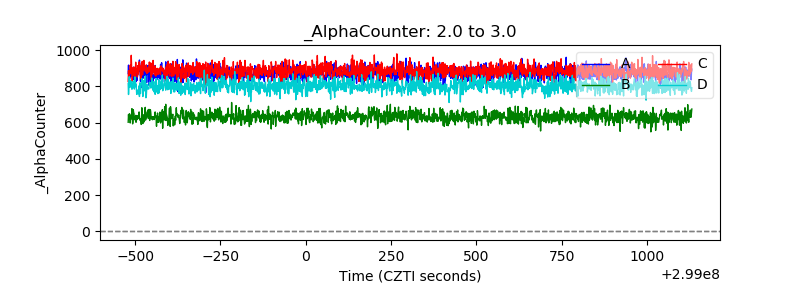 |
| _CPM_Rate | 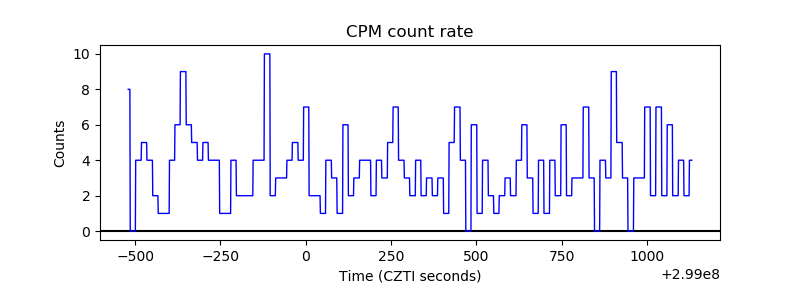 |
| CZT Counter | 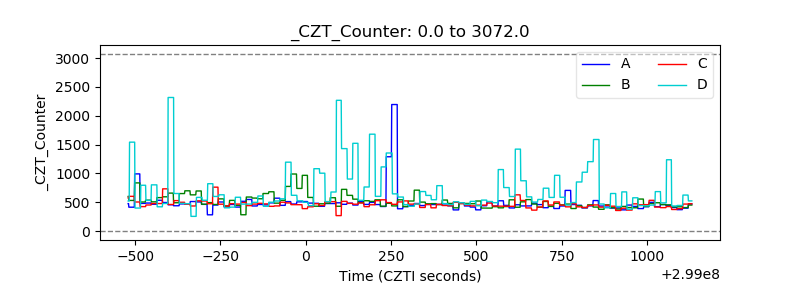 |
| +2.5 Volts monitor |  |
| +5 Volts monitor | 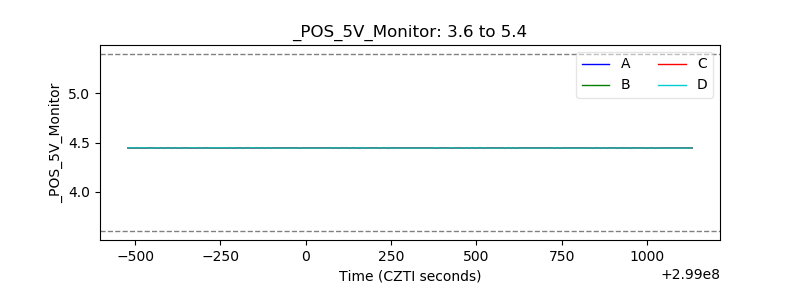 |
| _ROLL_ROT | 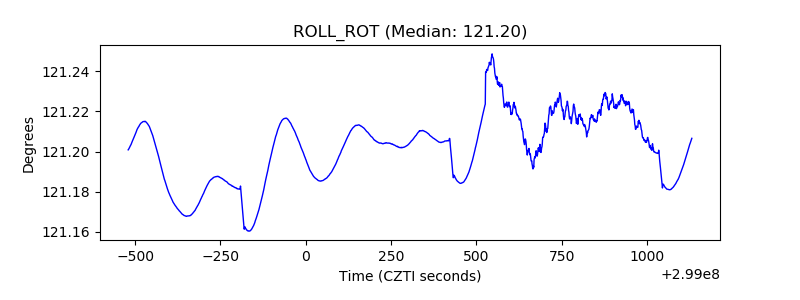 |
| _Roll_DEC |  |
| _Roll_RA | 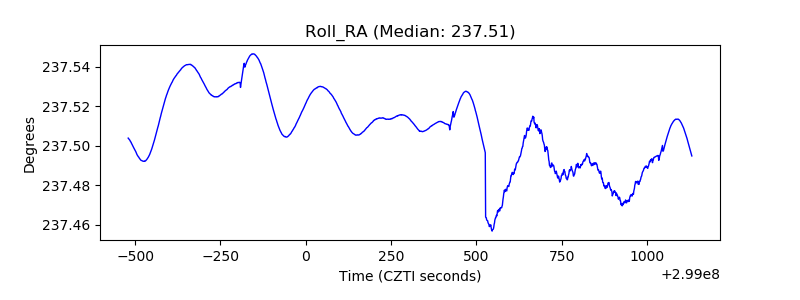 |
| Veto Counter | 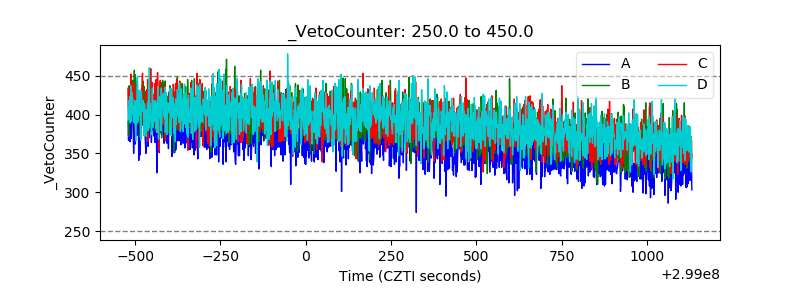 |