| Param | Original file | Final file |
|---|---|---|
| Filename | modeM0/AS1A06_005T02_9000002996cztM0_level2.fits | modeM0/AS1A06_005T02_9000002996cztM0_level2_quad_clean.evt |
| Size (bytes) | 688,760,640 | 605,813,760 |
| Size | 656.9 MB | 577.7 MB |
| Events in quadrant A | 4,293,932 | 3,634,882 |
| Events in quadrant B | 4,081,340 | 3,586,411 |
| Events in quadrant C | 4,154,066 | 3,362,664 |
| Events in quadrant D | 3,615,270 | 3,047,073 |
| Mode M0 | |||
|---|---|---|---|
| Quadrant | BADHDUFLAG | Total packets | Discarded packets |
| A | 0 | 145162 | 0 |
| B | 0 | 151518 | 0 |
| C | 0 | 143644 | 0 |
| D | 0 | 161768 | 0 |
| Mode SS | |||
|---|---|---|---|
| Quadrant | BADHDUFLAG | Total packets | Discarded packets |
| A | 0 | 1396 | 0 |
| B | 0 | 1396 | 0 |
| C | 0 | 1396 | 0 |
| D | 0 | 1396 | 0 |
| Mode M9 | |||
|---|---|---|---|
| Quadrant | BADHDUFLAG | Total packets | Discarded packets |
| A | 0 | 121 | 0 |
| B | 0 | 121 | 0 |
| C | 0 | 121 | 0 |
| D | 0 | 121 | 0 |
| Quadrant | Total seconds | Saturated seconds | Saturation percentage |
|---|---|---|---|
| A | 68769 | 893 | 1.298550% |
| B | 68769 | 1110 | 1.614099% |
| C | 68769 | 1022 | 1.486135% |
| D | 68769 | 1575 | 2.290276% |
Noise dominated data is calculated using 1-second bins in cleaned event files. If a bin has >2000 counts, and if more than 50% of those come from <1% of pixels, then it is considered to be noise-dominated and hence unusable.
| Quadrant | # 1 sec bins | Bins with >0 counts | Bins with >2000 counts | High rate bins dominated by noise | Noise dominated (total time) | Noise dominated (detector-on time) | Marked lightcurve |
|---|---|---|---|---|---|---|---|
| A | 80629 | 68768 | 0 | 0 | 0.00% | 0.00% |  |
| B | 80629 | 68768 | 0 | 0 | 0.00% | 0.00% |  |
| C | 80629 | 68769 | 0 | 0 | 0.00% | 0.00% |  |
| D | 80629 | 68762 | 0 | 0 | 0.00% | 0.00% | 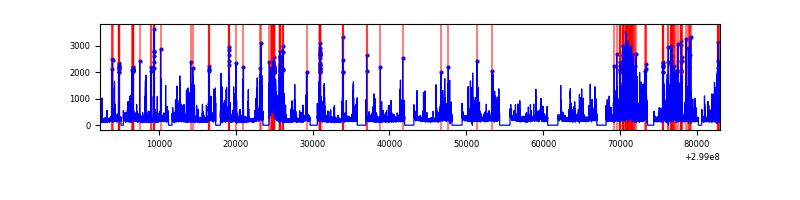 |
Top three noisy pixels from each quadrant. If the there are fewer than three noisy pixels in the level2.evt file, extra rows are filled as -1
| Pixel properties | Quadrant properties | ||||||
|---|---|---|---|---|---|---|---|
| Quadrant | DetID | PixID | Counts | Sigma | Mean | Median | Sigma |
| A | 0 | 29 | 4377 | 11.96 | 1117 | 1050 | 278.3 |
| A | 7 | 110 | 3381 | 8.38 | 1117 | 1050 | 278.3 |
| A | 0 | 30 | 3341 | 8.23 | 1117 | 1050 | 278.3 |
| B | 2 | 9 | 3191 | 10.28 | 1080 | 1033 | 209.9 |
| B | 5 | 128 | 2721 | 8.04 | 1080 | 1033 | 209.9 |
| B | 14 | 254 | 2713 | 8.01 | 1080 | 1033 | 209.9 |
| C | 1 | 81 | 3227 | 7.92 | 1097 | 1029 | 277.6 |
| C | 1 | 80 | 3187 | 7.77 | 1097 | 1029 | 277.6 |
| C | 12 | 241 | 2842 | 6.53 | 1097 | 1029 | 277.6 |
| D | 3 | 14 | 2644 | 6.21 | 1035 | 946 | 273.6 |
| D | 7 | 3 | 2565 | 5.92 | 1035 | 946 | 273.6 |
| D | 10 | 189 | 2557 | 5.89 | 1035 | 946 | 273.6 |
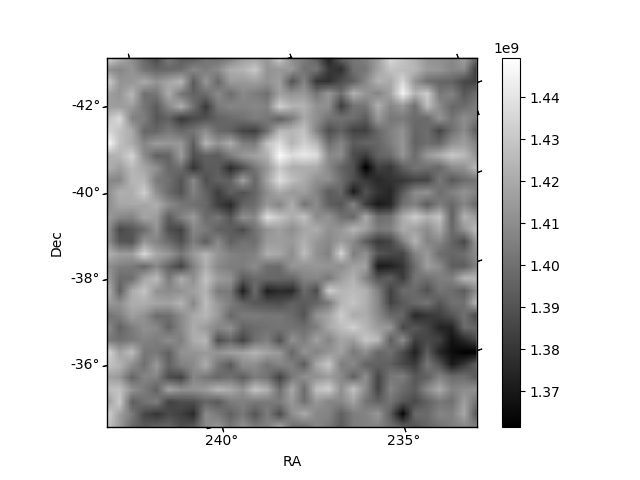
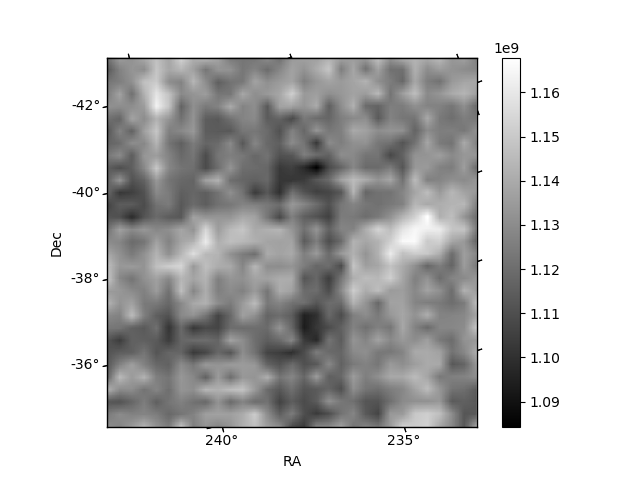
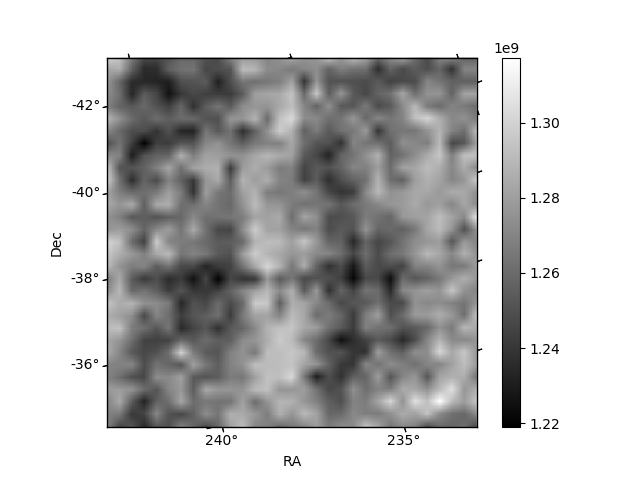
Histogram calculated using DETX and DETY for each event in the final _common_clean file
| Quadrant A | 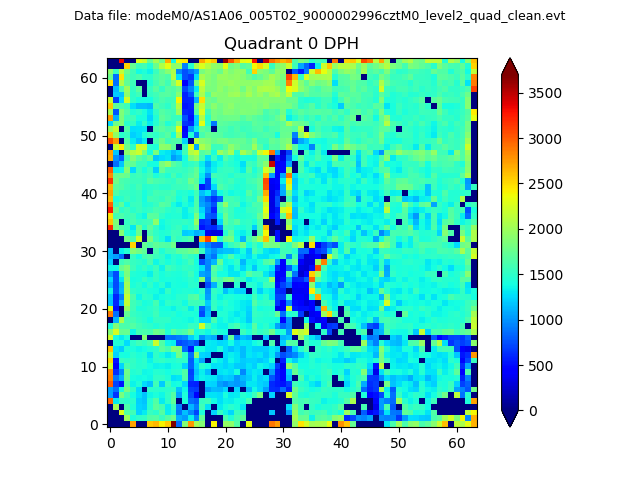 |
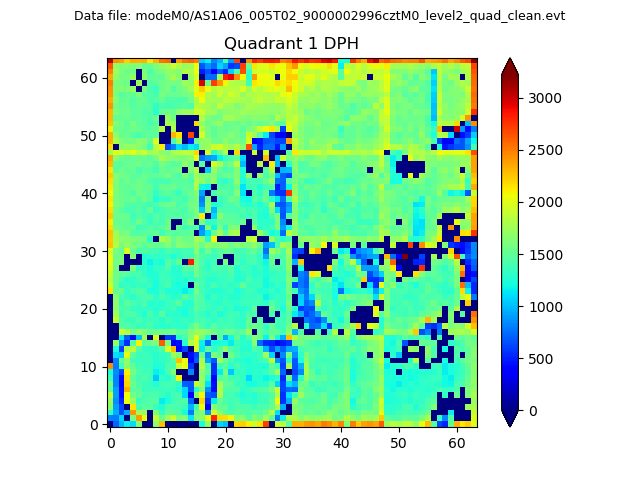 |
Quadrant B |
|---|---|---|---|
| Quadrant D | 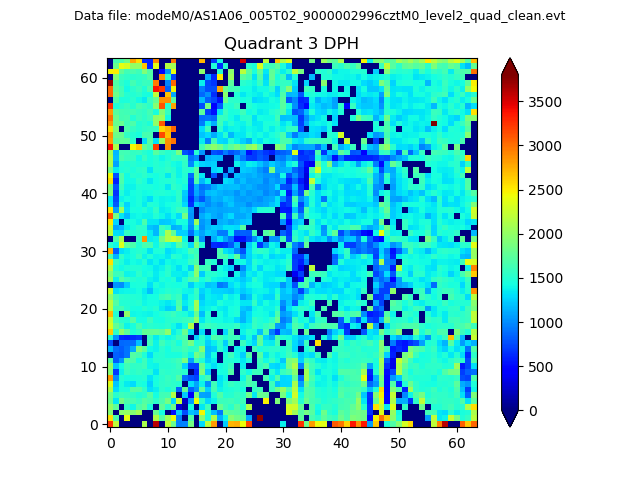 |
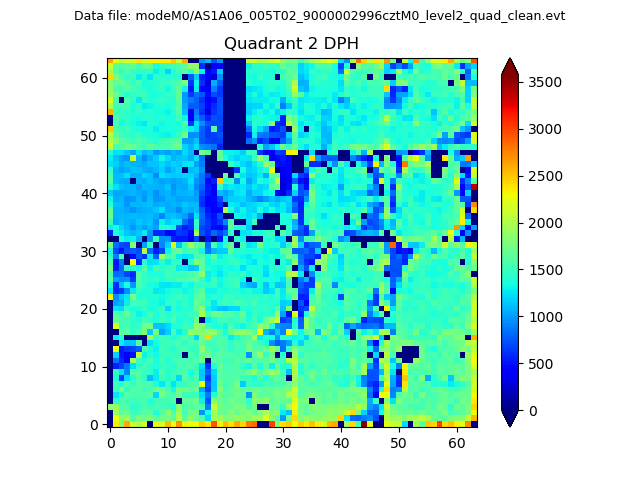 |
Quadrant C |
| Plot type | Count rate plots | Images |
|---|---|---|
| Comparison with Poisson distribution Blue bars denote a histogram of data divided into 1 sec bins. Red curve is a Poisson curve with rate = median count rate of data. |
 |
 |
| Quadrant-wise count rates Data is divided into 100 sec bins |
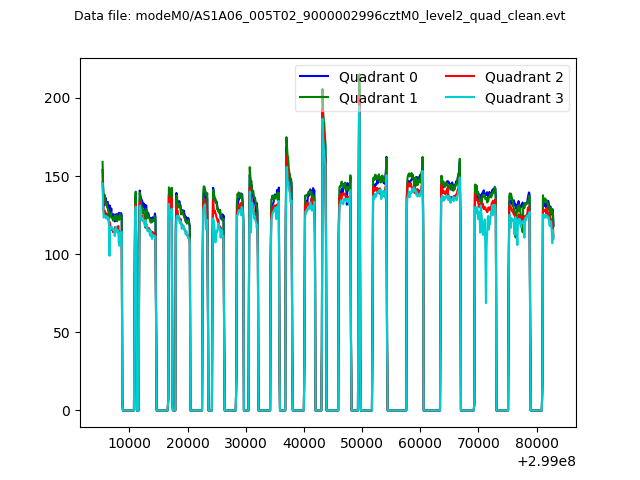 |
|
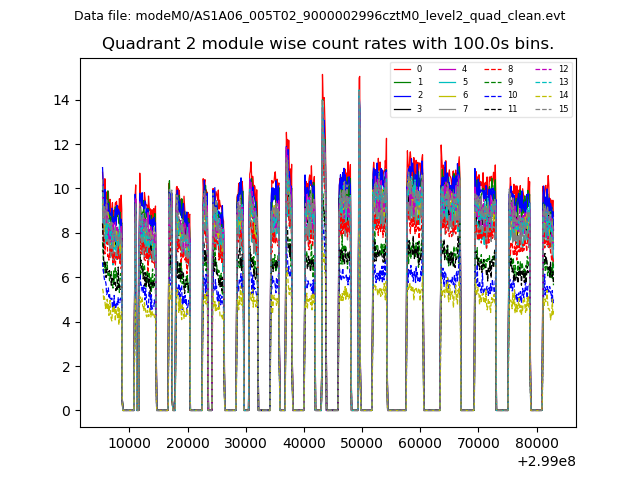
| Module-wise count rates for Quadrant A Data is divided into 100 sec bins |
 |
 |
| Module-wise count rates for Quadrant B Data is divided into 100 sec bins |
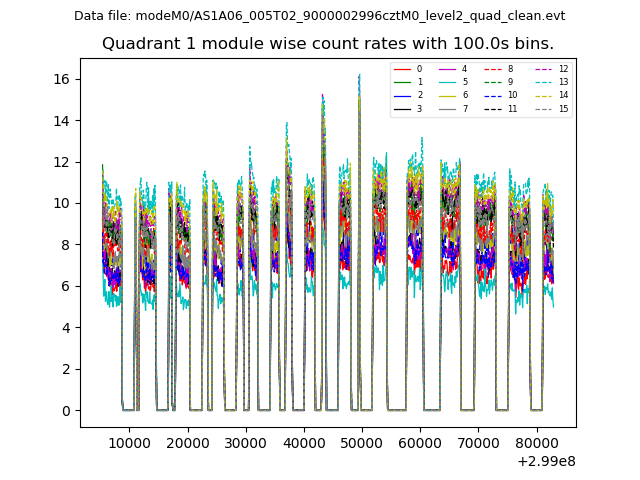 |
 |
| Module-wise count rates for Quadrant C Data is divided into 100 sec bins |
 |
 |
| Module-wise count rates for Quadrant D Data is divided into 100 sec bins |
 |
 |
| Parameter | Plot |
|---|---|
| CZT HV Monitor | 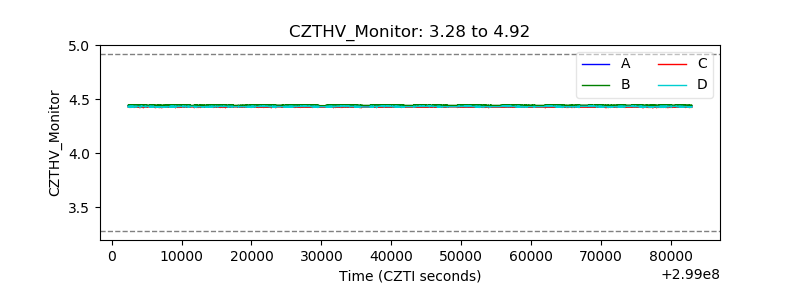 |
| D_VDD | 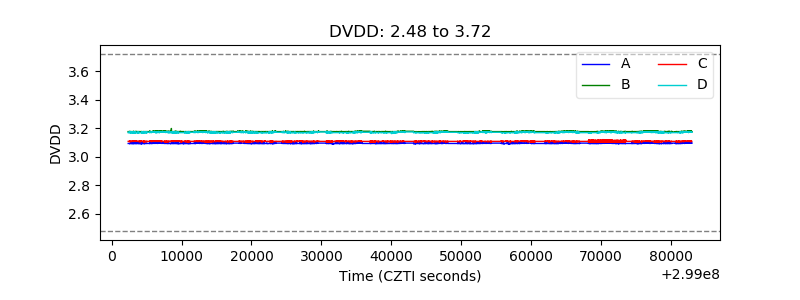 |
| Temperature 1 |  |
| Veto HV Monitor | 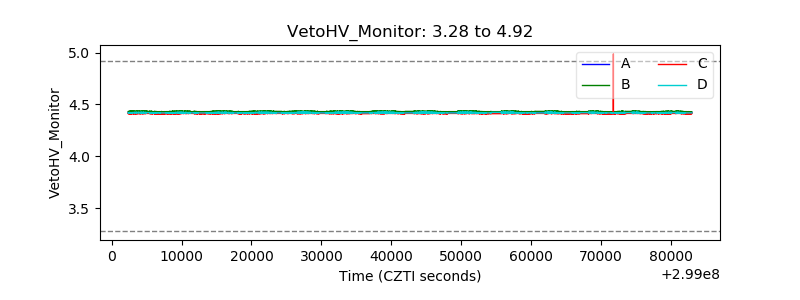 |
| Veto LLD | 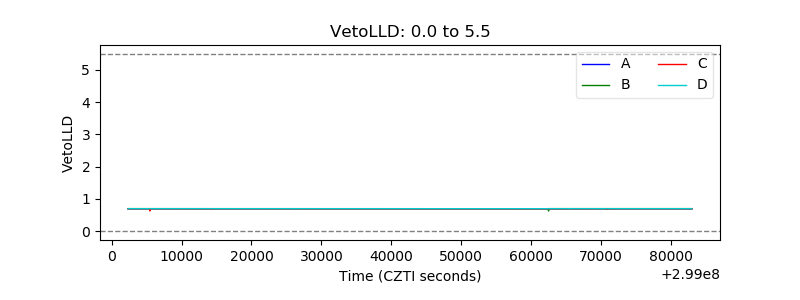 |
| Alpha Counter |  |
| _CPM_Rate | 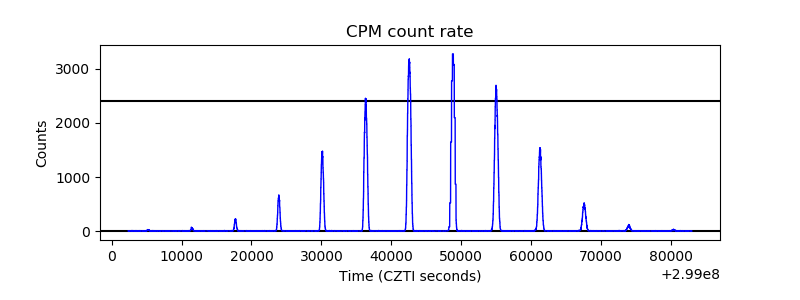 |
| CZT Counter | 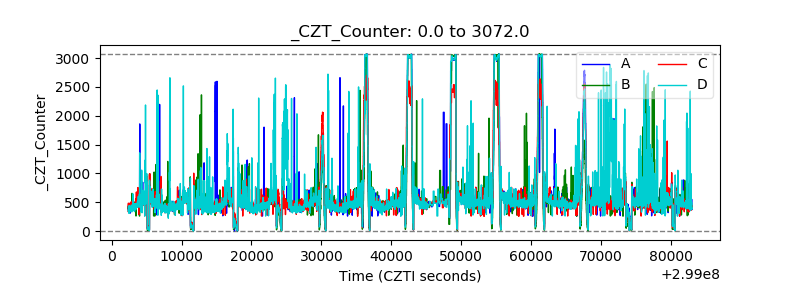 |
| +2.5 Volts monitor |  |
| +5 Volts monitor |  |
| _ROLL_ROT | 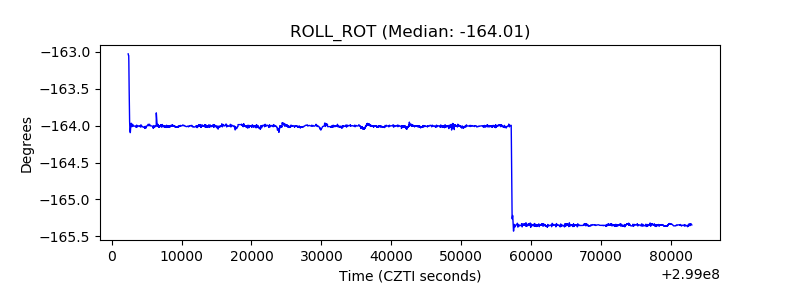 |
| _Roll_DEC | 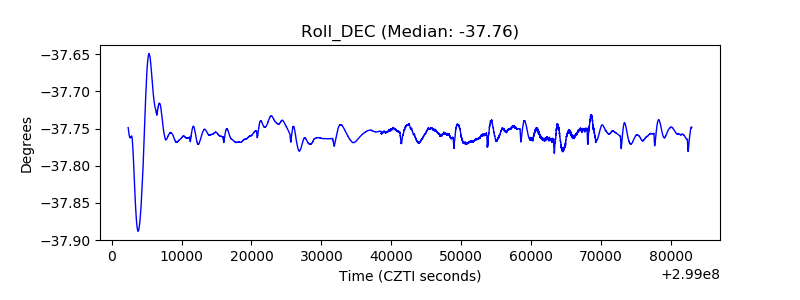 |
| _Roll_RA |  |
| Veto Counter | 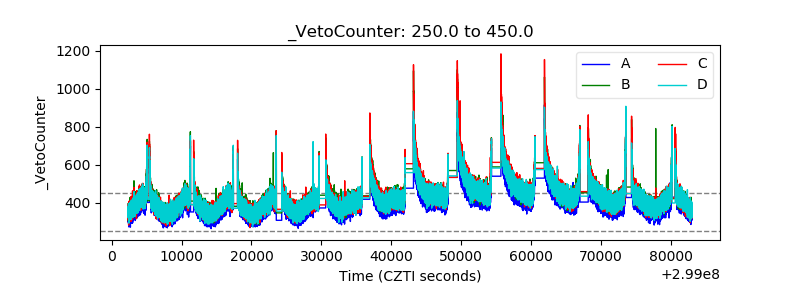 |