| Param | Original file | Final file |
|---|---|---|
| Filename | modeM0/AS1A06_005T02_9000002996_20201cztM0_level2.evt | modeM0/AS1A06_005T02_9000002996_20201cztM0_level2_quad_clean.evt |
| Size (bytes) | 482,811,840 | 92,560,320 |
| Size | 460.4 MB | 88.3 MB |
| Events in quadrant A | 3,220,578 | 605,886 |
| Events in quadrant B | 3,301,761 | 610,923 |
| Events in quadrant C | 3,182,834 | 570,865 |
| Events in quadrant D | 4,465,901 | 552,159 |
| Mode M0 | |||
|---|---|---|---|
| Quadrant | BADHDUFLAG | Total packets | Discarded packets |
| A | 0 | 13863 | 2 |
| B | 0 | 14003 | 2 |
| C | 0 | 13606 | 2 |
| D | 0 | 18029 | 2 |
| Mode SS | |||
|---|---|---|---|
| Quadrant | BADHDUFLAG | Total packets | Discarded packets |
| A | 0 | 134 | 0 |
| B | 0 | 134 | 0 |
| C | 0 | 134 | 0 |
| D | 0 | 134 | 0 |
| Mode M9 | |||
|---|---|---|---|
| Quadrant | BADHDUFLAG | Total packets | Discarded packets |
| A | 0 | 16 | 0 |
| B | 0 | 17 | 0 |
| C | 0 | 17 | 0 |
| D | 0 | 17 | 0 |
| Quadrant | Total seconds | Saturated seconds | Saturation percentage |
|---|---|---|---|
| A | 6645 | 54 | 0.812641% |
| B | 6645 | 40 | 0.601956% |
| C | 6645 | 37 | 0.556810% |
| D | 6645 | 187 | 2.814146% |
Noise dominated data is calculated using 1-second bins in cleaned event files. If a bin has >2000 counts, and if more than 50% of those come from <1% of pixels, then it is considered to be noise-dominated and hence unusable.
| Quadrant | # 1 sec bins | Bins with >0 counts | Bins with >2000 counts | High rate bins dominated by noise | Noise dominated (total time) | Noise dominated (detector-on time) | Marked lightcurve |
|---|---|---|---|---|---|---|---|
| A | 7585 | 6646 | 22 | 22 | 0.29% | 0.33% | 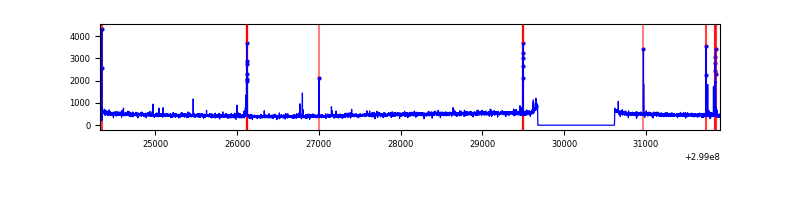 |
| B | 7585 | 6646 | 7 | 7 | 0.09% | 0.11% | 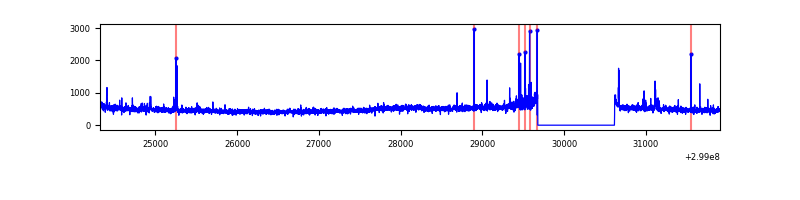 |
| C | 7585 | 6646 | 0 | 0 | 0.00% | 0.00% | 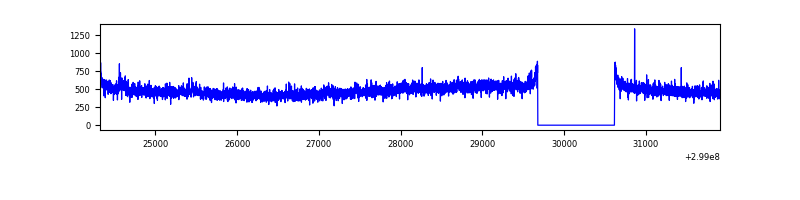 |
| D | 7585 | 6646 | 270 | 270 | 3.56% | 4.06% |  |
Top three noisy pixels from each quadrant. If the there are fewer than three noisy pixels in the level2.evt file, extra rows are filled as -1
| Pixel properties | Quadrant properties | ||||||
|---|---|---|---|---|---|---|---|
| Quadrant | DetID | PixID | Counts | Sigma | Mean | Median | Sigma |
| A | 14 | 238 | 108596 | 662.36 | 799 | 784 | 162.8 |
| A | 10 | 253 | 28965 | 173.14 | 799 | 784 | 162.8 |
| A | 13 | 254 | 7873 | 43.55 | 799 | 784 | 162.8 |
| B | 7 | 220 | 52189 | 333.87 | 799 | 778 | 154.0 |
| B | 0 | 230 | 34054 | 216.1 | 799 | 778 | 154.0 |
| B | 0 | 183 | 23947 | 150.46 | 799 | 778 | 154.0 |
| C | 14 | 238 | 118499 | 658.38 | 759 | 764 | 178.8 |
| C | 3 | 233 | 94941 | 526.64 | 759 | 764 | 178.8 |
| C | 13 | 61 | 5295 | 25.34 | 759 | 764 | 178.8 |
| D | 1 | 52 | 1352152 | 7281.37 | 761 | 738 | 185.6 |
| D | 7 | 238 | 108296 | 579.52 | 761 | 738 | 185.6 |
| D | 2 | 120 | 37201 | 196.46 | 761 | 738 | 185.6 |
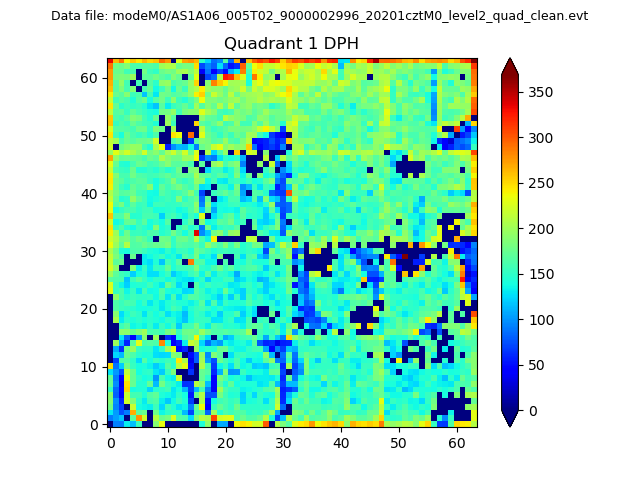
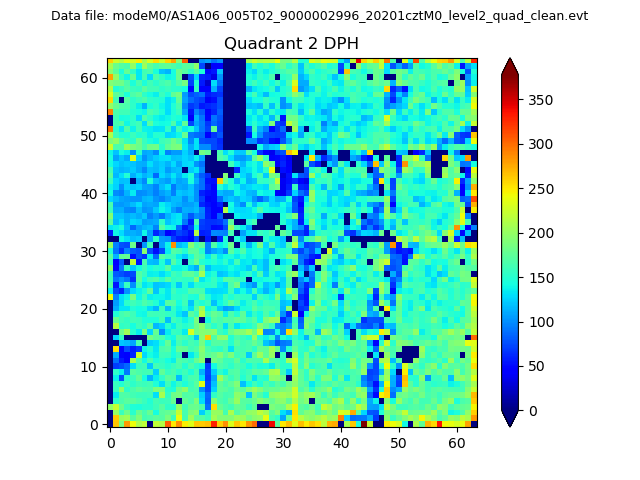
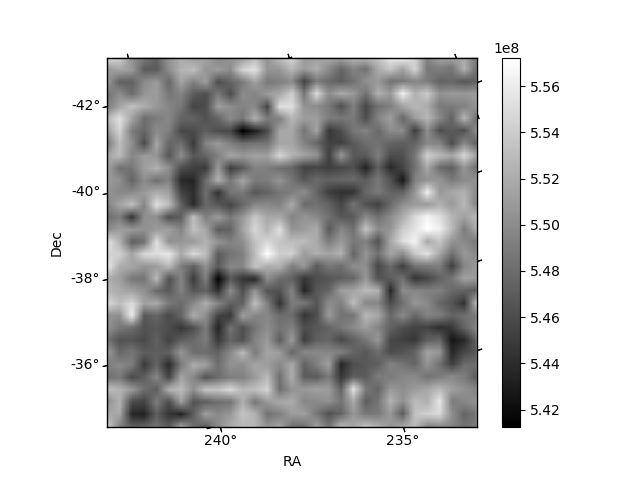
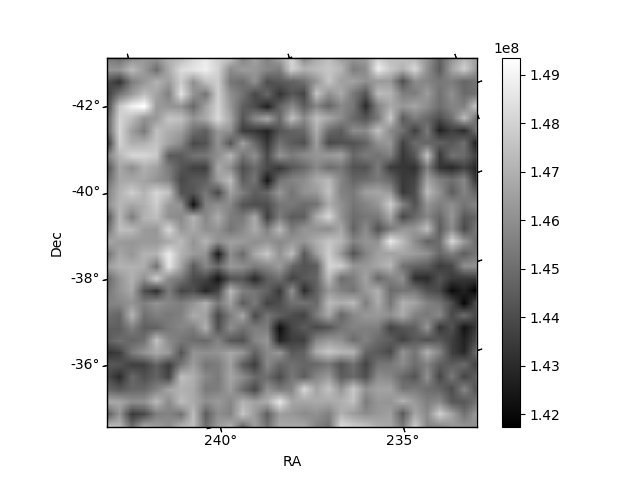
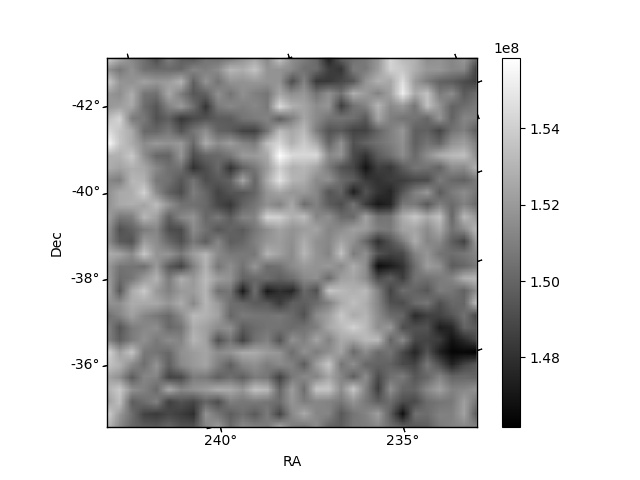
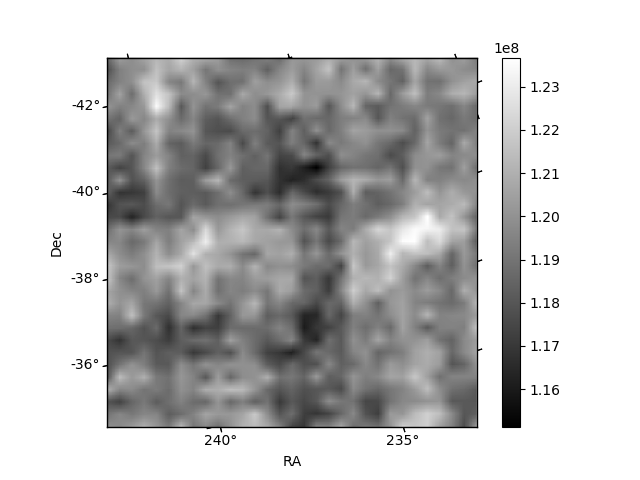
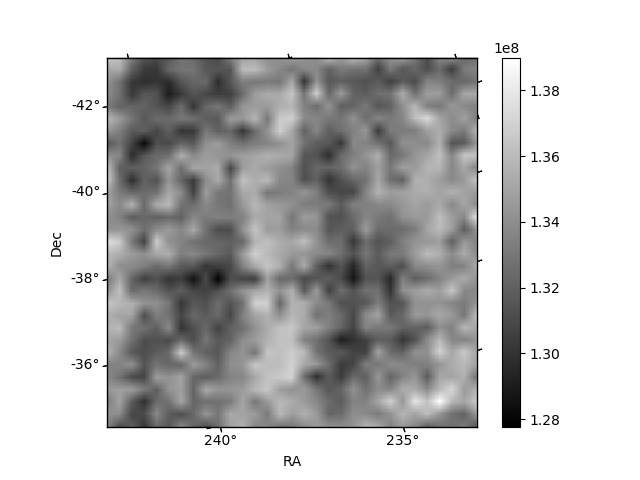
Histogram calculated using DETX and DETY for each event in the final _common_clean file
| Quadrant A | 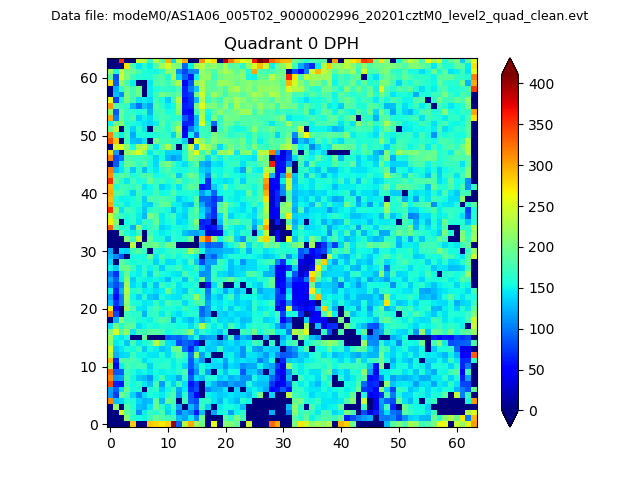 |
 |
Quadrant B |
|---|---|---|---|
| Quadrant D | 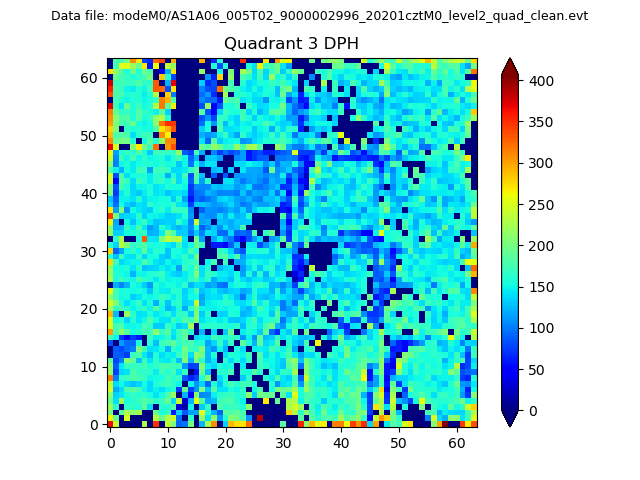 |
 |
Quadrant C |
| Plot type | Count rate plots | Images |
|---|---|---|
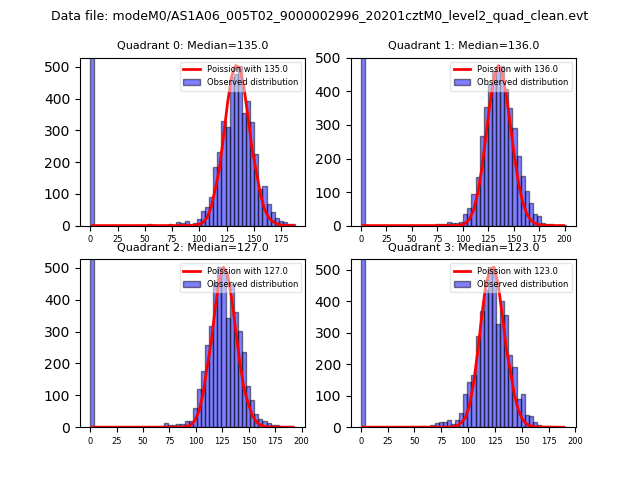
| Comparison with Poisson distribution Blue bars denote a histogram of data divided into 1 sec bins. Red curve is a Poisson curve with rate = median count rate of data. |
 |
 |
| Quadrant-wise count rates Data is divided into 100 sec bins |
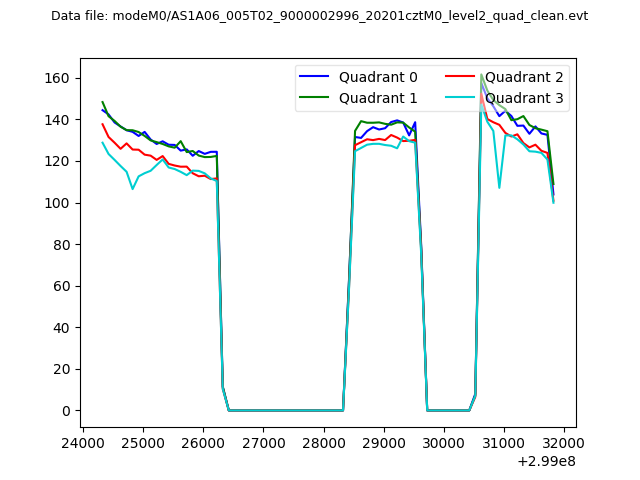 |
|
| Module-wise count rates for Quadrant A Data is divided into 100 sec bins |
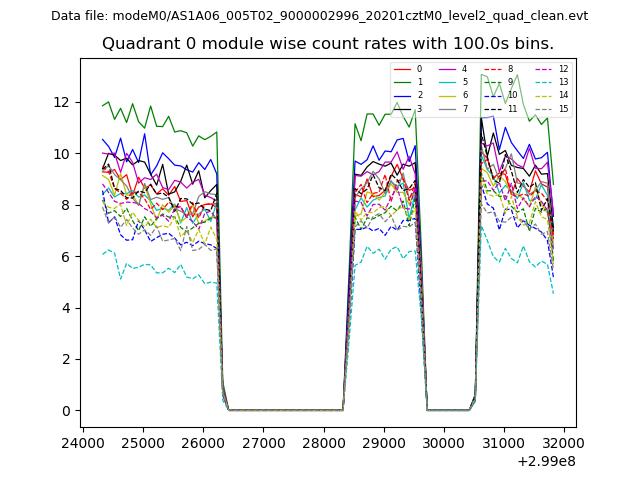 |
 |
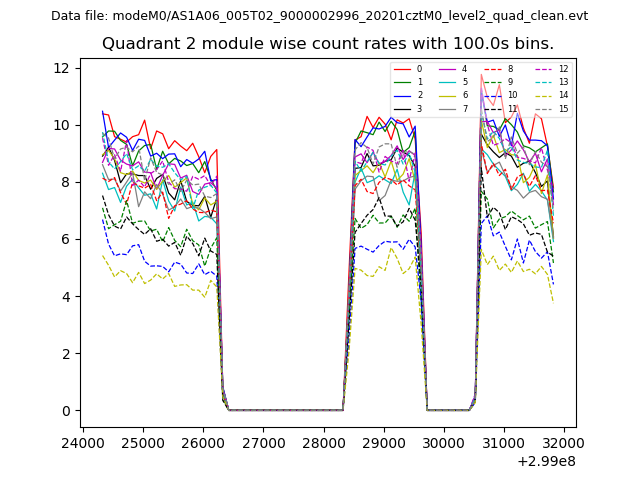
| Module-wise count rates for Quadrant B Data is divided into 100 sec bins |
 |
 |
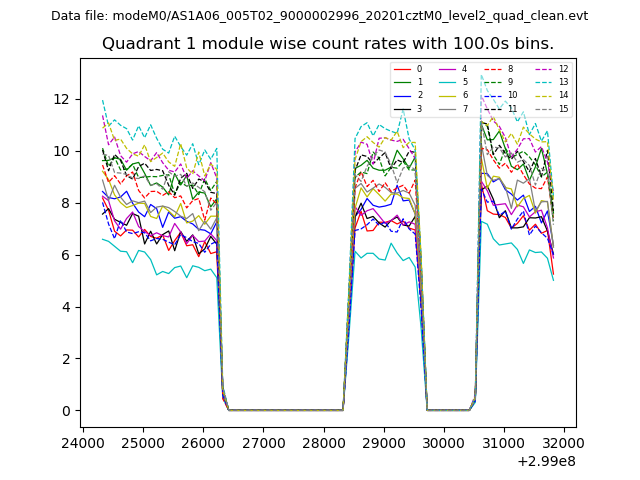
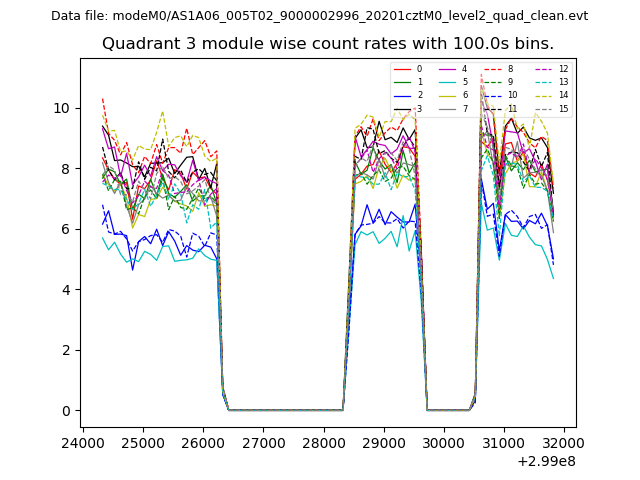
| Module-wise count rates for Quadrant C Data is divided into 100 sec bins |
 |
 |
| Module-wise count rates for Quadrant D Data is divided into 100 sec bins |
 |
 |
| Parameter | Plot |
|---|---|
| CZT HV Monitor | 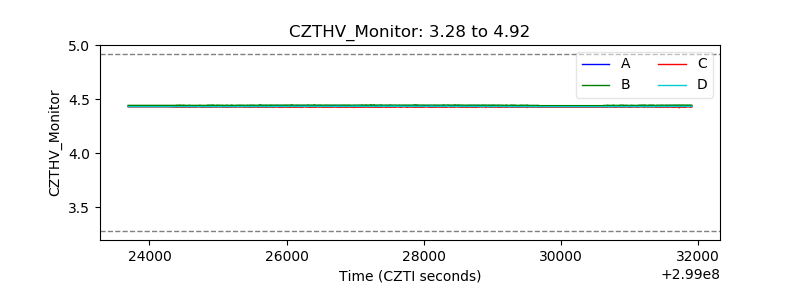 |
| D_VDD | 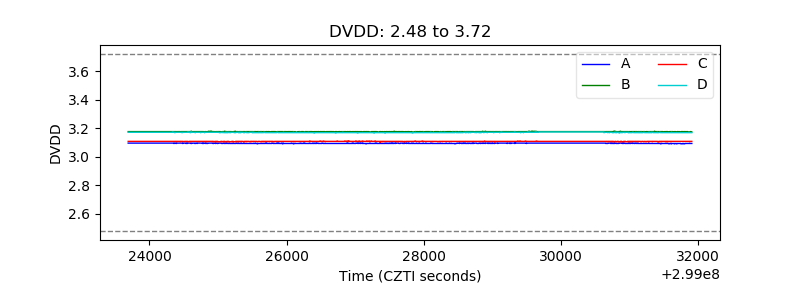 |
| Temperature 1 | 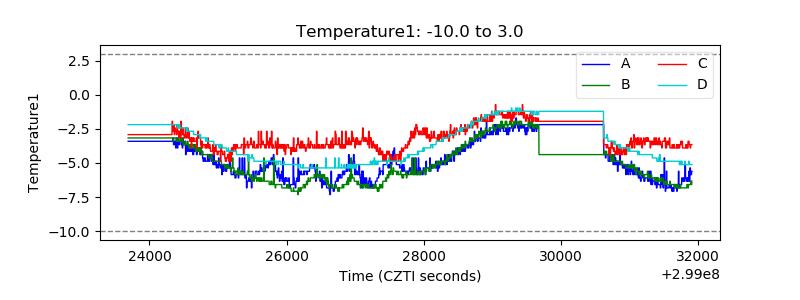 |
| Veto HV Monitor |  |
| Veto LLD | 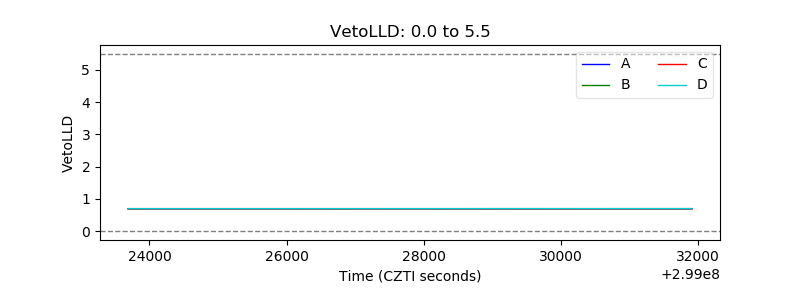 |
| Alpha Counter | 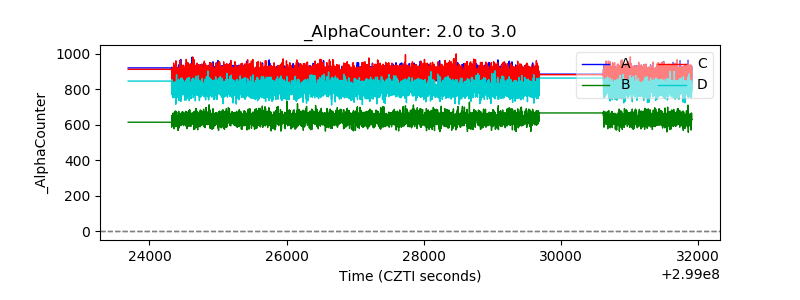 |
| _CPM_Rate | 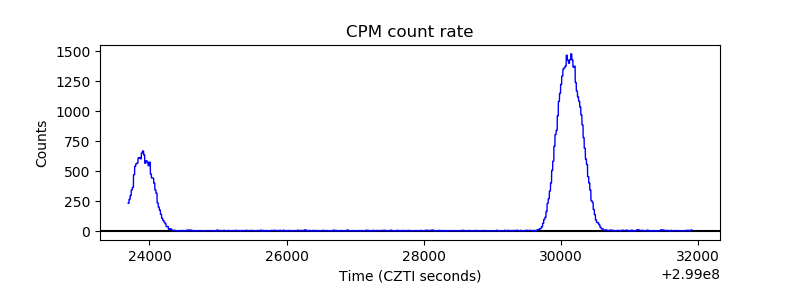 |
| CZT Counter | 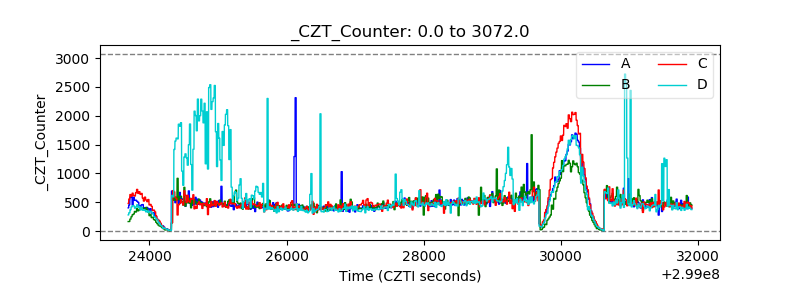 |
| +2.5 Volts monitor |  |
| +5 Volts monitor |  |
| _ROLL_ROT | 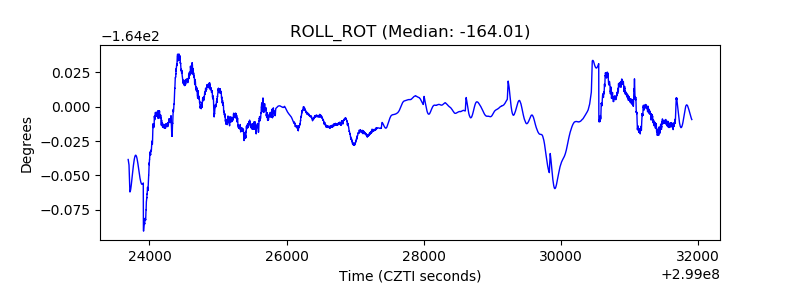 |
| _Roll_DEC | 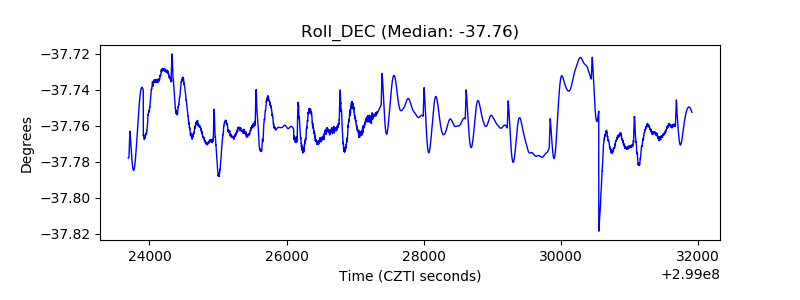 |
| _Roll_RA | 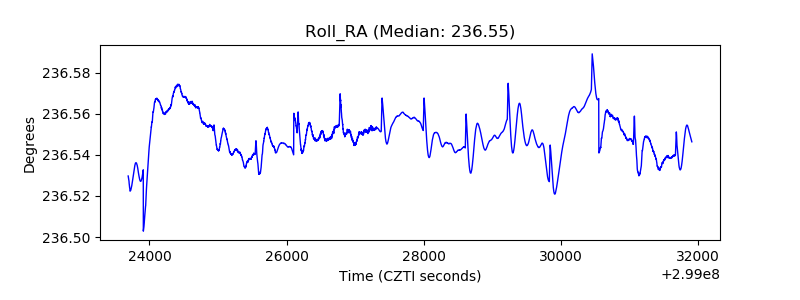 |
| Veto Counter | 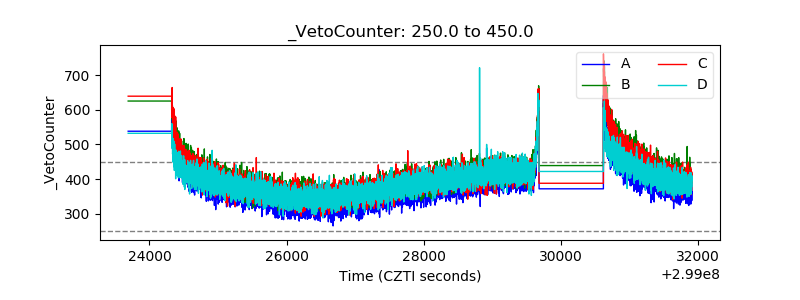 |