| Param | Original file | Final file |
|---|---|---|
| Filename | modeM0/AS1A06_005T02_9000002996_20204cztM0_level2.evt | modeM0/AS1A06_005T02_9000002996_20204cztM0_level2_quad_clean.evt |
| Size (bytes) | 445,685,760 | 85,147,200 |
| Size | 425.0 MB | 81.2 MB |
| Events in quadrant A | 3,241,397 | 542,773 |
| Events in quadrant B | 3,418,928 | 553,516 |
| Events in quadrant C | 3,241,242 | 520,937 |
| Events in quadrant D | 3,155,486 | 509,136 |
| Mode M0 | |||
|---|---|---|---|
| Quadrant | BADHDUFLAG | Total packets | Discarded packets |
| A | 0 | 13590 | 2 |
| B | 0 | 14106 | 2 |
| C | 0 | 13514 | 2 |
| D | 0 | 13594 | 2 |
| Mode SS | |||
|---|---|---|---|
| Quadrant | BADHDUFLAG | Total packets | Discarded packets |
| A | 0 | 132 | 0 |
| B | 0 | 132 | 0 |
| C | 0 | 132 | 0 |
| D | 0 | 132 | 0 |
| Mode M9 | |||
|---|---|---|---|
| Quadrant | BADHDUFLAG | Total packets | Discarded packets |
| A | 0 | 20 | 0 |
| B | 0 | 21 | 0 |
| C | 0 | 21 | 0 |
| D | 0 | 21 | 0 |
| Quadrant | Total seconds | Saturated seconds | Saturation percentage |
|---|---|---|---|
| A | 6480 | 29 | 0.447531% |
| B | 6480 | 47 | 0.725309% |
| C | 6480 | 47 | 0.725309% |
| D | 6480 | 31 | 0.478395% |
Noise dominated data is calculated using 1-second bins in cleaned event files. If a bin has >2000 counts, and if more than 50% of those come from <1% of pixels, then it is considered to be noise-dominated and hence unusable.
| Quadrant | # 1 sec bins | Bins with >0 counts | Bins with >2000 counts | High rate bins dominated by noise | Noise dominated (total time) | Noise dominated (detector-on time) | Marked lightcurve |
|---|---|---|---|---|---|---|---|
| A | 7680 | 6481 | 6 | 6 | 0.08% | 0.09% |  |
| B | 7680 | 6481 | 8 | 8 | 0.10% | 0.12% |  |
| C | 7680 | 6481 | 0 | 0 | 0.00% | 0.00% | 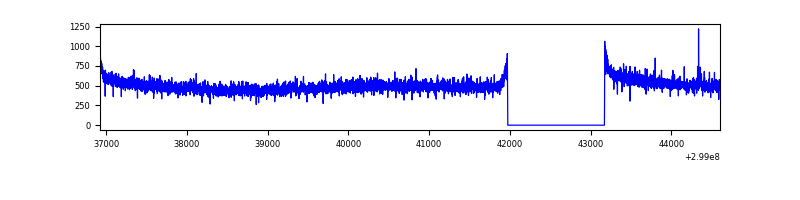 |
| D | 7680 | 6481 | 10 | 10 | 0.13% | 0.15% |  |
Top three noisy pixels from each quadrant. If the there are fewer than three noisy pixels in the level2.evt file, extra rows are filled as -1
| Pixel properties | Quadrant properties | ||||||
|---|---|---|---|---|---|---|---|
| Quadrant | DetID | PixID | Counts | Sigma | Mean | Median | Sigma |
| A | 4 | 2 | 39255 | 230.72 | 822 | 806 | 166.6 |
| A | 10 | 253 | 15680 | 89.25 | 822 | 806 | 166.6 |
| A | 14 | 238 | 11014 | 61.26 | 822 | 806 | 166.6 |
| B | 7 | 220 | 95567 | 606.22 | 829 | 809 | 156.3 |
| B | 0 | 198 | 18627 | 113.99 | 829 | 809 | 156.3 |
| B | 12 | 111 | 18299 | 111.89 | 829 | 809 | 156.3 |
| C | 14 | 238 | 125663 | 677.02 | 793 | 799 | 184.4 |
| C | 3 | 233 | 14634 | 75.01 | 793 | 799 | 184.4 |
| C | 13 | 61 | 5618 | 26.13 | 793 | 799 | 184.4 |
| D | 1 | 52 | 61073 | 310.69 | 798 | 775 | 194.1 |
| D | 11 | 176 | 24031 | 119.83 | 798 | 775 | 194.1 |
| D | 2 | 234 | 22975 | 114.39 | 798 | 775 | 194.1 |
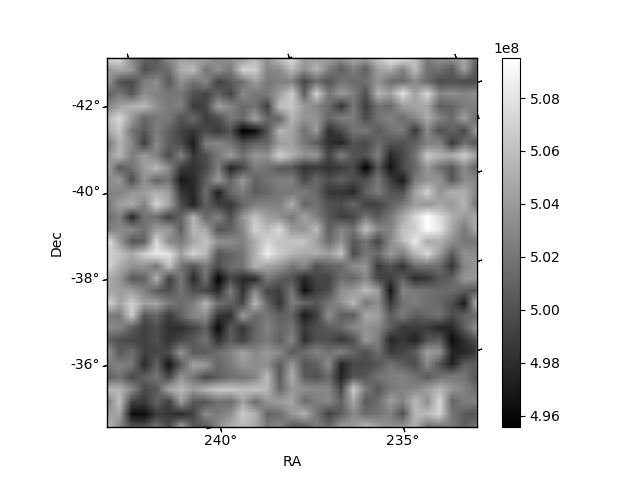
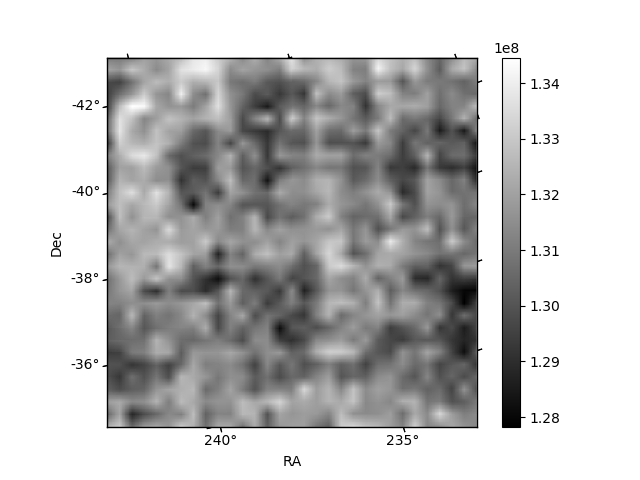
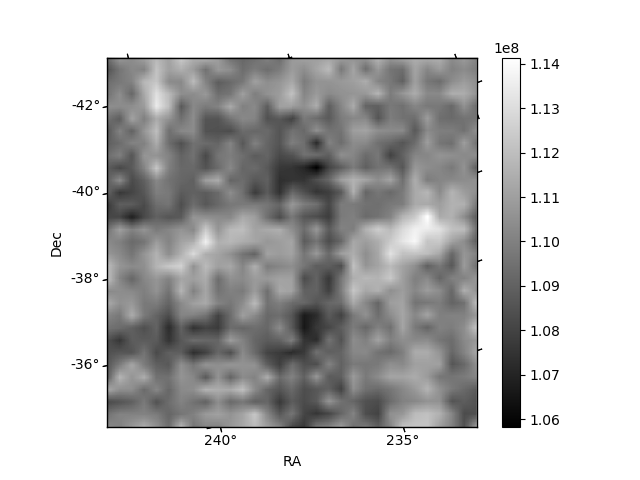
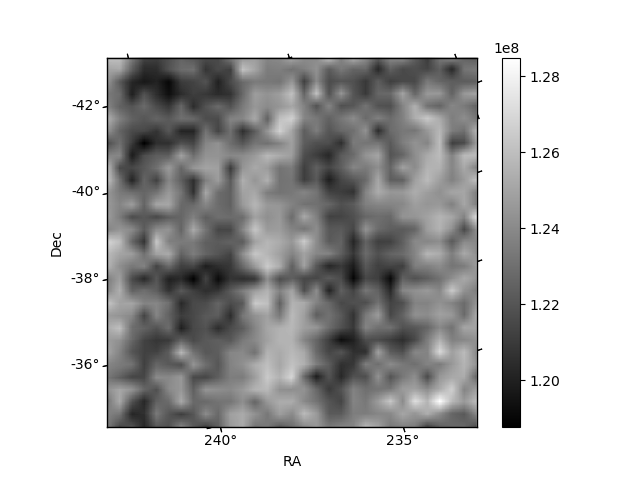
Histogram calculated using DETX and DETY for each event in the final _common_clean file
| Quadrant A | 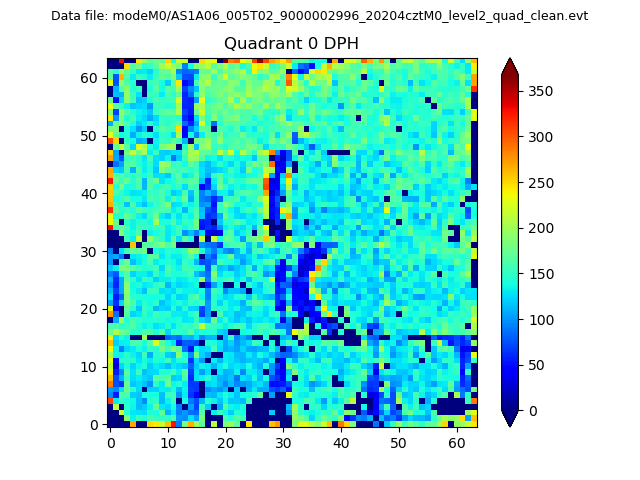 |
 |
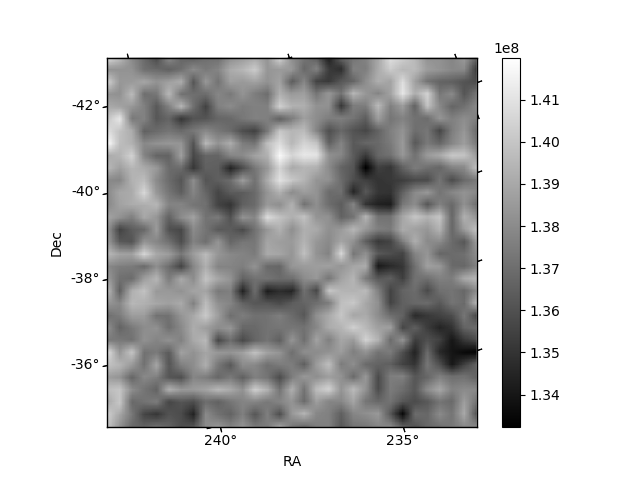
Quadrant B |
|---|---|---|---|
| Quadrant D | 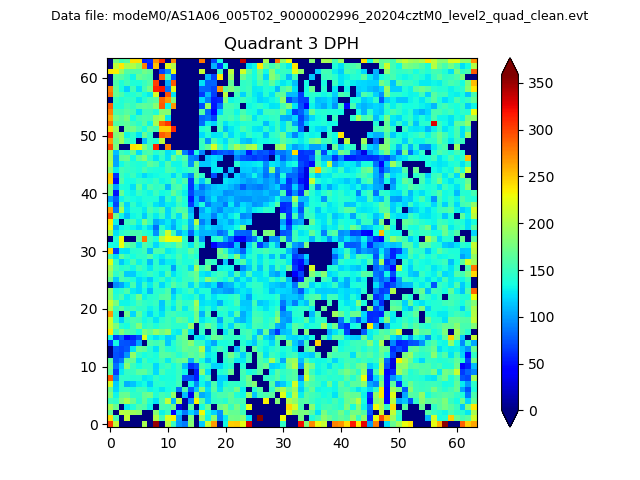 |
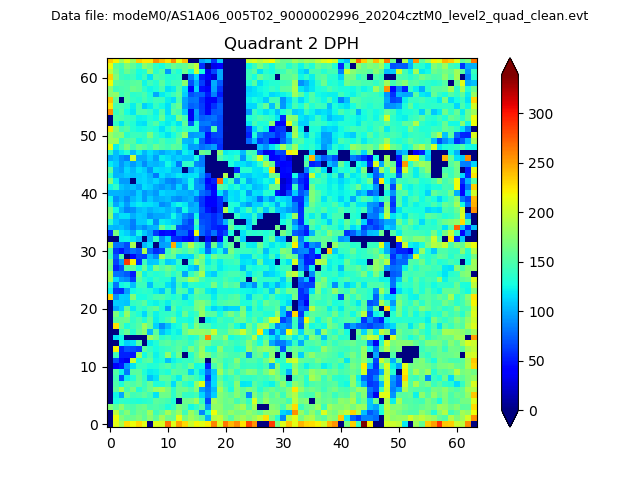 |
Quadrant C |
| Plot type | Count rate plots | Images |
|---|---|---|
| Comparison with Poisson distribution Blue bars denote a histogram of data divided into 1 sec bins. Red curve is a Poisson curve with rate = median count rate of data. |
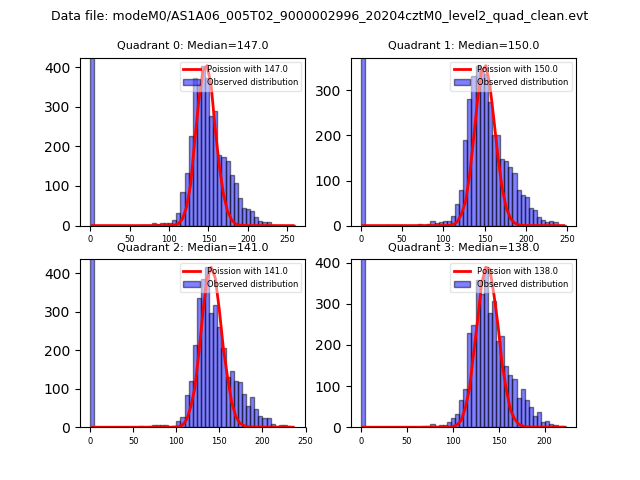 |
 |
| Quadrant-wise count rates Data is divided into 100 sec bins |
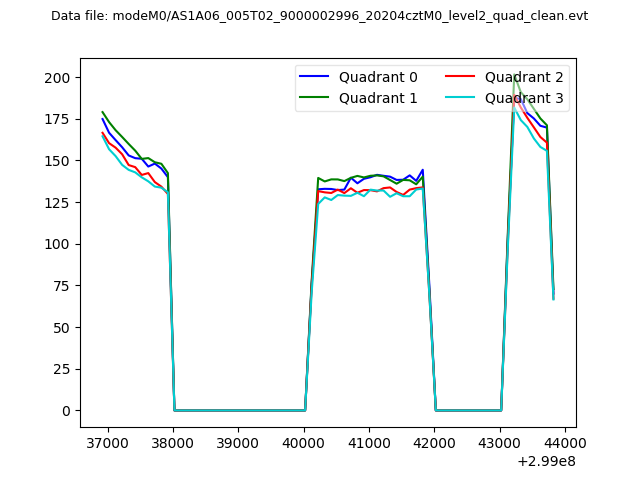 |
|
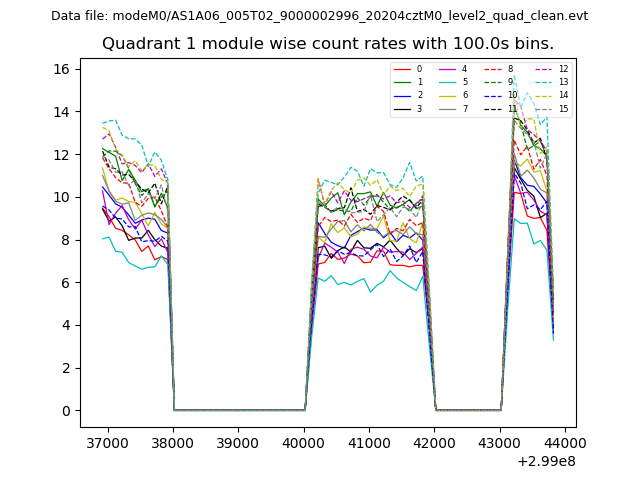
| Module-wise count rates for Quadrant A Data is divided into 100 sec bins |
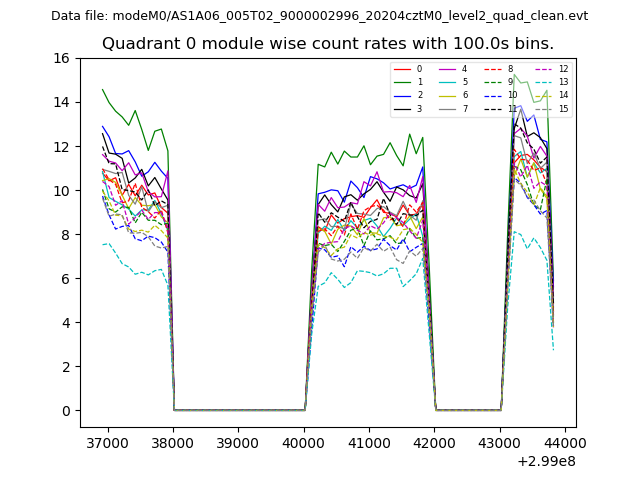 |
 |
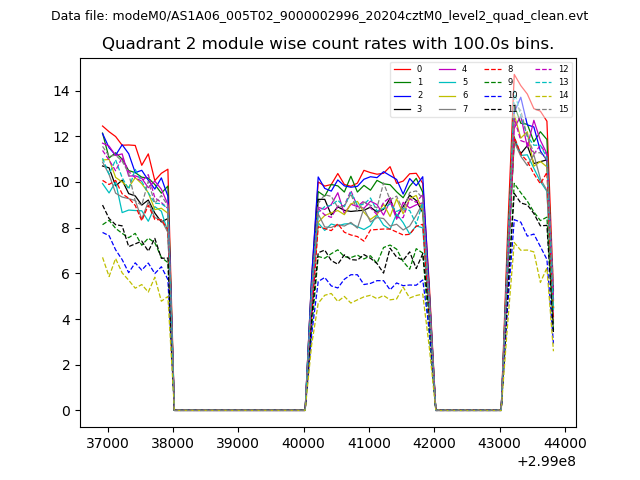
| Module-wise count rates for Quadrant B Data is divided into 100 sec bins |
 |
 |
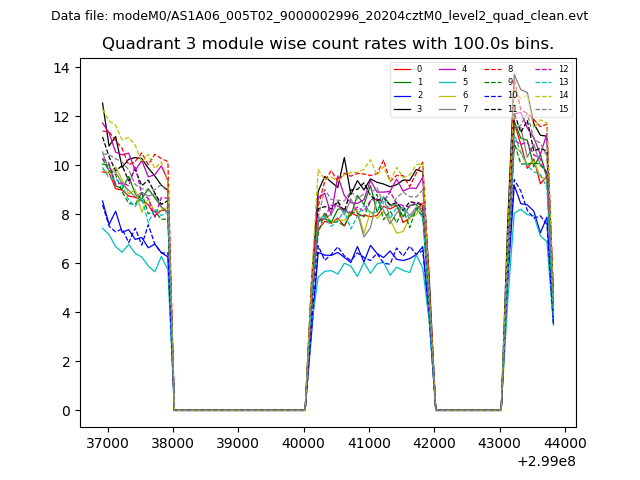
| Module-wise count rates for Quadrant C Data is divided into 100 sec bins |
 |
 |
| Module-wise count rates for Quadrant D Data is divided into 100 sec bins |
 |
 |
| Parameter | Plot |
|---|---|
| CZT HV Monitor | 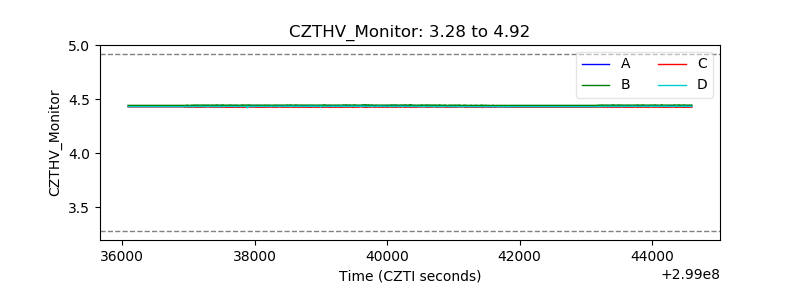 |
| D_VDD | 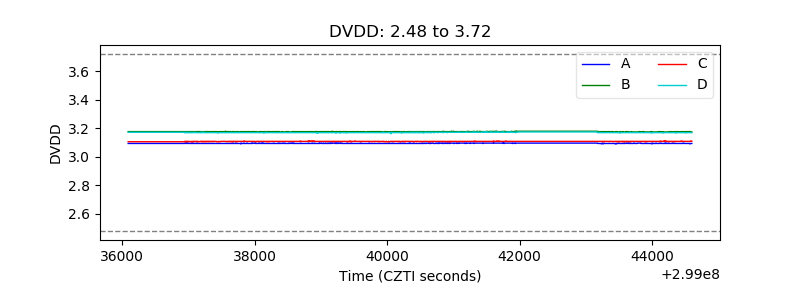 |
| Temperature 1 |  |
| Veto HV Monitor | 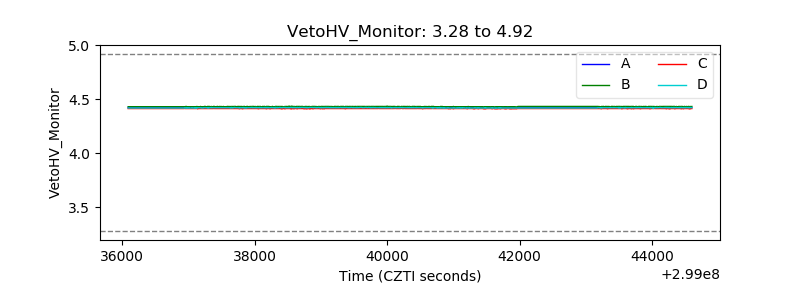 |
| Veto LLD | 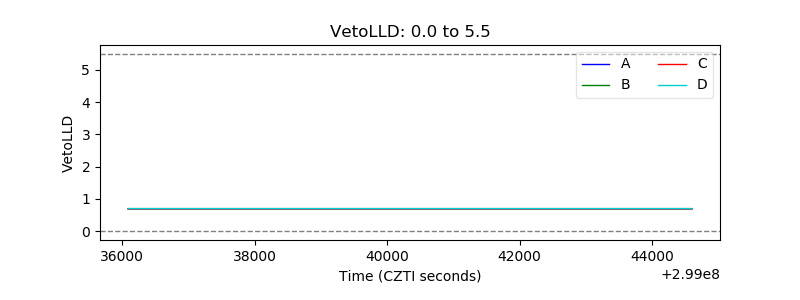 |
| Alpha Counter | 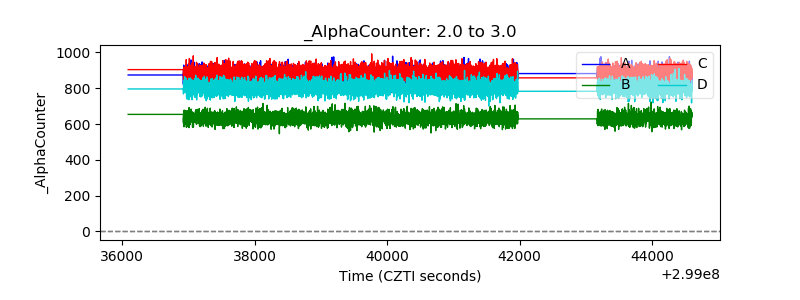 |
| _CPM_Rate | 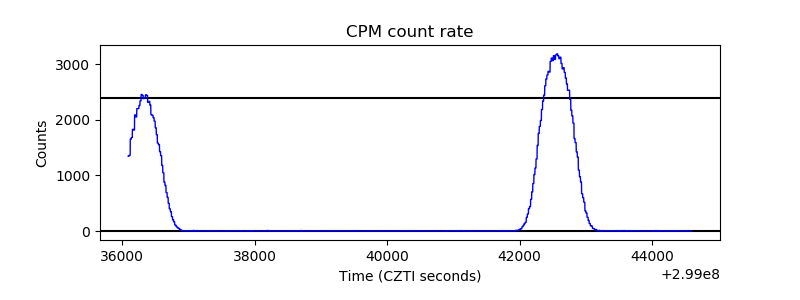 |
| CZT Counter | 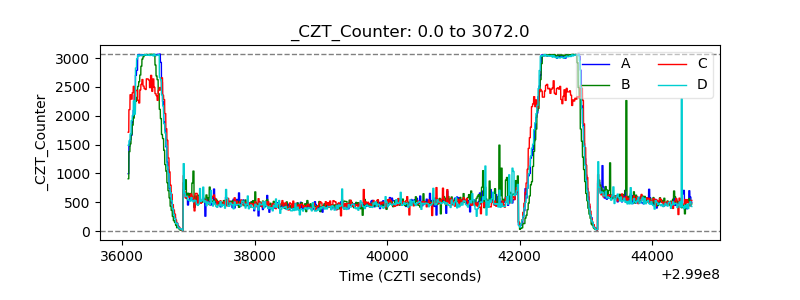 |
| +2.5 Volts monitor |  |
| +5 Volts monitor |  |
| _ROLL_ROT | 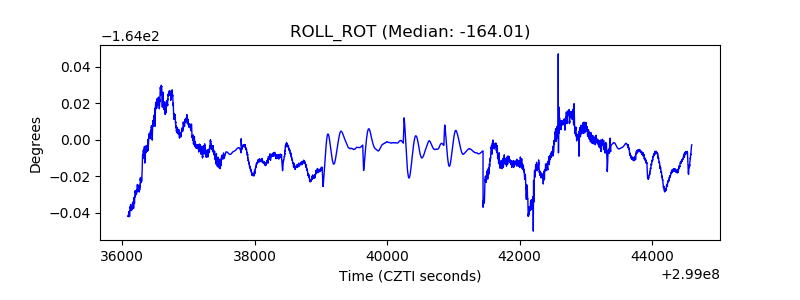 |
| _Roll_DEC | 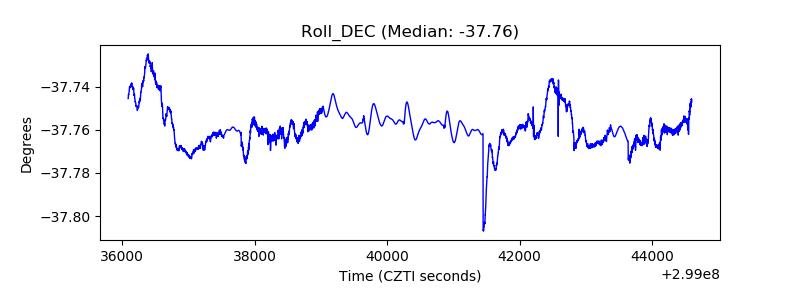 |
| _Roll_RA | 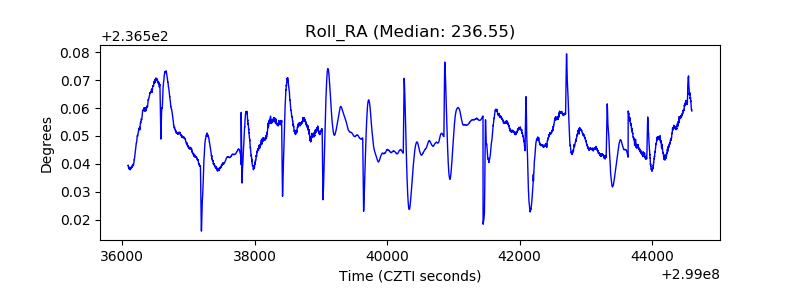 |
| Veto Counter | 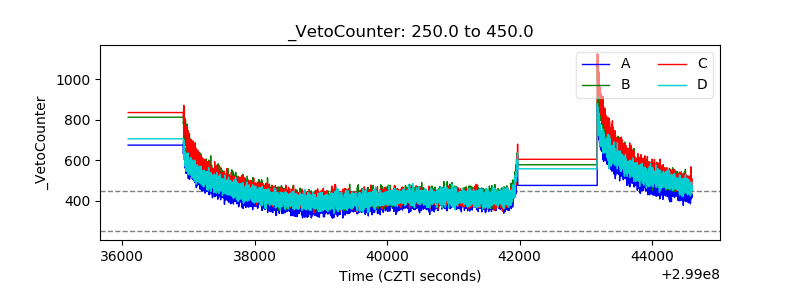 |