| Param | Original file | Final file |
|---|---|---|
| Filename | modeM0/AS1A06_005T02_9000002996_20206cztM0_level2.evt | modeM0/AS1A06_005T02_9000002996_20206cztM0_level2_quad_clean.evt |
| Size (bytes) | 461,246,400 | 68,400,000 |
| Size | 439.9 MB | 65.2 MB |
| Events in quadrant A | 3,282,484 | 418,873 |
| Events in quadrant B | 3,504,491 | 425,298 |
| Events in quadrant C | 3,352,933 | 401,772 |
| Events in quadrant D | 3,410,379 | 394,619 |
| Mode M0 | |||
|---|---|---|---|
| Quadrant | BADHDUFLAG | Total packets | Discarded packets |
| A | 0 | 13218 | 3 |
| B | 0 | 14100 | 2 |
| C | 0 | 13580 | 2 |
| D | 0 | 13751 | 2 |
| Mode SS | |||
|---|---|---|---|
| Quadrant | BADHDUFLAG | Total packets | Discarded packets |
| A | 0 | 126 | 0 |
| B | 0 | 126 | 0 |
| C | 0 | 126 | 0 |
| D | 0 | 126 | 0 |
| Mode M9 | |||
|---|---|---|---|
| Quadrant | BADHDUFLAG | Total packets | Discarded packets |
| A | 0 | 14 | 0 |
| B | 0 | 15 | 0 |
| C | 0 | 15 | 0 |
| D | 0 | 15 | 0 |
| Quadrant | Total seconds | Saturated seconds | Saturation percentage |
|---|---|---|---|
| A | 6163 | 40 | 0.649035% |
| B | 6163 | 58 | 0.941100% |
| C | 6163 | 85 | 1.379198% |
| D | 6163 | 72 | 1.168262% |
Noise dominated data is calculated using 1-second bins in cleaned event files. If a bin has >2000 counts, and if more than 50% of those come from <1% of pixels, then it is considered to be noise-dominated and hence unusable.
| Quadrant | # 1 sec bins | Bins with >0 counts | Bins with >2000 counts | High rate bins dominated by noise | Noise dominated (total time) | Noise dominated (detector-on time) | Marked lightcurve |
|---|---|---|---|---|---|---|---|
| A | 7518 | 6164 | 0 | 0 | 0.00% | 0.00% | 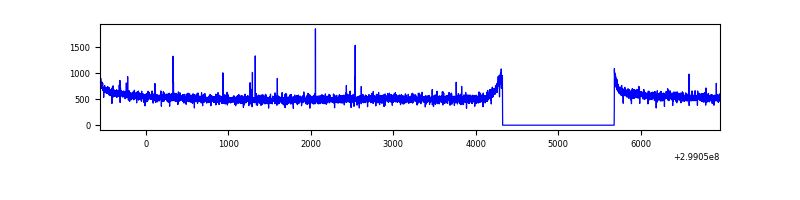 |
| B | 7518 | 6164 | 1 | 1 | 0.01% | 0.02% | 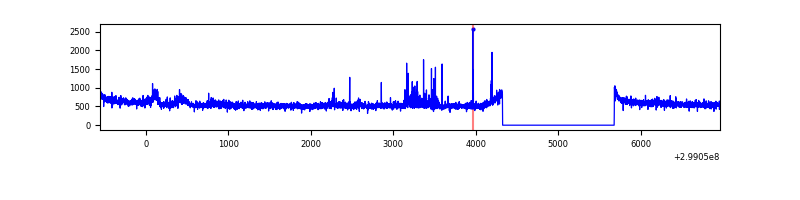 |
| C | 7518 | 6164 | 0 | 0 | 0.00% | 0.00% | 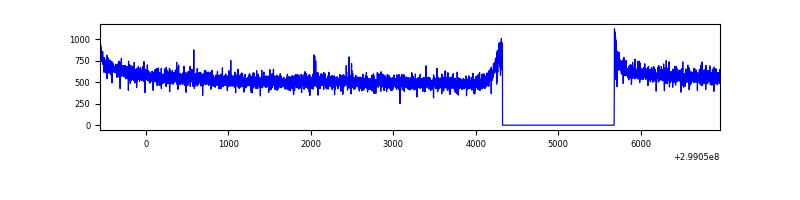 |
| D | 7518 | 6164 | 14 | 14 | 0.19% | 0.23% | 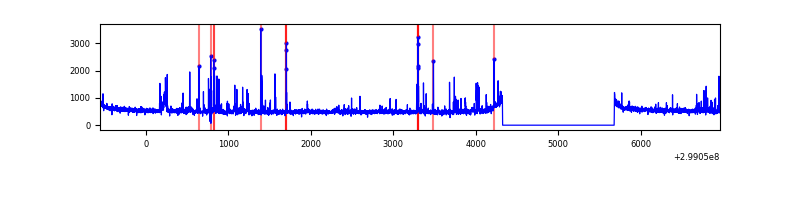 |
Top three noisy pixels from each quadrant. If the there are fewer than three noisy pixels in the level2.evt file, extra rows are filled as -1
| Pixel properties | Quadrant properties | ||||||
|---|---|---|---|---|---|---|---|
| Quadrant | DetID | PixID | Counts | Sigma | Mean | Median | Sigma |
| A | 14 | 238 | 7980 | 42.25 | 849 | 837 | 169.1 |
| A | 0 | 226 | 7292 | 38.18 | 849 | 837 | 169.1 |
| A | 3 | 137 | 6348 | 32.6 | 849 | 837 | 169.1 |
| B | 0 | 198 | 84712 | 533.99 | 853 | 837 | 157.1 |
| B | 7 | 220 | 44543 | 278.26 | 853 | 837 | 157.1 |
| B | 12 | 111 | 17982 | 109.15 | 853 | 837 | 157.1 |
| C | 14 | 238 | 131946 | 700.49 | 822 | 831 | 187.2 |
| C | 3 | 233 | 6207 | 28.72 | 822 | 831 | 187.2 |
| C | 13 | 61 | 5843 | 26.78 | 822 | 831 | 187.2 |
| D | 11 | 176 | 94113 | 468.7 | 830 | 808 | 199.1 |
| D | 1 | 52 | 74367 | 369.51 | 830 | 808 | 199.1 |
| D | 5 | 222 | 43764 | 215.78 | 830 | 808 | 199.1 |
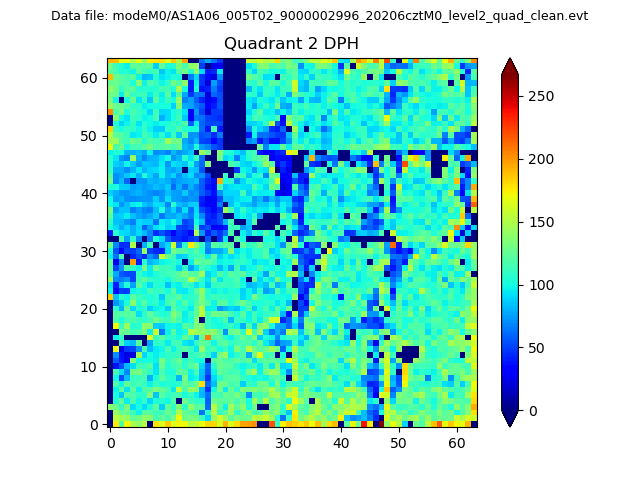
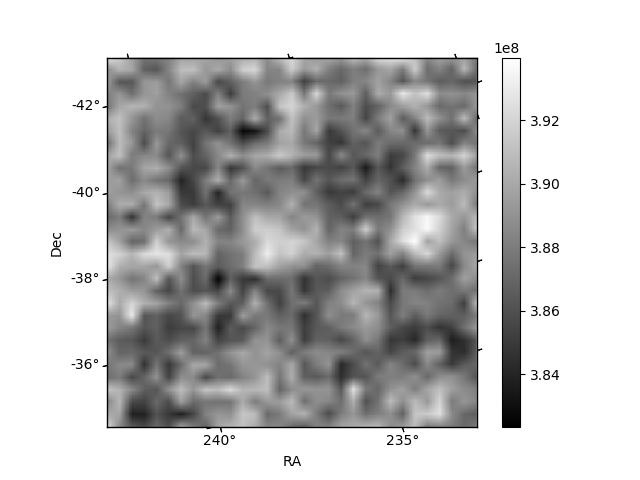
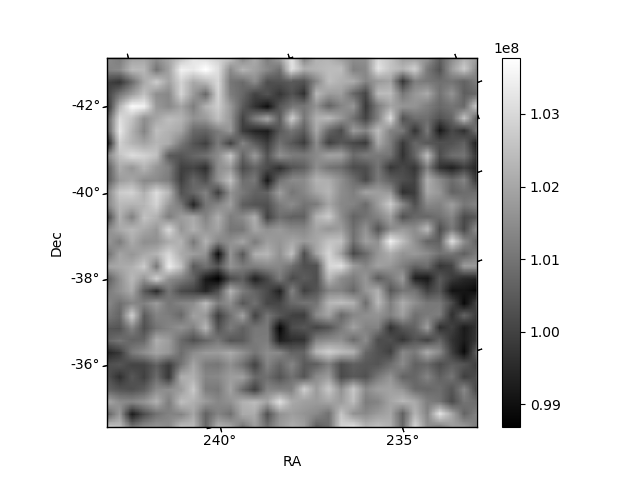
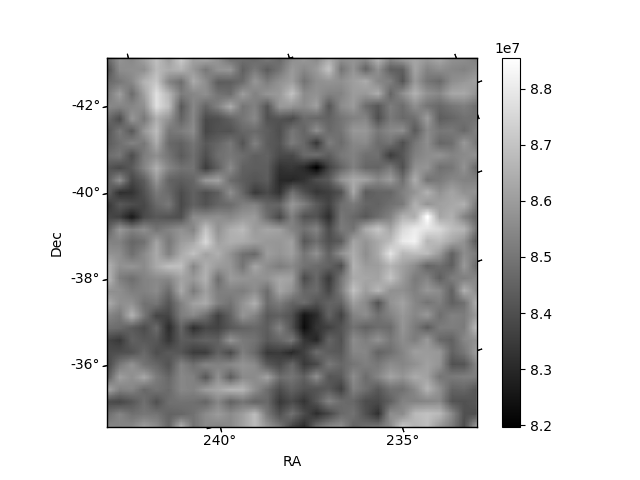
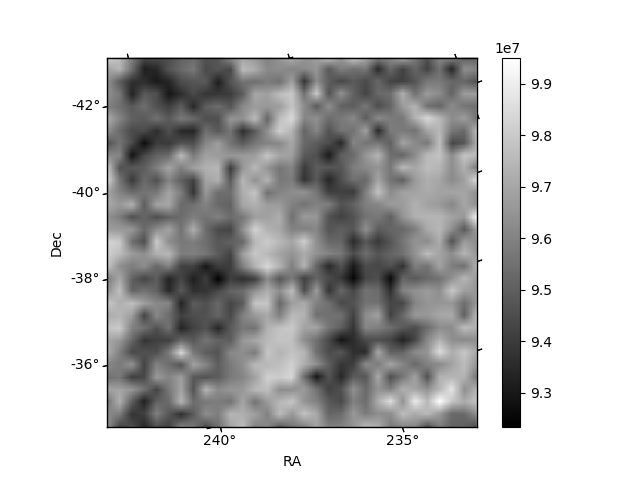
Histogram calculated using DETX and DETY for each event in the final _common_clean file
| Quadrant A | 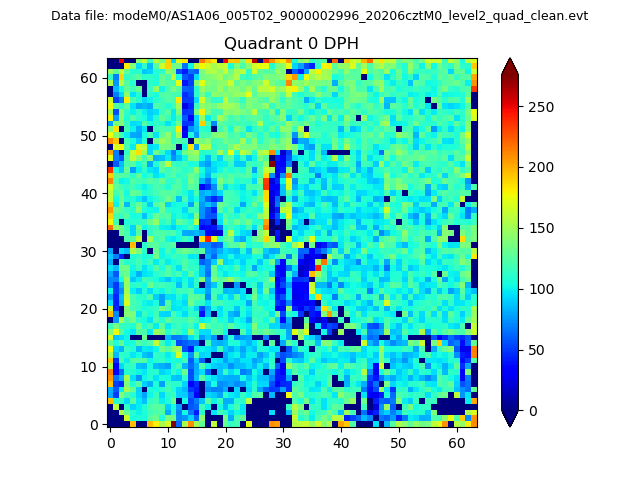 |
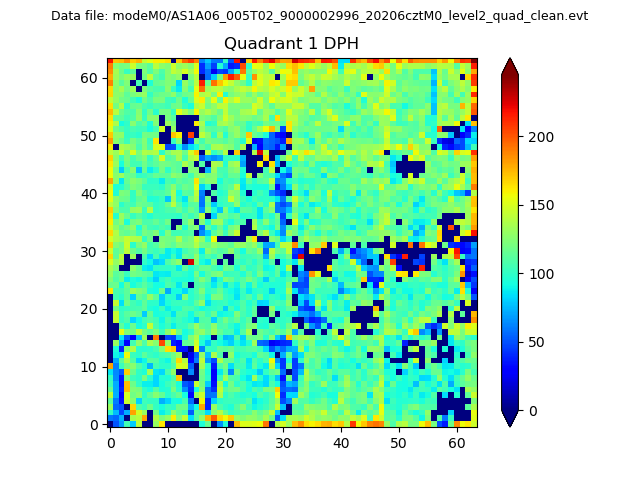 |
Quadrant B |
|---|---|---|---|
| Quadrant D | 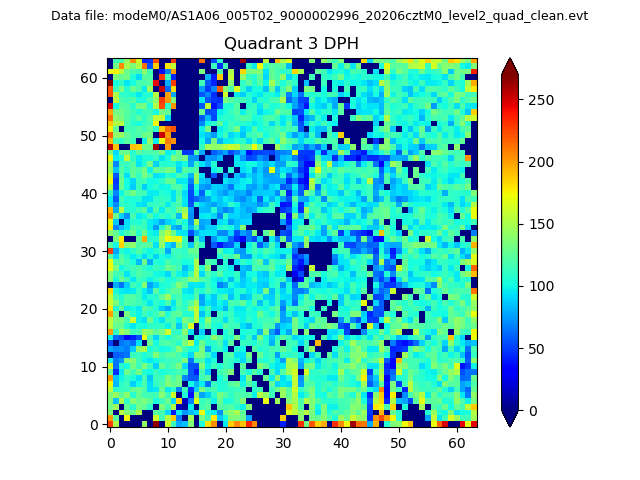 |
 |
Quadrant C |
| Plot type | Count rate plots | Images |
|---|---|---|
| Comparison with Poisson distribution Blue bars denote a histogram of data divided into 1 sec bins. Red curve is a Poisson curve with rate = median count rate of data. |
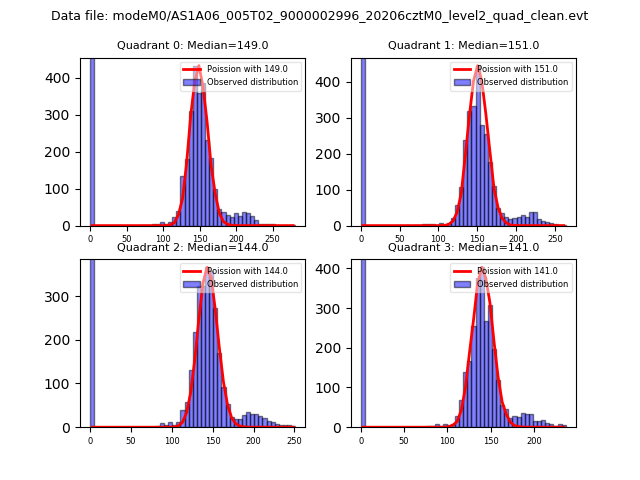 |
 |
| Quadrant-wise count rates Data is divided into 100 sec bins |
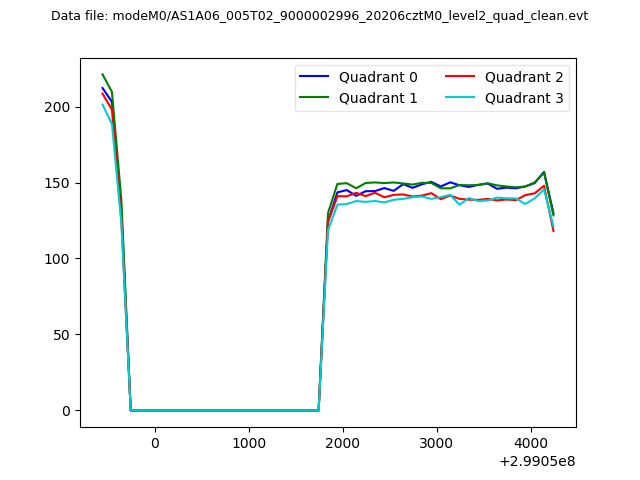 |
|
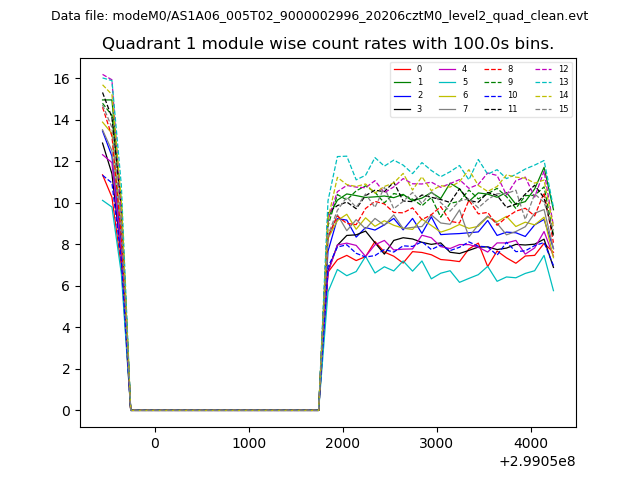
| Module-wise count rates for Quadrant A Data is divided into 100 sec bins |
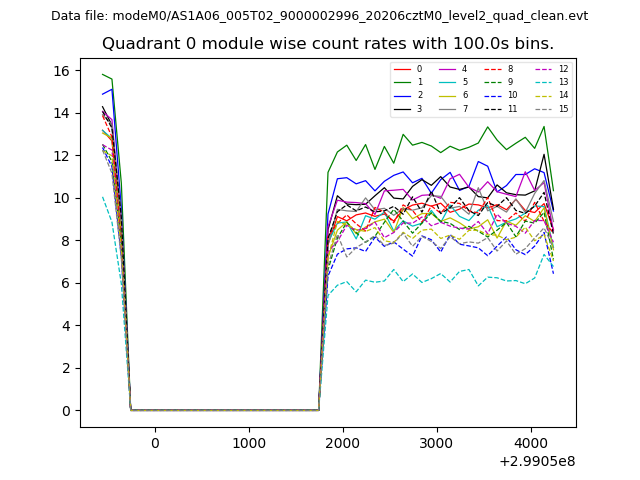 |
 |
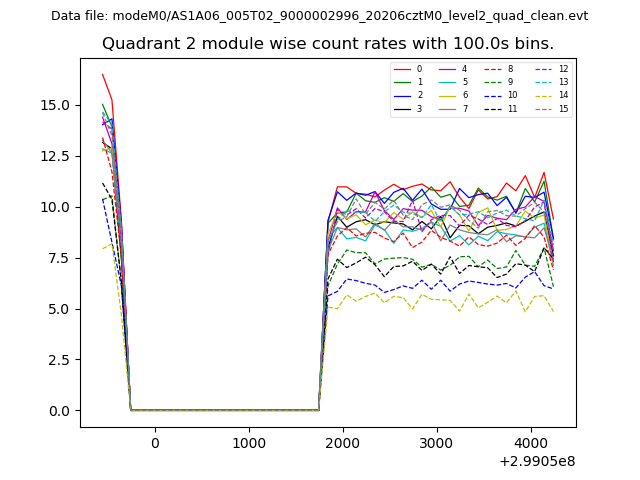
| Module-wise count rates for Quadrant B Data is divided into 100 sec bins |
 |
 |
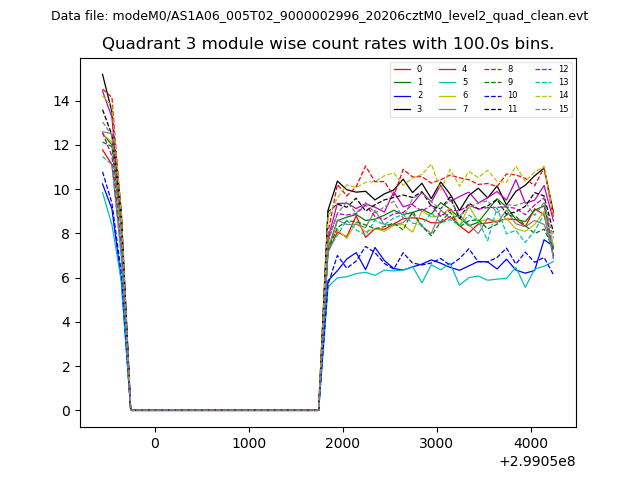
| Module-wise count rates for Quadrant C Data is divided into 100 sec bins |
 |
 |
| Module-wise count rates for Quadrant D Data is divided into 100 sec bins |
 |
 |
| Parameter | Plot |
|---|---|
| CZT HV Monitor | 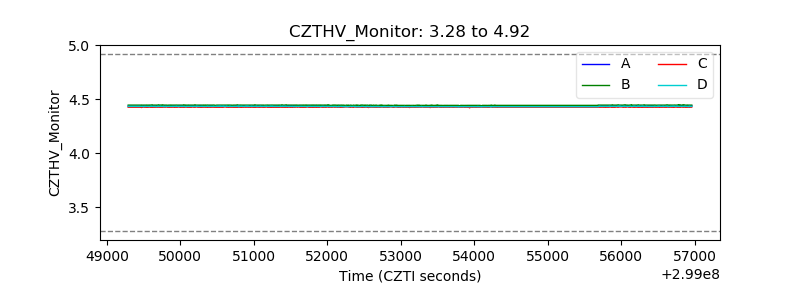 |
| D_VDD | 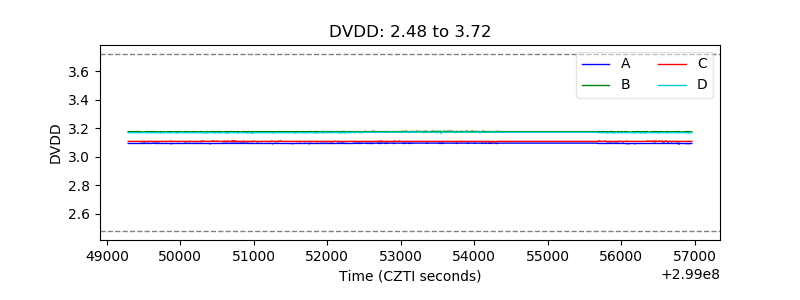 |
| Temperature 1 | 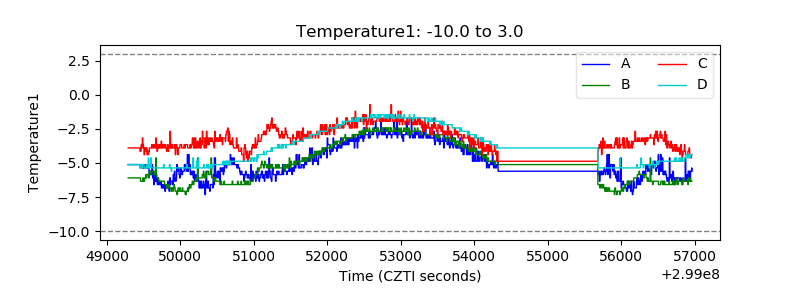 |
| Veto HV Monitor | 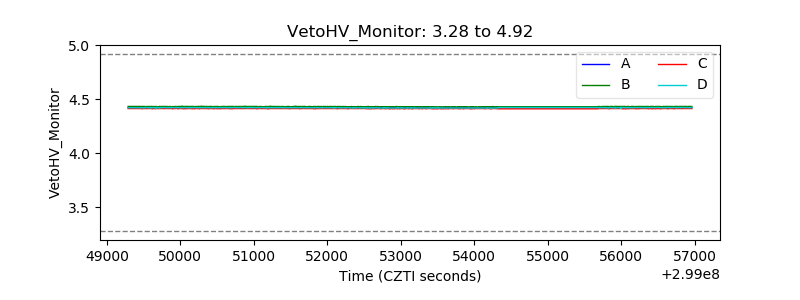 |
| Veto LLD | 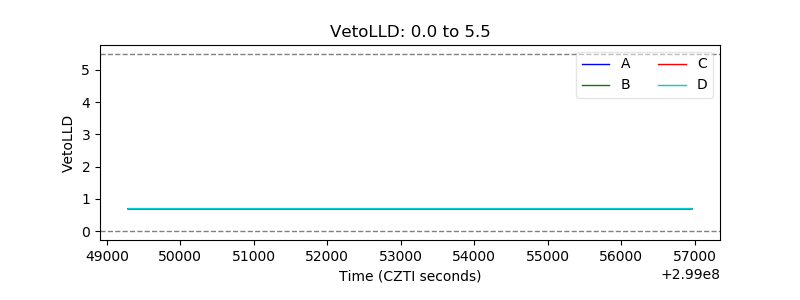 |
| Alpha Counter |  |
| _CPM_Rate | 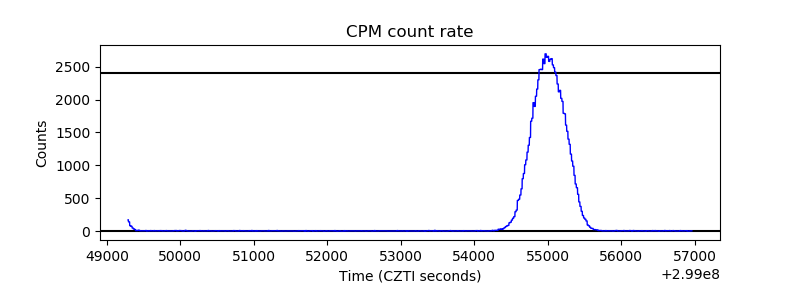 |
| CZT Counter | 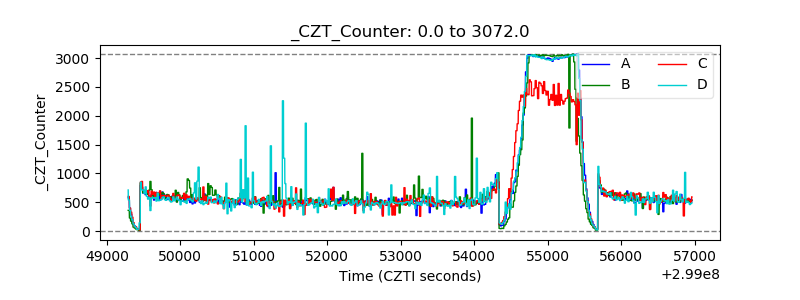 |
| +2.5 Volts monitor | 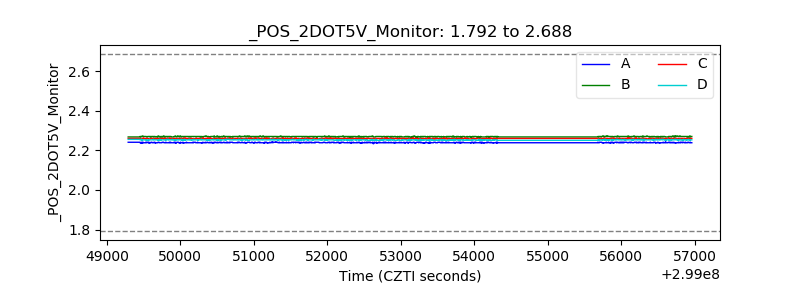 |
| +5 Volts monitor | 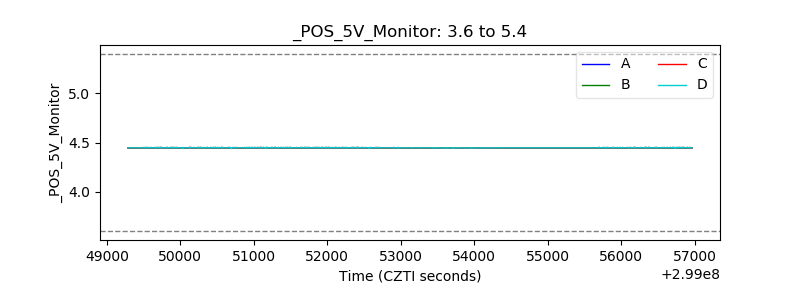 |
| _ROLL_ROT | 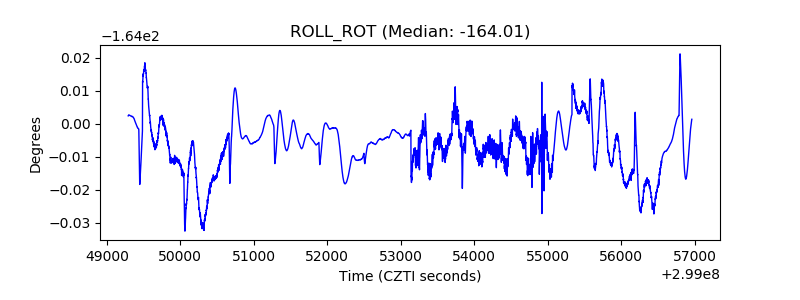 |
| _Roll_DEC | 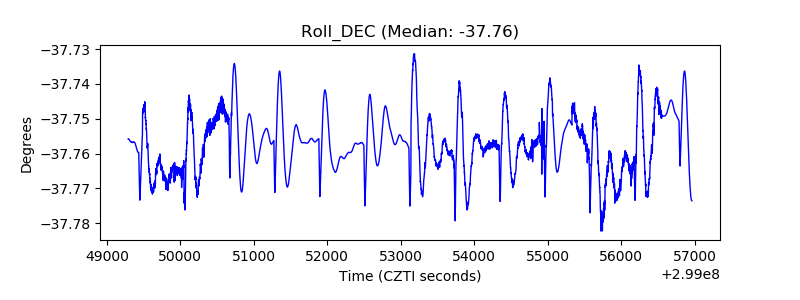 |
| _Roll_RA | 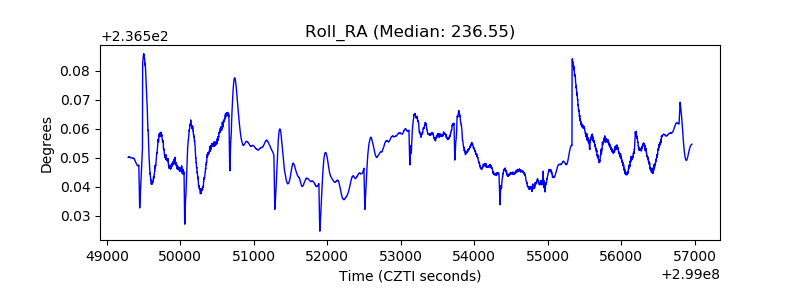 |
| Veto Counter | 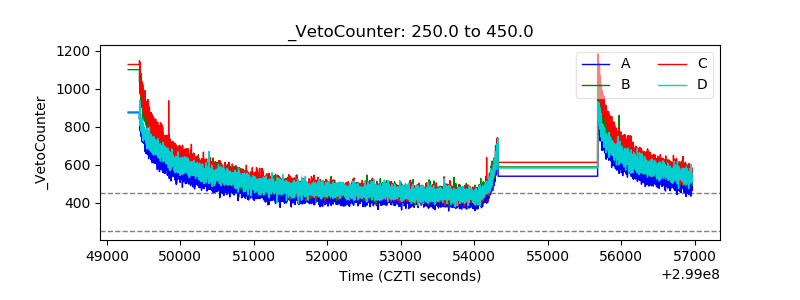 |