| Param | Original file | Final file |
|---|---|---|
| Filename | modeM0/AS1A06_005T02_9000002996_20209cztM0_level2.evt | modeM0/AS1A06_005T02_9000002996_20209cztM0_level2_quad_clean.evt |
| Size (bytes) | 1,266,583,680 | 233,352,000 |
| Size | 1.2 GB | 222.5 MB |
| Events in quadrant A | 8,739,581 | 1,524,801 |
| Events in quadrant B | 9,215,392 | 1,528,477 |
| Events in quadrant C | 8,691,855 | 1,456,277 |
| Events in quadrant D | 10,574,106 | 1,397,027 |
| Mode M0 | |||
|---|---|---|---|
| Quadrant | BADHDUFLAG | Total packets | Discarded packets |
| A | 0 | 35714 | 4 |
| B | 0 | 37094 | 4 |
| C | 0 | 35806 | 4 |
| D | 0 | 41763 | 4 |
| Mode SS | |||
|---|---|---|---|
| Quadrant | BADHDUFLAG | Total packets | Discarded packets |
| A | 0 | 342 | 0 |
| B | 0 | 342 | 0 |
| C | 0 | 342 | 0 |
| D | 0 | 342 | 0 |
| Mode M9 | |||
|---|---|---|---|
| Quadrant | BADHDUFLAG | Total packets | Discarded packets |
| A | 0 | 43 | 0 |
| B | 0 | 44 | 0 |
| C | 0 | 44 | 0 |
| D | 0 | 44 | 0 |
| Quadrant | Total seconds | Saturated seconds | Saturation percentage |
|---|---|---|---|
| A | 16843 | 285 | 1.692098% |
| B | 16842 | 357 | 2.119701% |
| C | 16842 | 408 | 2.422515% |
| D | 16842 | 637 | 3.782211% |
Noise dominated data is calculated using 1-second bins in cleaned event files. If a bin has >2000 counts, and if more than 50% of those come from <1% of pixels, then it is considered to be noise-dominated and hence unusable.
| Quadrant | # 1 sec bins | Bins with >0 counts | Bins with >2000 counts | High rate bins dominated by noise | Noise dominated (total time) | Noise dominated (detector-on time) | Marked lightcurve |
|---|---|---|---|---|---|---|---|
| A | 20193 | 16846 | 18 | 18 | 0.09% | 0.11% | 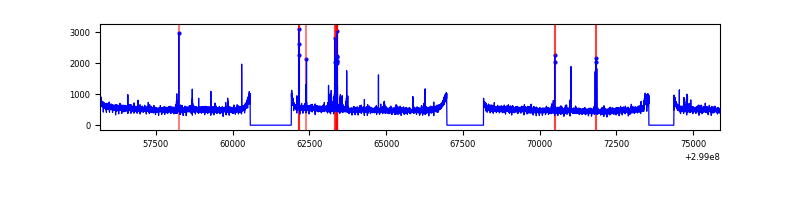 |
| B | 20192 | 16845 | 36 | 36 | 0.18% | 0.21% | 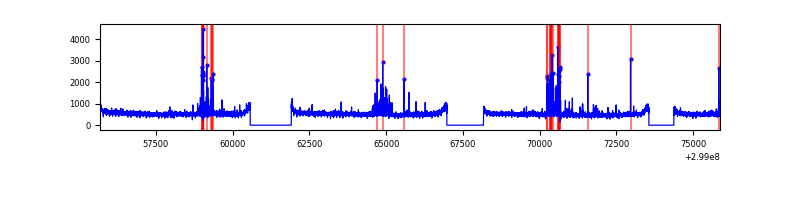 |
| C | 20192 | 16845 | 0 | 0 | 0.00% | 0.00% | 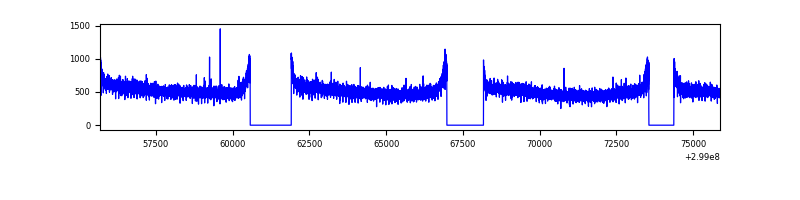 |
| D | 20192 | 16845 | 398 | 398 | 1.97% | 2.36% | 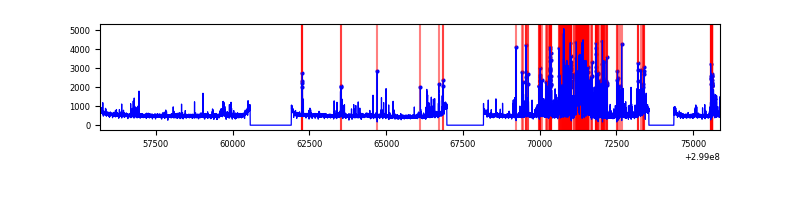 |
Top three noisy pixels from each quadrant. If the there are fewer than three noisy pixels in the level2.evt file, extra rows are filled as -1
| Pixel properties | Quadrant properties | ||||||
|---|---|---|---|---|---|---|---|
| Quadrant | DetID | PixID | Counts | Sigma | Mean | Median | Sigma |
| A | 4 | 2 | 117314 | 259.41 | 2230 | 2191 | 443.8 |
| A | 14 | 238 | 47184 | 101.38 | 2230 | 2191 | 443.8 |
| A | 0 | 226 | 19254 | 38.45 | 2230 | 2191 | 443.8 |
| B | 7 | 220 | 335524 | 807.08 | 2212 | 2161 | 413.0 |
| B | 12 | 111 | 48669 | 112.6 | 2212 | 2161 | 413.0 |
| B | 0 | 198 | 45099 | 103.95 | 2212 | 2161 | 413.0 |
| C | 14 | 238 | 334930 | 683.61 | 2125 | 2140 | 486.8 |
| C | 1 | 16 | 26865 | 50.79 | 2125 | 2140 | 486.8 |
| C | 3 | 233 | 24847 | 46.64 | 2125 | 2140 | 486.8 |
| D | 1 | 52 | 1993312 | 3850.28 | 2151 | 2093 | 517.2 |
| D | 7 | 38 | 141993 | 270.51 | 2151 | 2093 | 517.2 |
| D | 5 | 222 | 103648 | 196.37 | 2151 | 2093 | 517.2 |
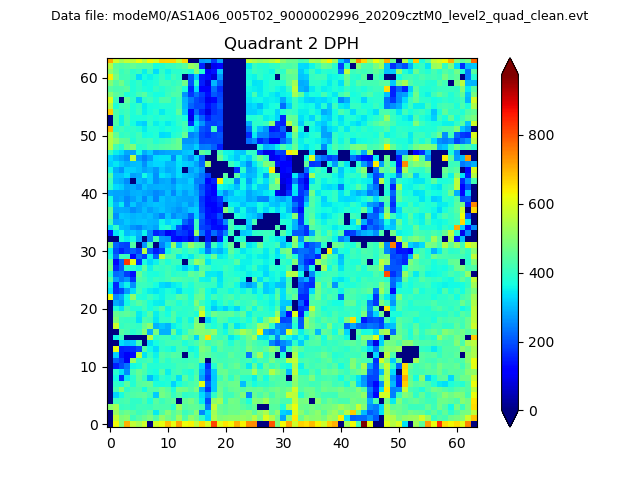
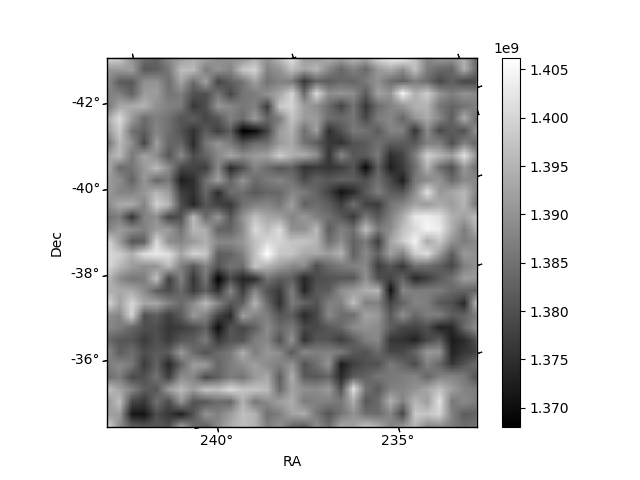
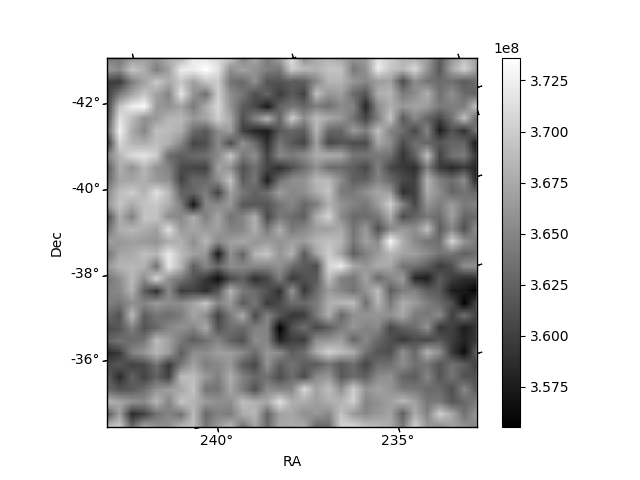
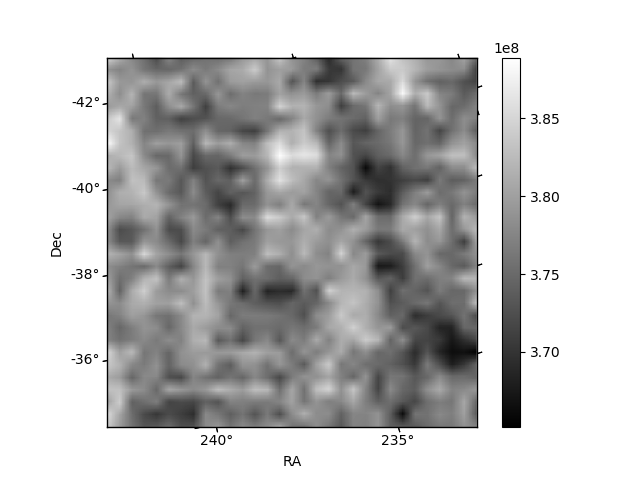
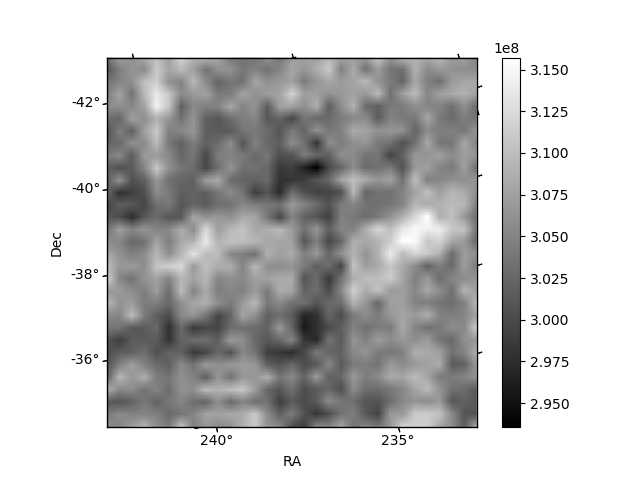
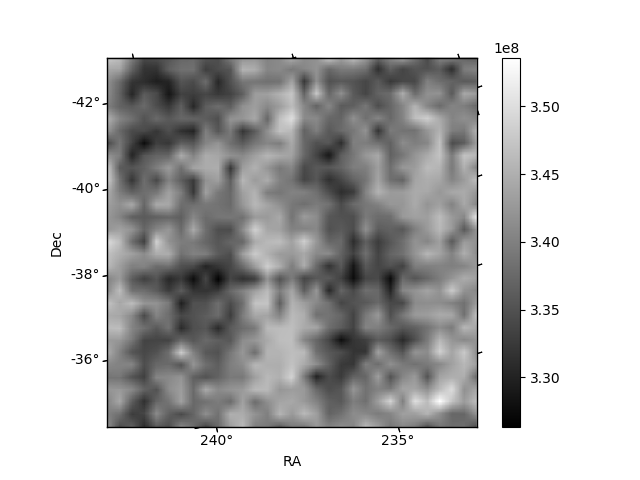
Histogram calculated using DETX and DETY for each event in the final _common_clean file
| Quadrant A | 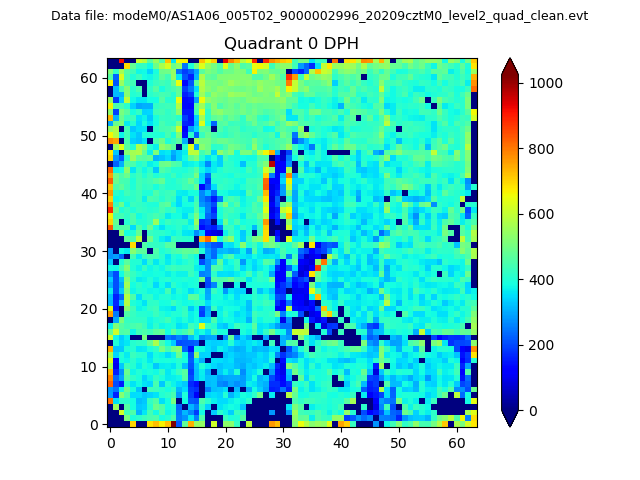 |
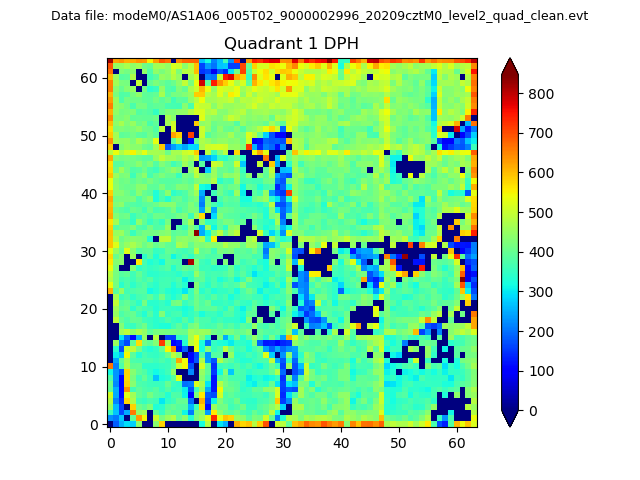 |
Quadrant B |
|---|---|---|---|
| Quadrant D | 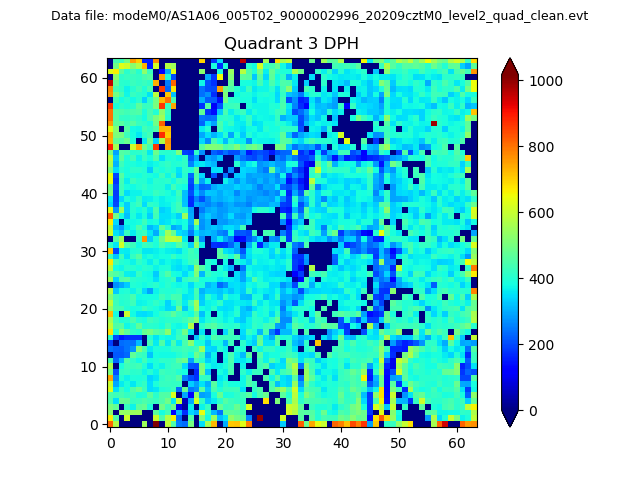 |
 |
Quadrant C |
| Plot type | Count rate plots | Images |
|---|---|---|
| Comparison with Poisson distribution Blue bars denote a histogram of data divided into 1 sec bins. Red curve is a Poisson curve with rate = median count rate of data. |
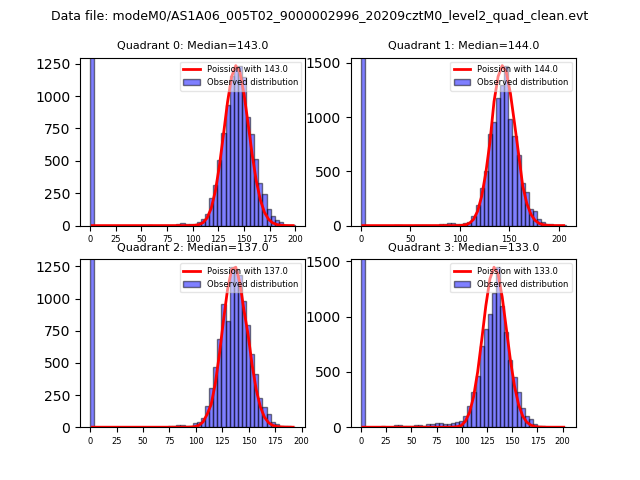 |
 |
| Quadrant-wise count rates Data is divided into 100 sec bins |
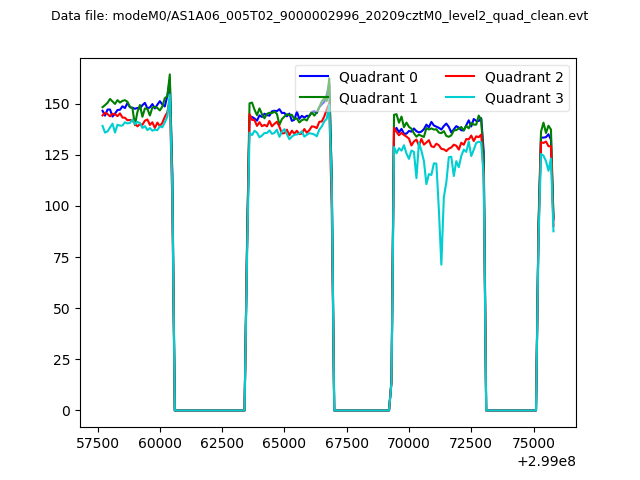 |
|
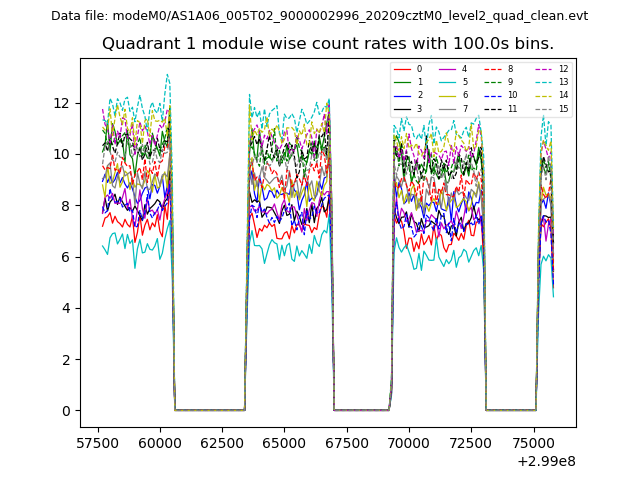
| Module-wise count rates for Quadrant A Data is divided into 100 sec bins |
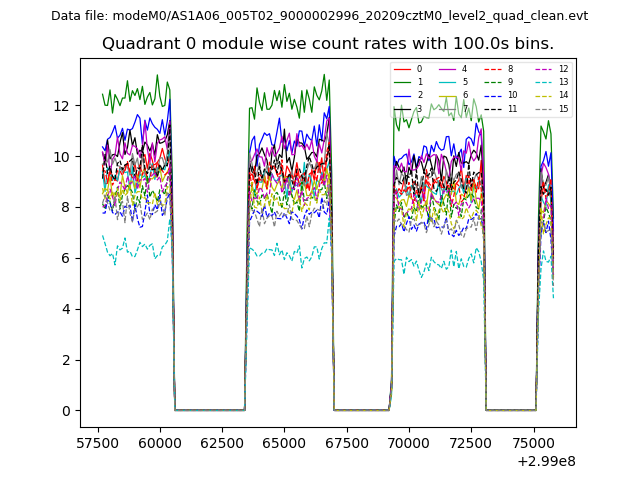 |
 |
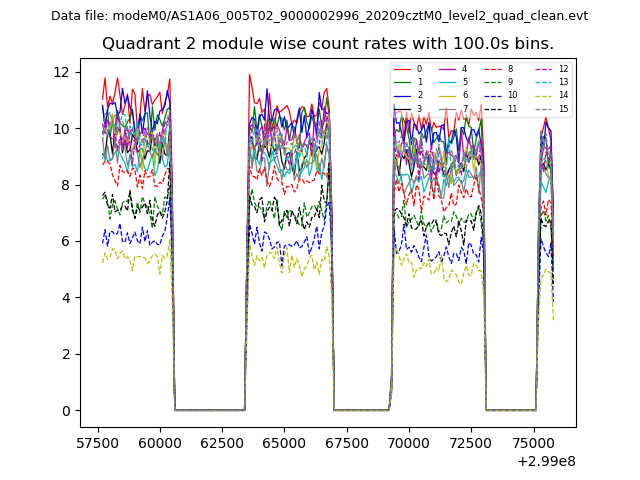
| Module-wise count rates for Quadrant B Data is divided into 100 sec bins |
 |
 |
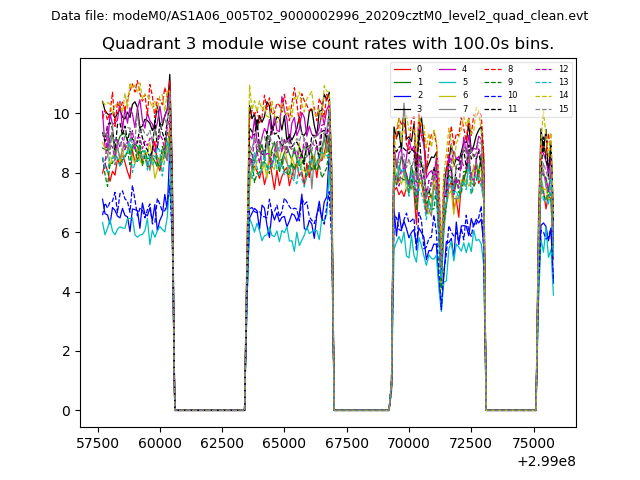
| Module-wise count rates for Quadrant C Data is divided into 100 sec bins |
 |
 |
| Module-wise count rates for Quadrant D Data is divided into 100 sec bins |
 |
 |
| Parameter | Plot |
|---|---|
| CZT HV Monitor | 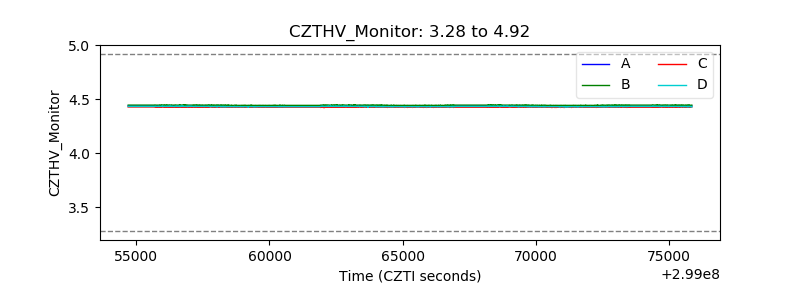 |
| D_VDD | 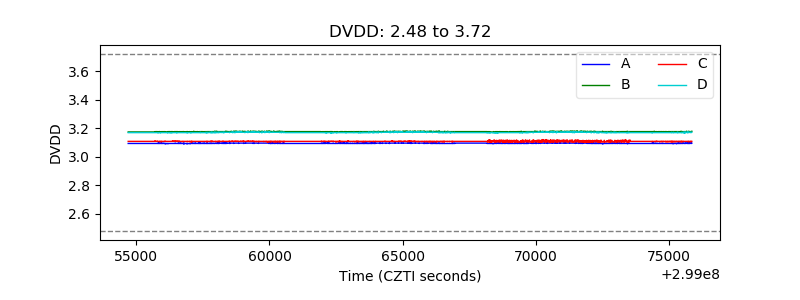 |
| Temperature 1 | 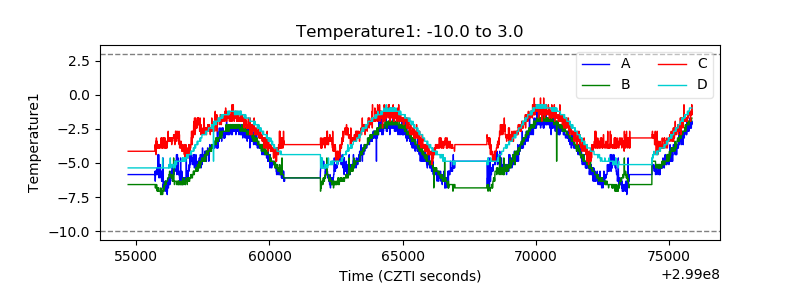 |
| Veto HV Monitor | 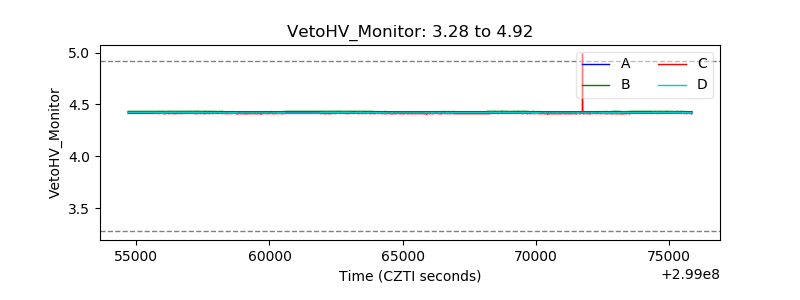 |
| Veto LLD | 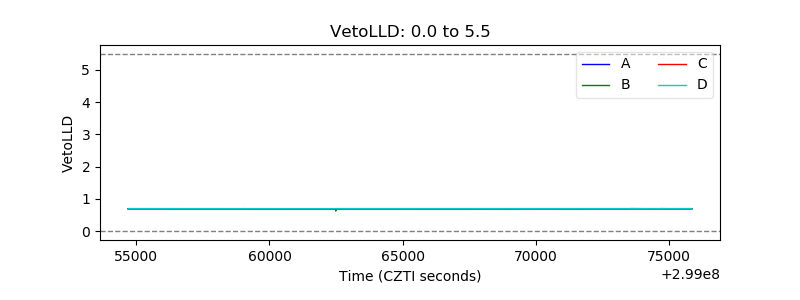 |
| Alpha Counter | 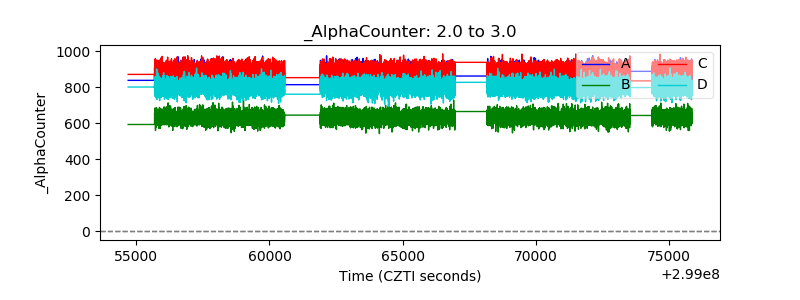 |
| _CPM_Rate | 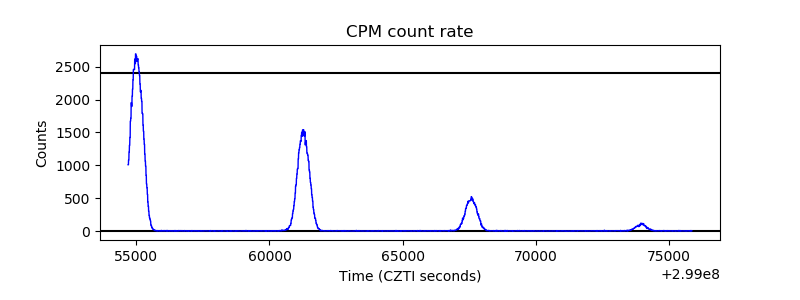 |
| CZT Counter | 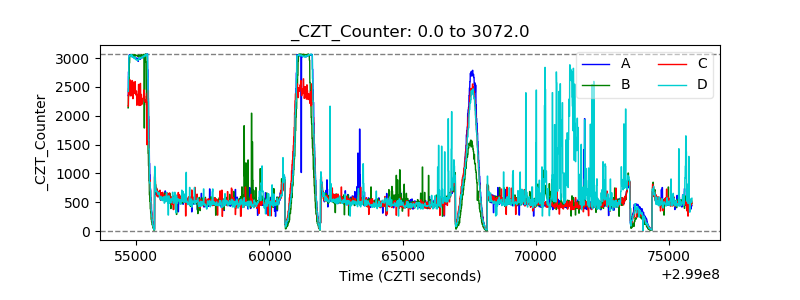 |
| +2.5 Volts monitor | 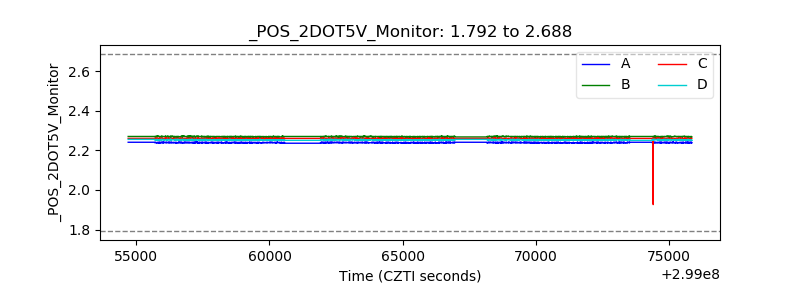 |
| +5 Volts monitor |  |
| _ROLL_ROT | 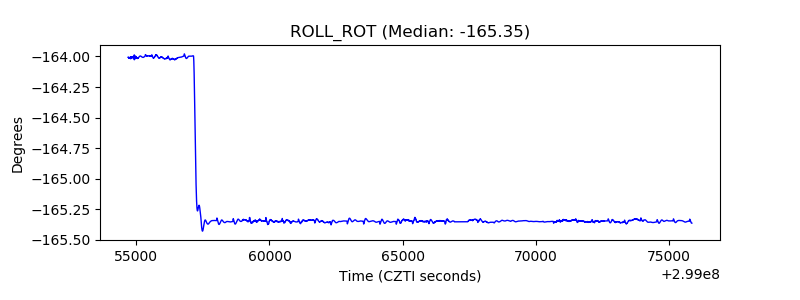 |
| _Roll_DEC | 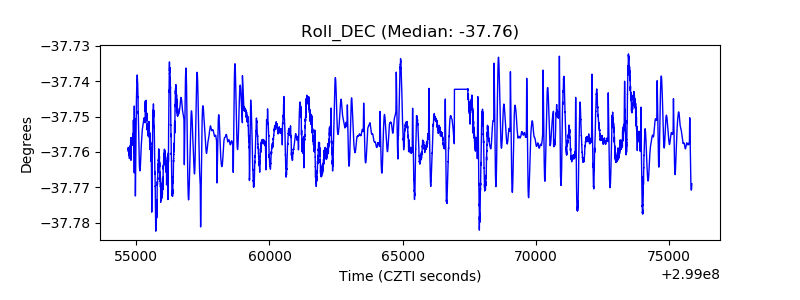 |
| _Roll_RA | 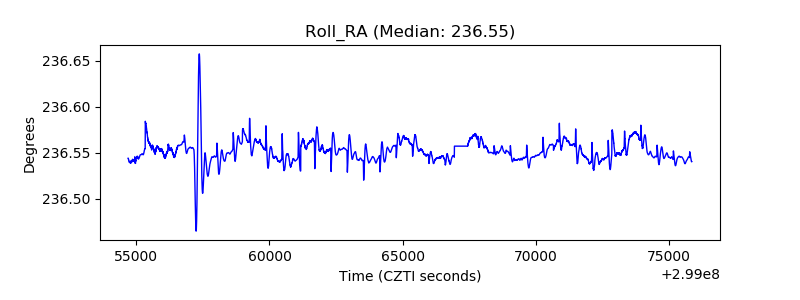 |
| Veto Counter | 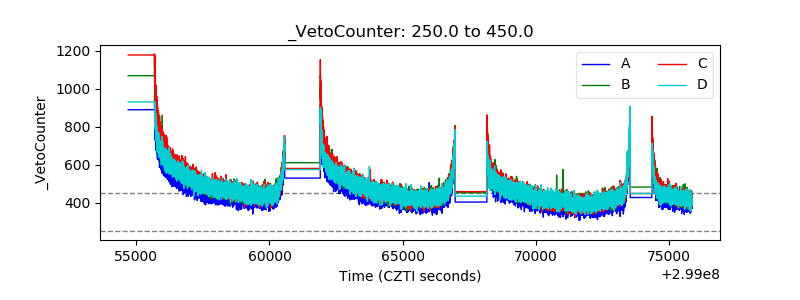 |