| Param | Original file | Final file |
|---|---|---|
| Filename | modeM0/AS1A06_005T02_9000002996_20210cztM0_level2.evt | modeM0/AS1A06_005T02_9000002996_20210cztM0_level2_quad_clean.evt |
| Size (bytes) | 557,720,640 | 96,759,360 |
| Size | 531.9 MB | 92.3 MB |
| Events in quadrant A | 3,699,746 | 624,710 |
| Events in quadrant B | 4,429,131 | 619,123 |
| Events in quadrant C | 3,737,011 | 594,510 |
| Events in quadrant D | 4,519,950 | 574,262 |
| Mode M0 | |||
|---|---|---|---|
| Quadrant | BADHDUFLAG | Total packets | Discarded packets |
| A | 0 | 15639 | 2 |
| B | 0 | 17680 | 2 |
| C | 0 | 15801 | 2 |
| D | 0 | 18233 | 2 |
| Mode SS | |||
|---|---|---|---|
| Quadrant | BADHDUFLAG | Total packets | Discarded packets |
| A | 0 | 152 | 0 |
| B | 0 | 152 | 0 |
| C | 0 | 152 | 0 |
| D | 0 | 152 | 0 |
| Mode M9 | |||
|---|---|---|---|
| Quadrant | BADHDUFLAG | Total packets | Discarded packets |
| A | 0 | 13 | 0 |
| B | 0 | 13 | 0 |
| C | 0 | 13 | 0 |
| D | 0 | 13 | 0 |
| Quadrant | Total seconds | Saturated seconds | Saturation percentage |
|---|---|---|---|
| A | 7437 | 270 | 3.630496% |
| B | 7438 | 406 | 5.458457% |
| C | 7438 | 329 | 4.423232% |
| D | 7437 | 382 | 5.136480% |
Noise dominated data is calculated using 1-second bins in cleaned event files. If a bin has >2000 counts, and if more than 50% of those come from <1% of pixels, then it is considered to be noise-dominated and hence unusable.
| Quadrant | # 1 sec bins | Bins with >0 counts | Bins with >2000 counts | High rate bins dominated by noise | Noise dominated (total time) | Noise dominated (detector-on time) | Marked lightcurve |
|---|---|---|---|---|---|---|---|
| A | 8682 | 7439 | 1 | 1 | 0.01% | 0.01% | 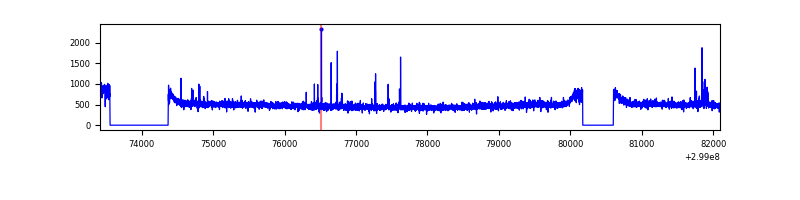 |
| B | 8683 | 7440 | 92 | 92 | 1.06% | 1.24% | 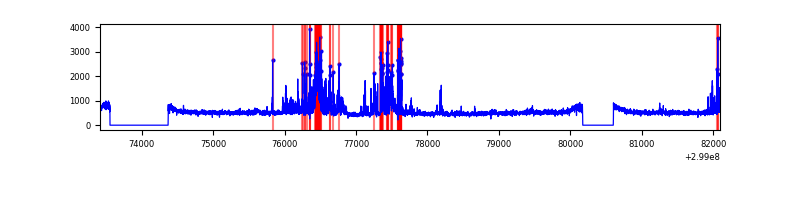 |
| C | 8683 | 7440 | 3 | 3 | 0.03% | 0.04% | 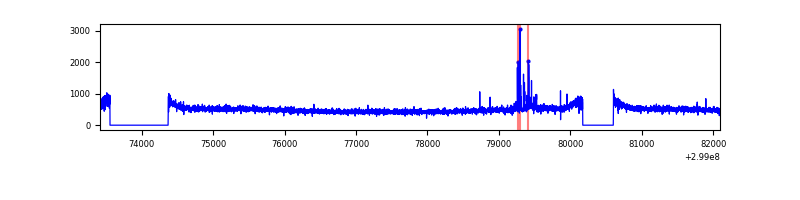 |
| D | 8682 | 7439 | 122 | 122 | 1.41% | 1.64% | 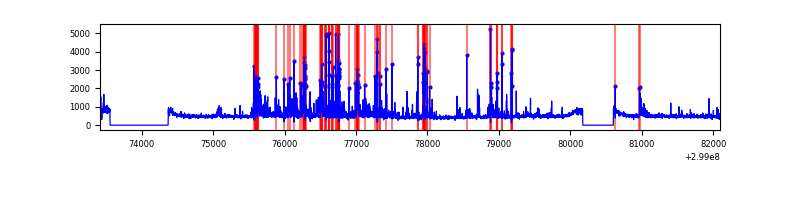 |
Top three noisy pixels from each quadrant. If the there are fewer than three noisy pixels in the level2.evt file, extra rows are filled as -1
| Pixel properties | Quadrant properties | ||||||
|---|---|---|---|---|---|---|---|
| Quadrant | DetID | PixID | Counts | Sigma | Mean | Median | Sigma |
| A | 14 | 238 | 29395 | 147.64 | 948 | 928 | 192.8 |
| A | 4 | 2 | 23937 | 119.33 | 948 | 928 | 192.8 |
| A | 0 | 226 | 8121 | 37.3 | 948 | 928 | 192.8 |
| B | 7 | 220 | 486426 | 2704.99 | 934 | 910 | 179.5 |
| B | 6 | 36 | 126454 | 699.45 | 934 | 910 | 179.5 |
| B | 0 | 197 | 57328 | 314.33 | 934 | 910 | 179.5 |
| C | 14 | 238 | 141120 | 663.38 | 900 | 907 | 211.4 |
| C | 9 | 54 | 51805 | 240.81 | 900 | 907 | 211.4 |
| C | 3 | 233 | 20473 | 92.57 | 900 | 907 | 211.4 |
| D | 1 | 52 | 677927 | 3058.56 | 914 | 885 | 221.4 |
| D | 12 | 17 | 146039 | 655.74 | 914 | 885 | 221.4 |
| D | 7 | 38 | 66804 | 297.79 | 914 | 885 | 221.4 |
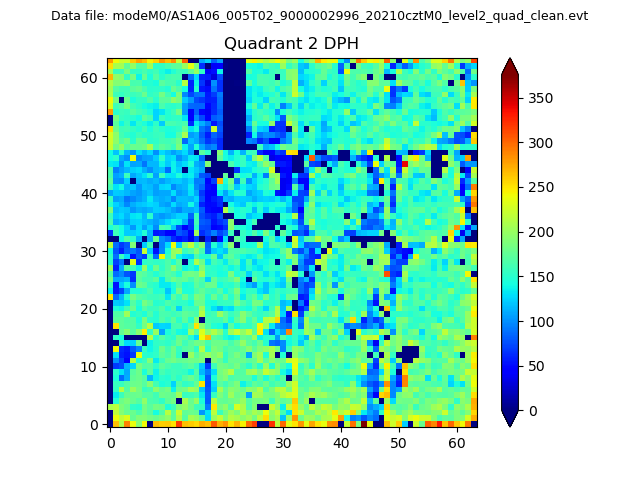
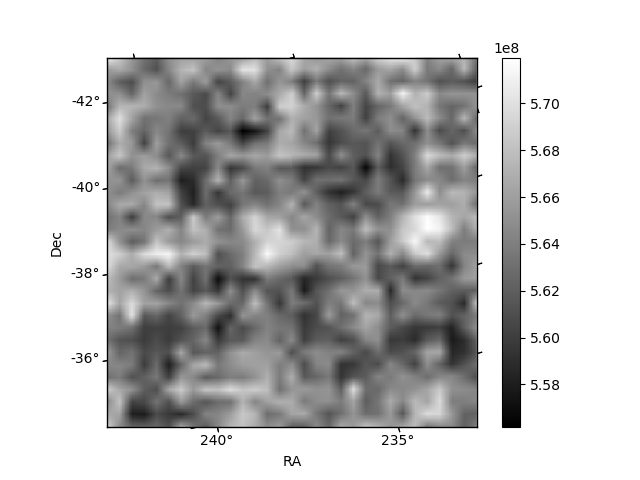
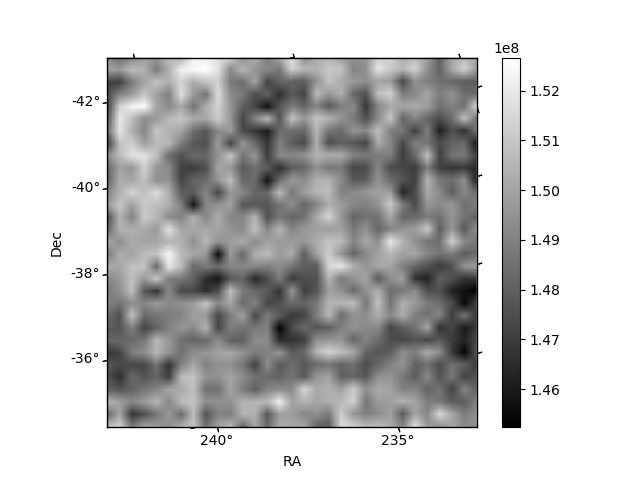
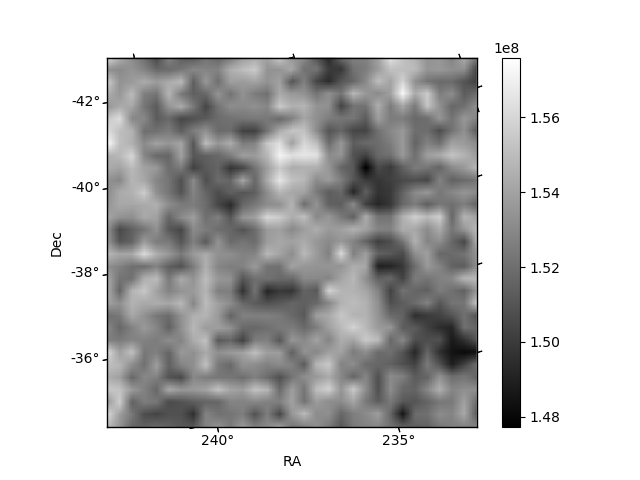
Histogram calculated using DETX and DETY for each event in the final _common_clean file
| Quadrant A | 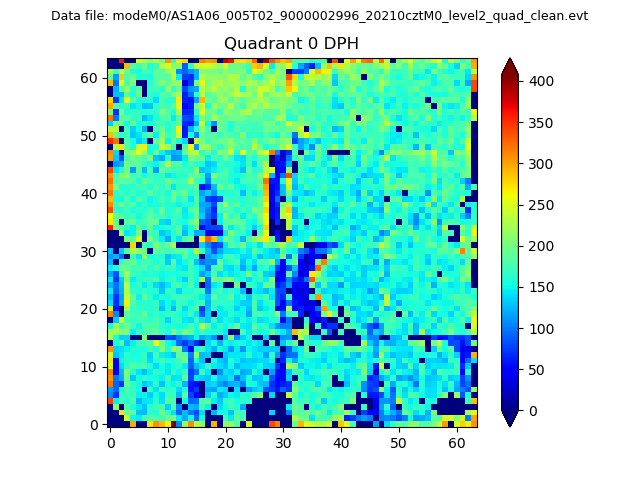 |
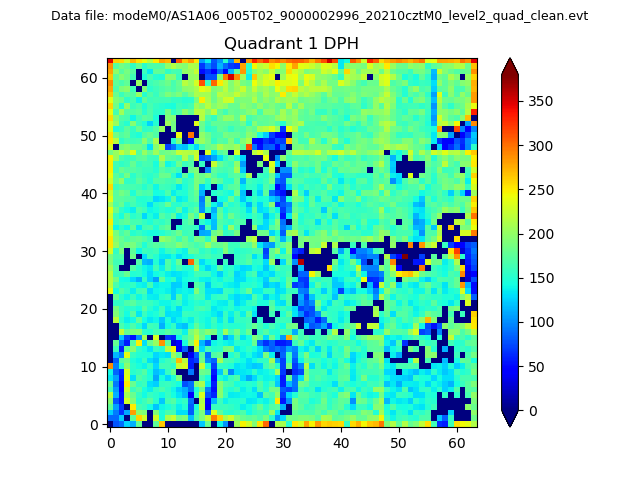 |
Quadrant B |
|---|---|---|---|
| Quadrant D | 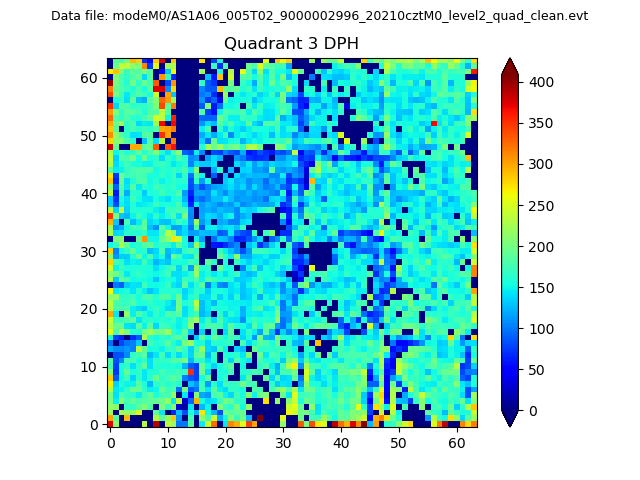 |
 |
Quadrant C |
| Plot type | Count rate plots | Images |
|---|---|---|
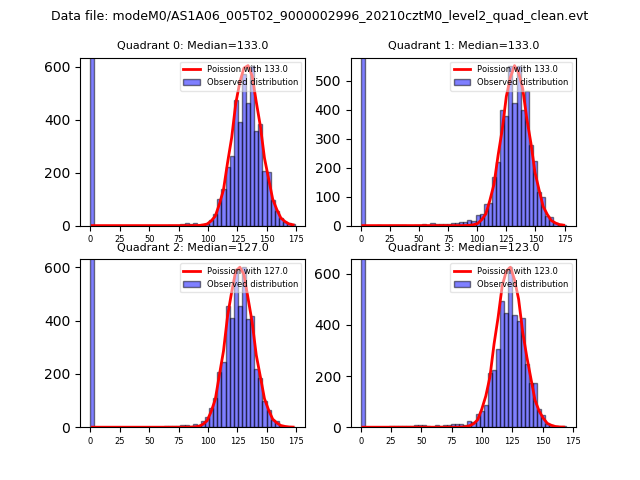
| Comparison with Poisson distribution Blue bars denote a histogram of data divided into 1 sec bins. Red curve is a Poisson curve with rate = median count rate of data. |
 |
 |
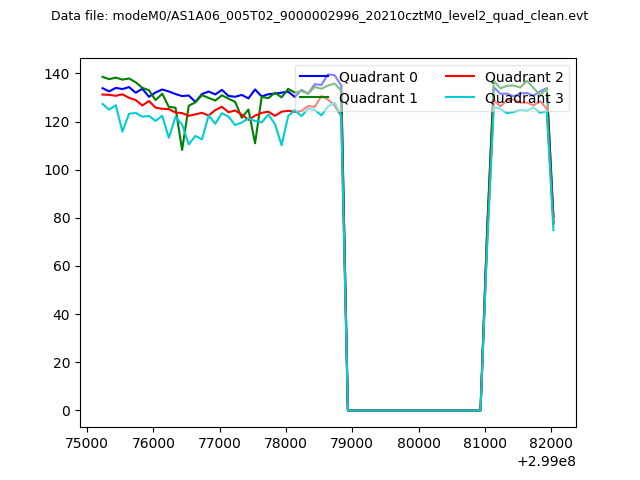
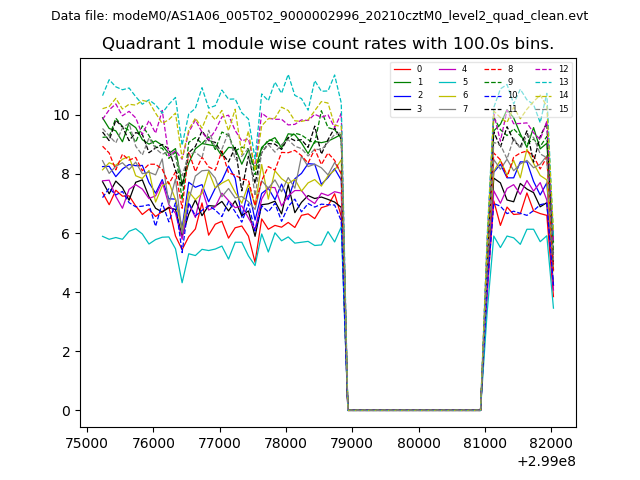
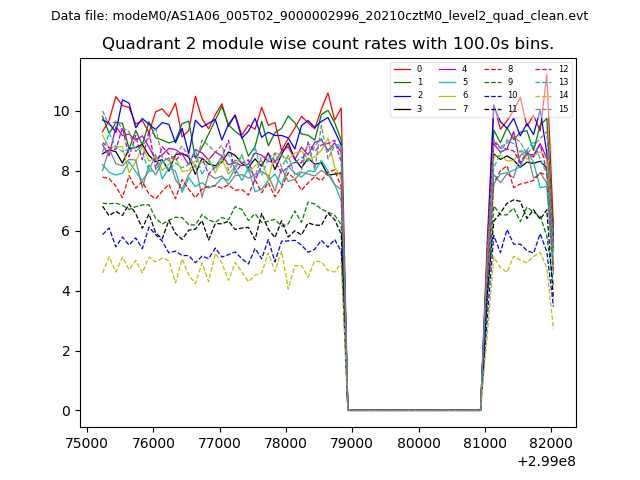
| Quadrant-wise count rates Data is divided into 100 sec bins |
 |
|
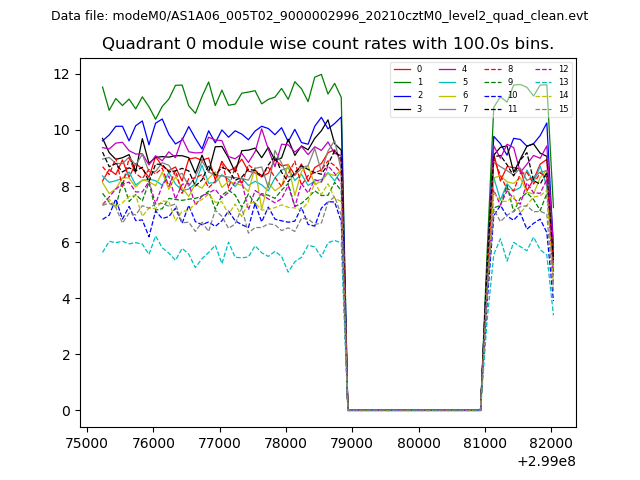
| Module-wise count rates for Quadrant A Data is divided into 100 sec bins |
 |
 |
| Module-wise count rates for Quadrant B Data is divided into 100 sec bins |
 |
 |
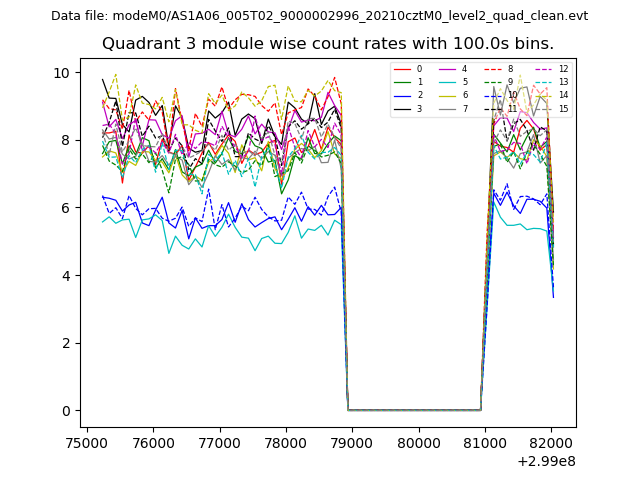
| Module-wise count rates for Quadrant C Data is divided into 100 sec bins |
 |
 |
| Module-wise count rates for Quadrant D Data is divided into 100 sec bins |
 |
 |
| Parameter | Plot |
|---|---|
| CZT HV Monitor | 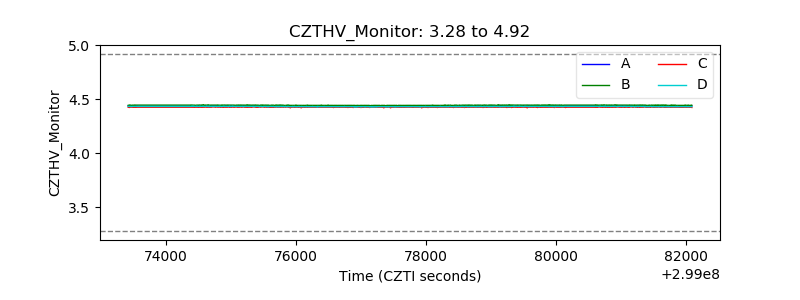 |
| D_VDD | 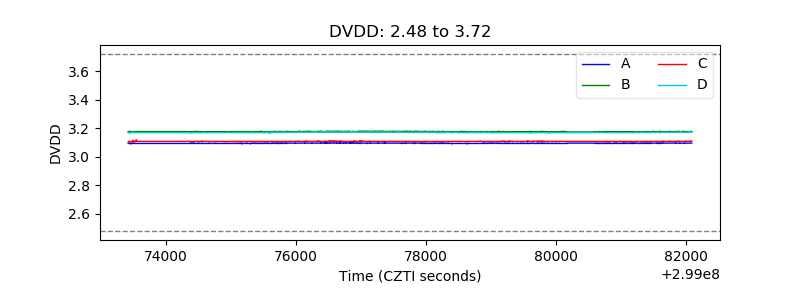 |
| Temperature 1 | 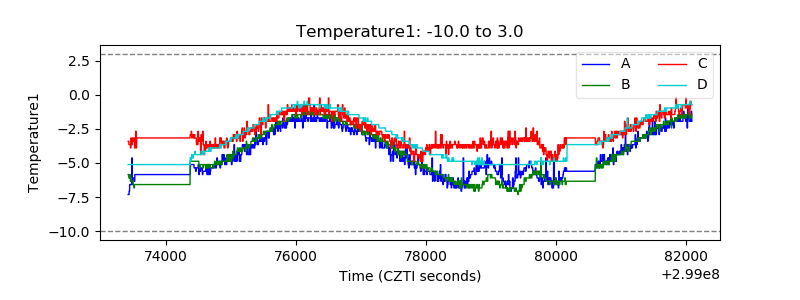 |
| Veto HV Monitor | 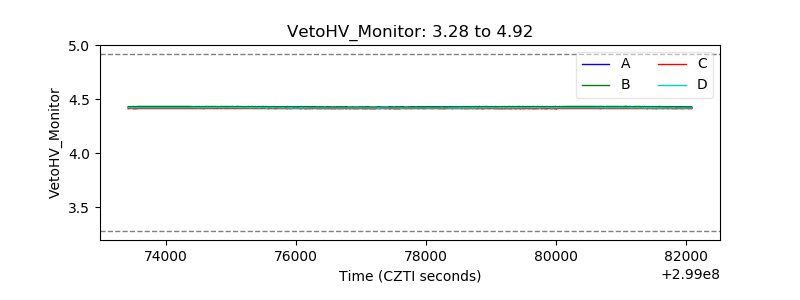 |
| Veto LLD | 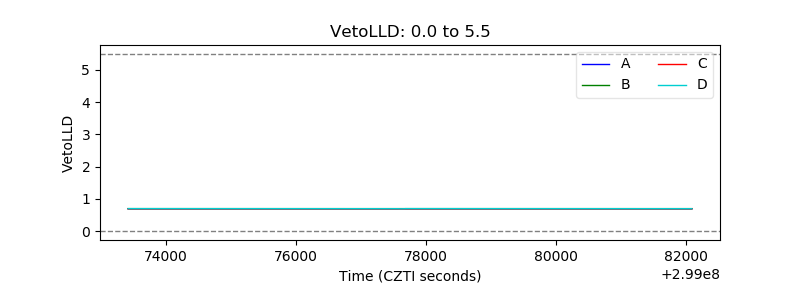 |
| Alpha Counter | 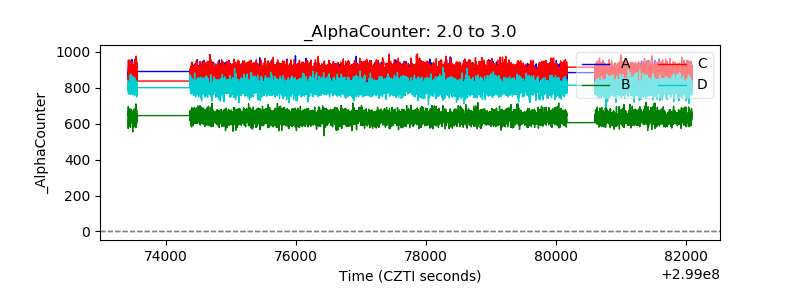 |
| _CPM_Rate | 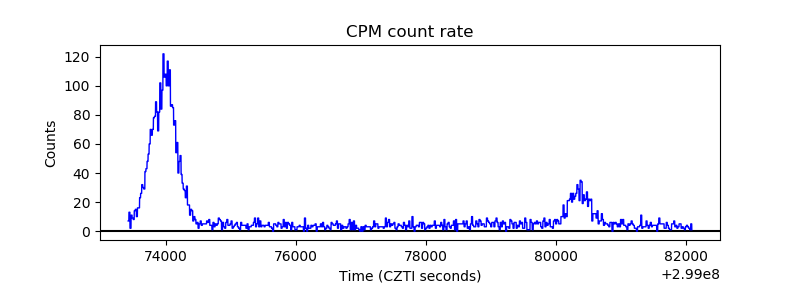 |
| CZT Counter | 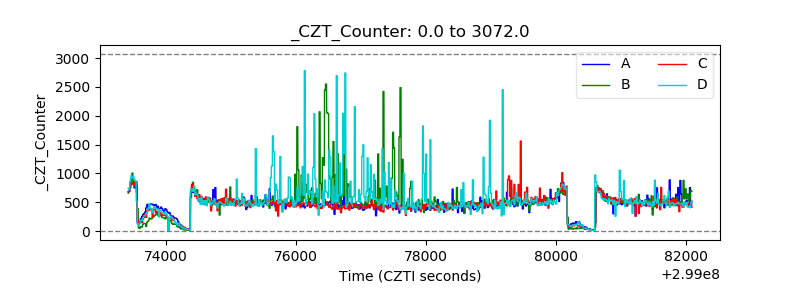 |
| +2.5 Volts monitor | 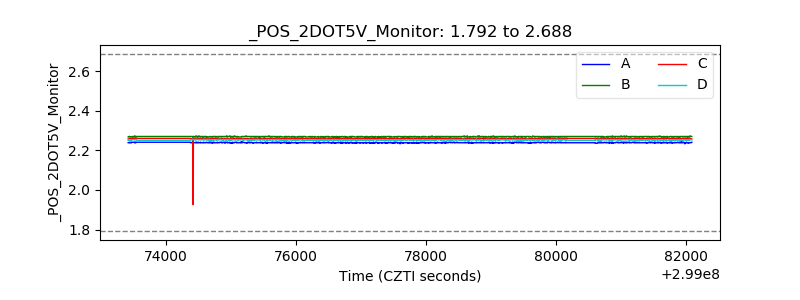 |
| +5 Volts monitor |  |
| _ROLL_ROT | 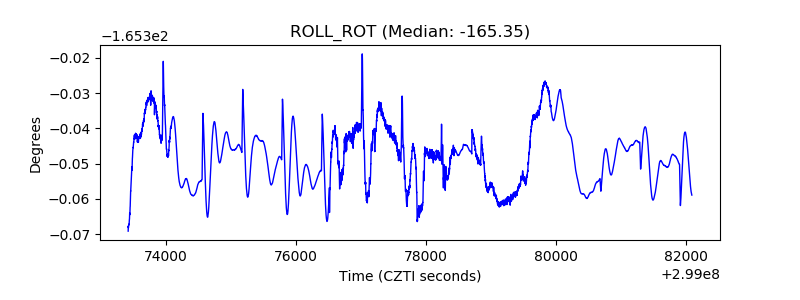 |
| _Roll_DEC | 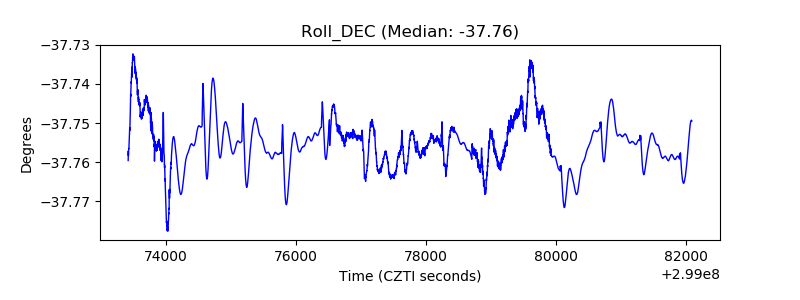 |
| _Roll_RA | 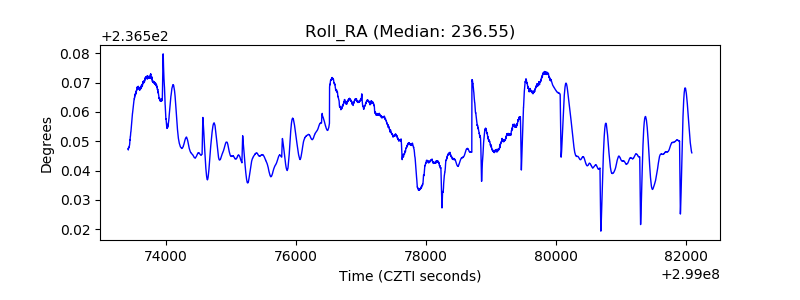 |
| Veto Counter | 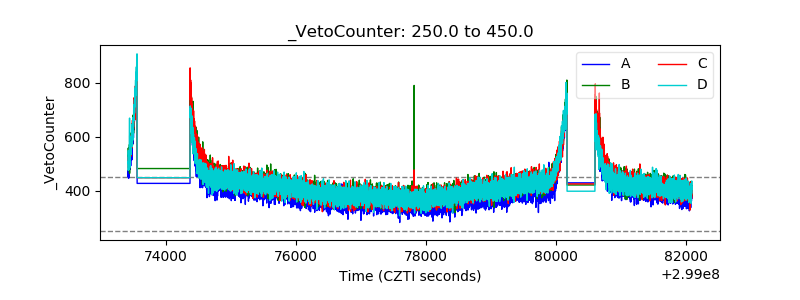 |