| Param | Original file | Final file |
|---|---|---|
| Filename | modeM0/AS1A06_005T02_9000002996_20211cztM0_level2.evt | modeM0/AS1A06_005T02_9000002996_20211cztM0_level2_quad_clean.evt |
| Size (bytes) | 146,260,800 | 36,959,040 |
| Size | 139.5 MB | 35.2 MB |
| Events in quadrant A | 1,023,060 | 249,198 |
| Events in quadrant B | 1,137,700 | 249,723 |
| Events in quadrant C | 971,139 | 238,208 |
| Events in quadrant D | 1,154,610 | 231,712 |
| Mode M0 | |||
|---|---|---|---|
| Quadrant | BADHDUFLAG | Total packets | Discarded packets |
| A | 0 | 4290 | 0 |
| B | 0 | 4620 | 0 |
| C | 0 | 4173 | 0 |
| D | 0 | 4763 | 0 |
| Mode SS | |||
|---|---|---|---|
| Quadrant | BADHDUFLAG | Total packets | Discarded packets |
| A | 0 | 40 | 0 |
| B | 0 | 40 | 0 |
| C | 0 | 40 | 0 |
| D | 0 | 40 | 0 |
| Quadrant | Total seconds | Saturated seconds | Saturation percentage |
|---|---|---|---|
| A | 2070 | 2 | 0.096618% |
| B | 2071 | 22 | 1.062289% |
| C | 2071 | 8 | 0.386287% |
| D | 2071 | 40 | 1.931434% |
Noise dominated data is calculated using 1-second bins in cleaned event files. If a bin has >2000 counts, and if more than 50% of those come from <1% of pixels, then it is considered to be noise-dominated and hence unusable.
| Quadrant | # 1 sec bins | Bins with >0 counts | Bins with >2000 counts | High rate bins dominated by noise | Noise dominated (total time) | Noise dominated (detector-on time) | Marked lightcurve |
|---|---|---|---|---|---|---|---|
| A | 2070 | 2070 | 1 | 1 | 0.05% | 0.05% | 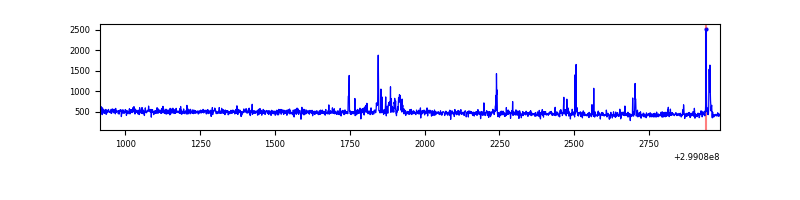 |
| B | 2071 | 2071 | 10 | 10 | 0.48% | 0.48% | 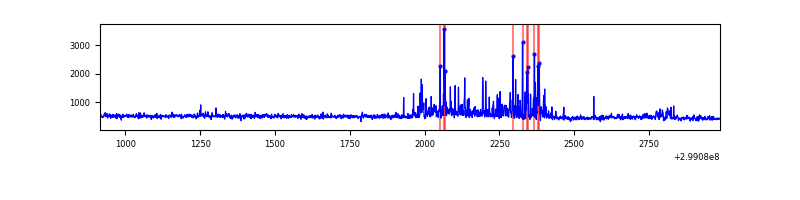 |
| C | 2071 | 2071 | 0 | 0 | 0.00% | 0.00% | 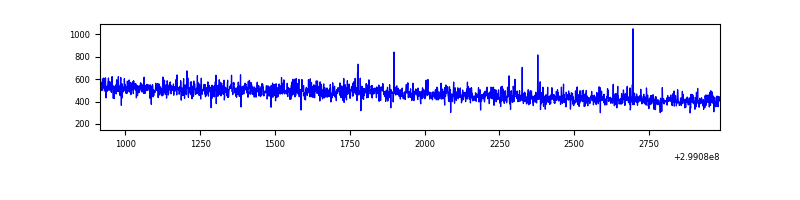 |
| D | 2071 | 2071 | 31 | 31 | 1.50% | 1.50% | 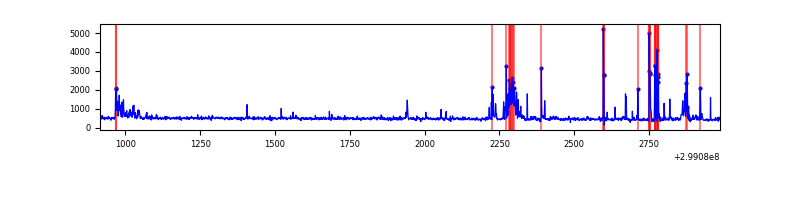 |
Top three noisy pixels from each quadrant. If the there are fewer than three noisy pixels in the level2.evt file, extra rows are filled as -1
| Pixel properties | Quadrant properties | ||||||
|---|---|---|---|---|---|---|---|
| Quadrant | DetID | PixID | Counts | Sigma | Mean | Median | Sigma |
| A | 14 | 238 | 24126 | 448.68 | 254 | 248 | 53.2 |
| A | 4 | 2 | 20598 | 382.38 | 254 | 248 | 53.2 |
| A | 0 | 226 | 2244 | 37.51 | 254 | 248 | 53.2 |
| B | 7 | 220 | 123681 | 2472.8 | 248 | 242 | 49.9 |
| B | 0 | 197 | 13352 | 262.63 | 248 | 242 | 49.9 |
| B | 0 | 190 | 8976 | 174.96 | 248 | 242 | 49.9 |
| C | 14 | 238 | 37473 | 657.28 | 237 | 238 | 56.7 |
| C | 3 | 233 | 6755 | 115.04 | 237 | 238 | 56.7 |
| C | 1 | 16 | 3754 | 62.07 | 237 | 238 | 56.7 |
| D | 12 | 17 | 101143 | 1672.84 | 242 | 235 | 60.3 |
| D | 9 | 1 | 47602 | 785.24 | 242 | 235 | 60.3 |
| D | 7 | 38 | 32797 | 539.81 | 242 | 235 | 60.3 |
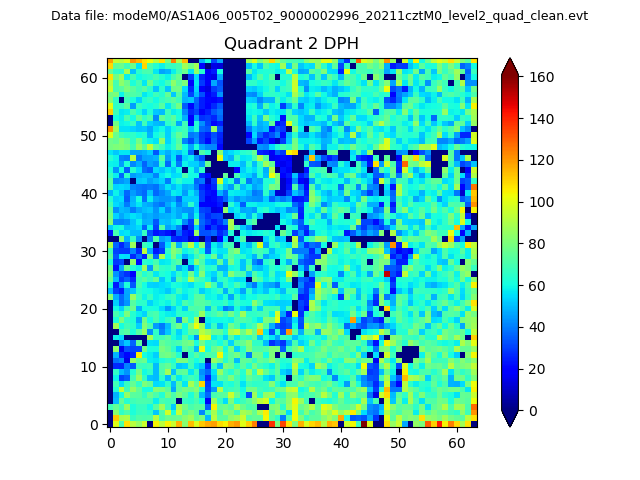
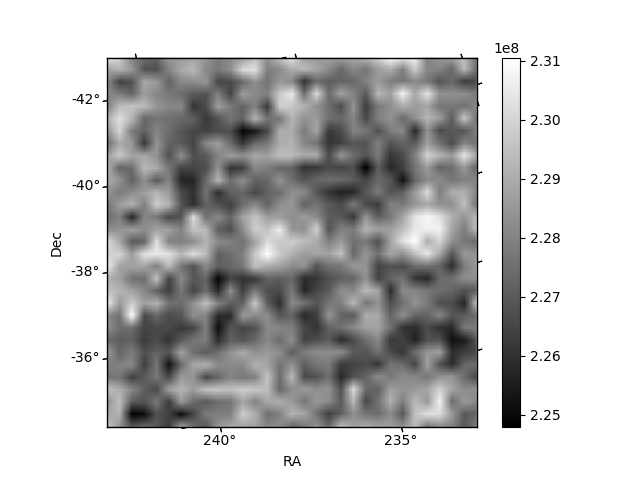
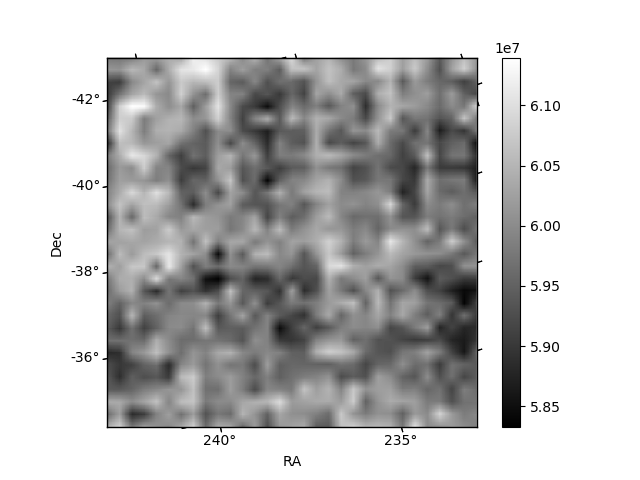
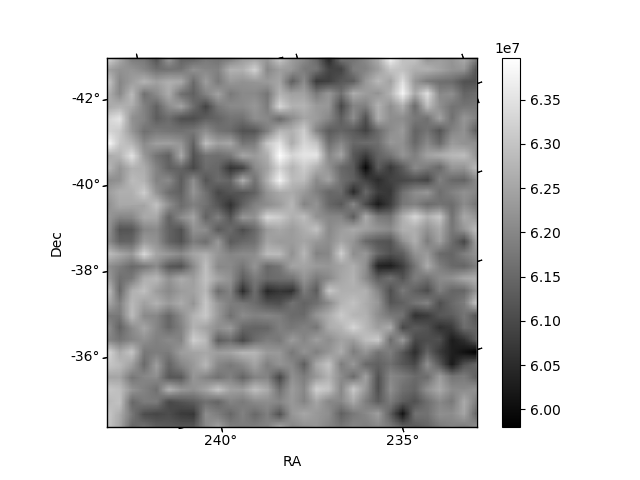
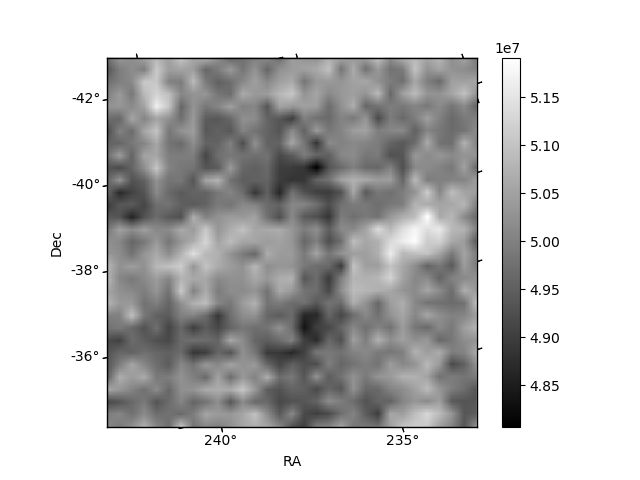
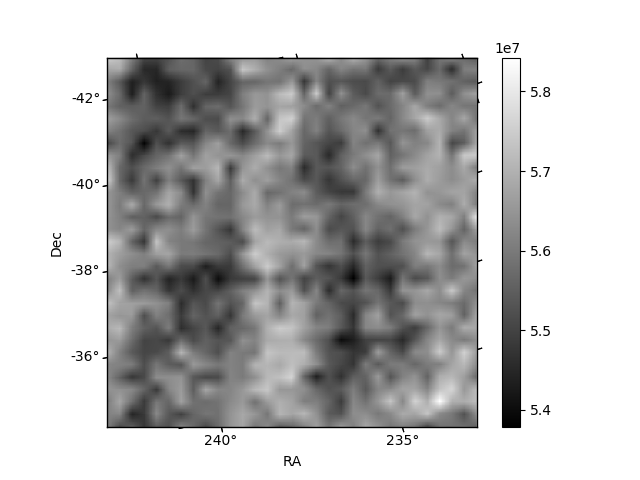
Histogram calculated using DETX and DETY for each event in the final _common_clean file
| Quadrant A | 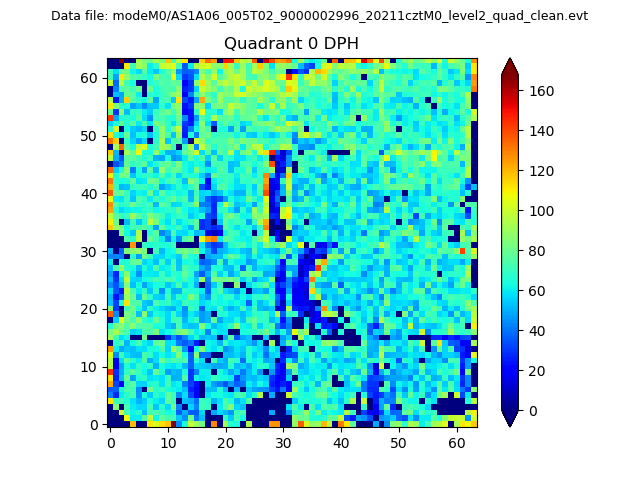 |
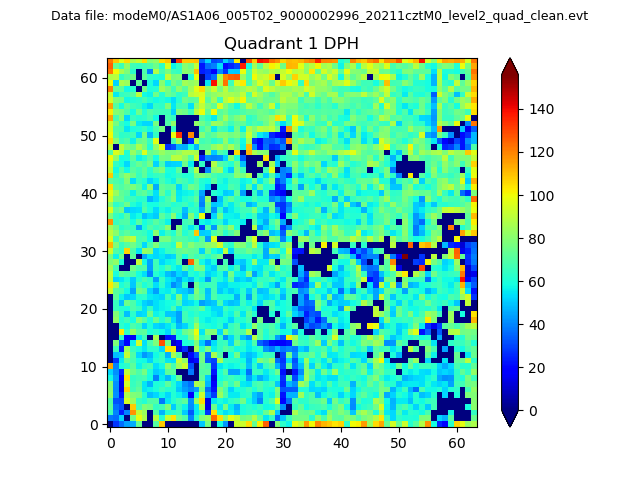 |
Quadrant B |
|---|---|---|---|
| Quadrant D | 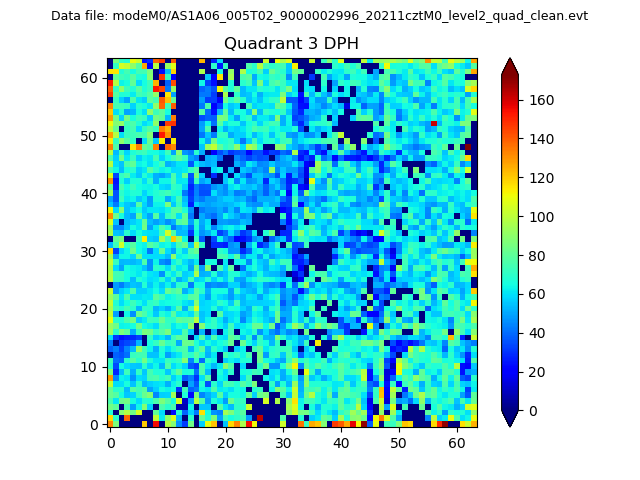 |
 |
Quadrant C |
| Plot type | Count rate plots | Images |
|---|---|---|
| Comparison with Poisson distribution Blue bars denote a histogram of data divided into 1 sec bins. Red curve is a Poisson curve with rate = median count rate of data. |
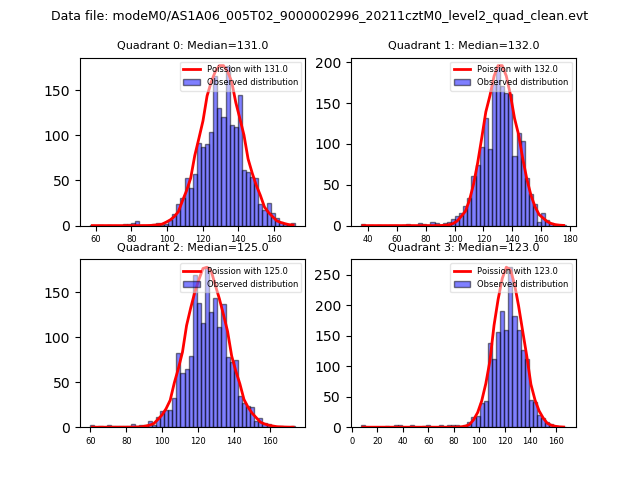 |
 |
| Quadrant-wise count rates Data is divided into 100 sec bins |
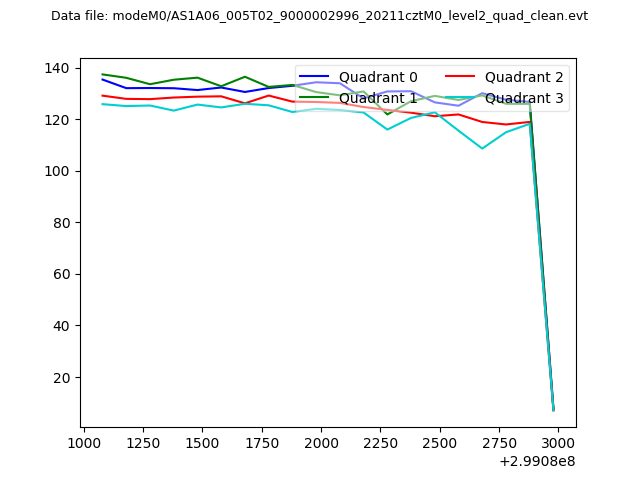 |
|
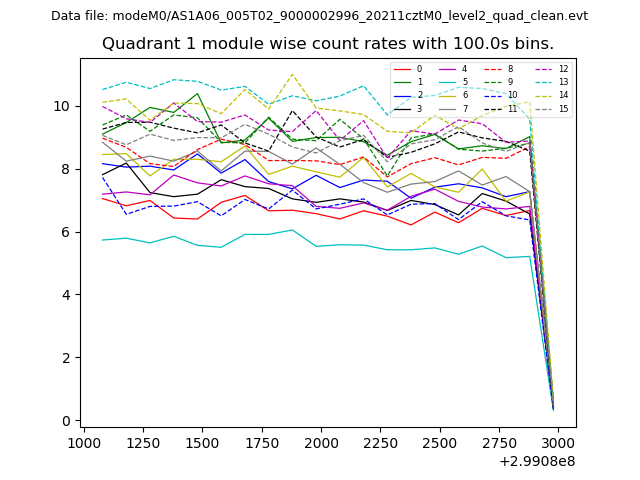
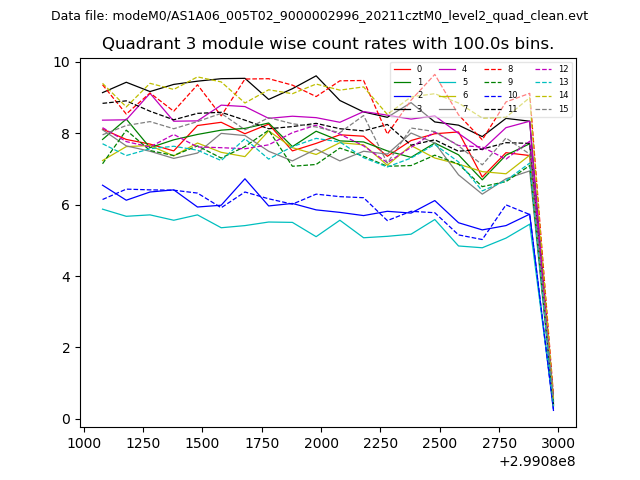
| Module-wise count rates for Quadrant A Data is divided into 100 sec bins |
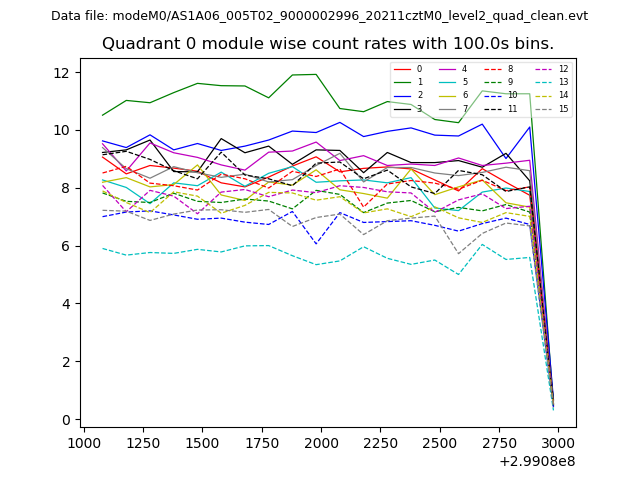 |
 |
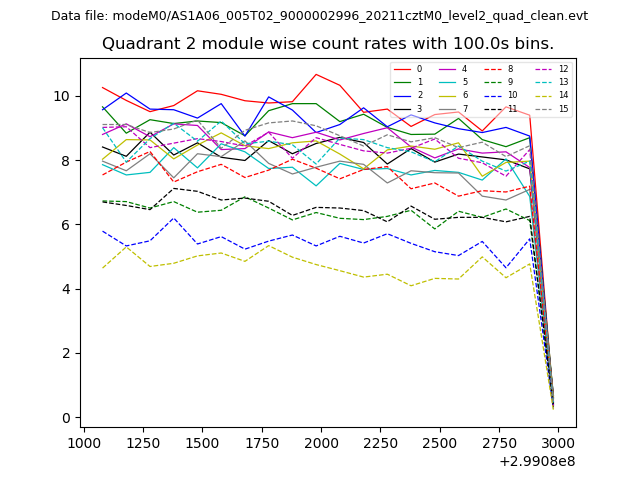
| Module-wise count rates for Quadrant B Data is divided into 100 sec bins |
 |
 |
| Module-wise count rates for Quadrant C Data is divided into 100 sec bins |
 |
 |
| Module-wise count rates for Quadrant D Data is divided into 100 sec bins |
 |
 |
| Parameter | Plot |
|---|---|
| CZT HV Monitor | 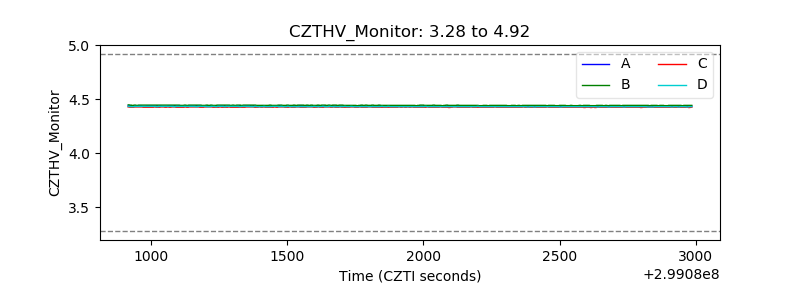 |
| D_VDD | 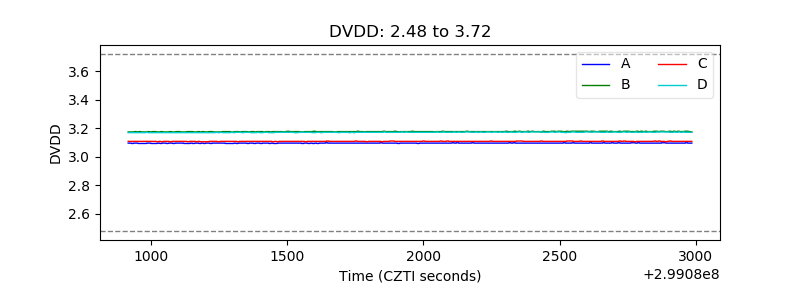 |
| Temperature 1 | 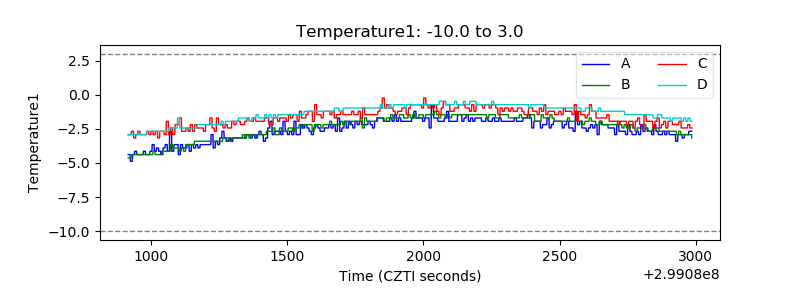 |
| Veto HV Monitor | 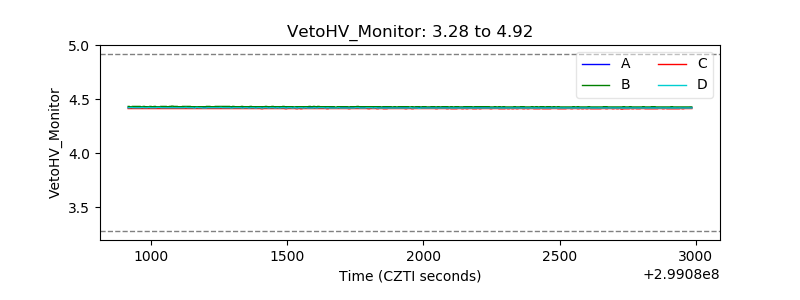 |
| Veto LLD | 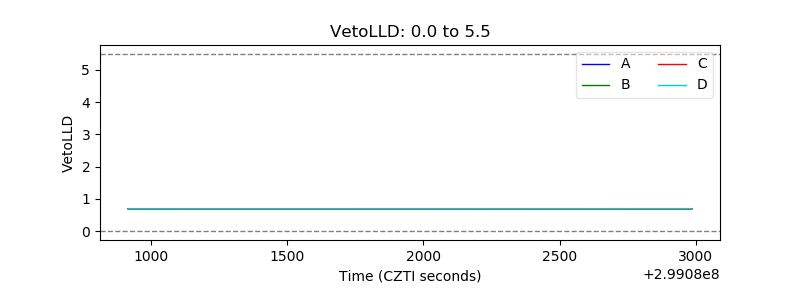 |
| Alpha Counter | 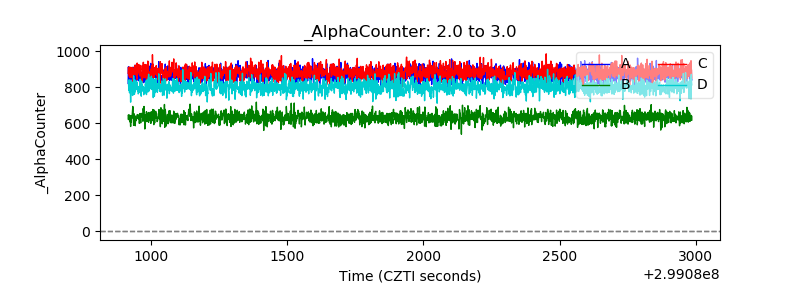 |
| _CPM_Rate | 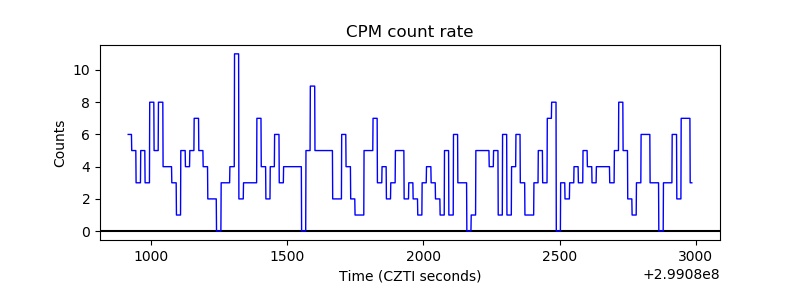 |
| CZT Counter | 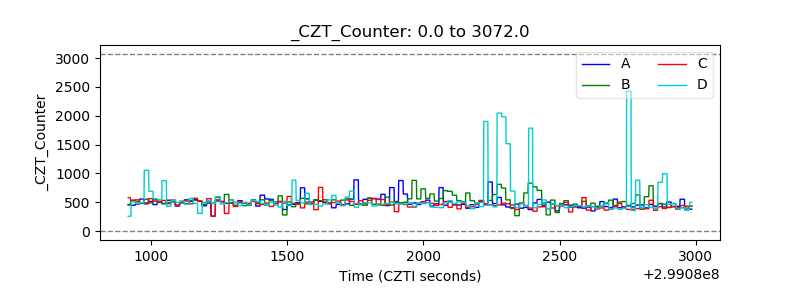 |
| +2.5 Volts monitor |  |
| +5 Volts monitor |  |
| _ROLL_ROT | 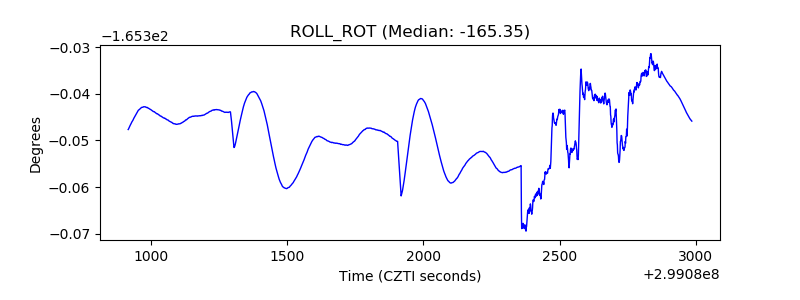 |
| _Roll_DEC | 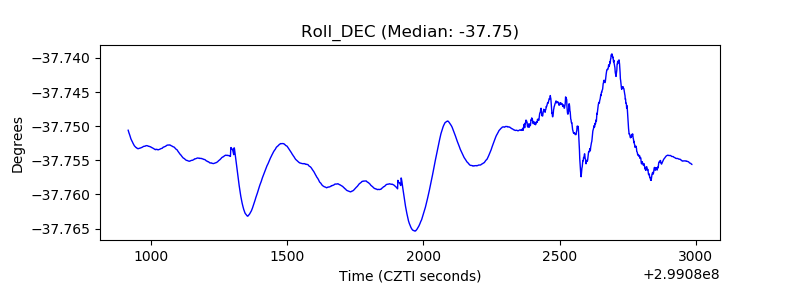 |
| _Roll_RA | 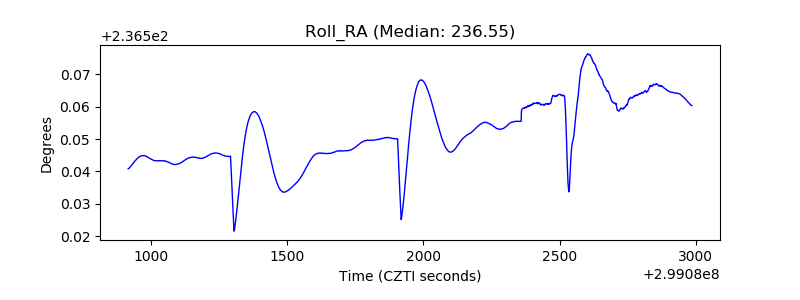 |
| Veto Counter | 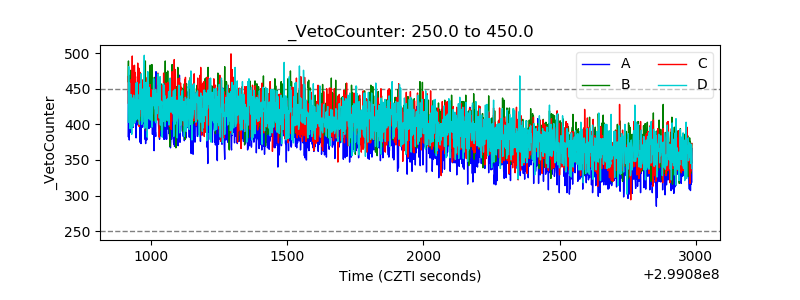 |