| Param | Original file | Final file |
|---|---|---|
| Filename | modeM0/AS1A05_117T01_9000002998cztM0_level2.fits | modeM0/AS1A05_117T01_9000002998cztM0_level2_quad_clean.evt |
| Size (bytes) | 356,261,760 | 358,704,000 |
| Size | 339.8 MB | 342.1 MB |
| Events in quadrant A | 2,185,748 | 2,203,310 |
| Events in quadrant B | 2,075,532 | 2,180,039 |
| Events in quadrant C | 2,146,168 | 2,072,263 |
| Events in quadrant D | 1,834,584 | 1,861,201 |
| Mode M0 | |||
|---|---|---|---|
| Quadrant | BADHDUFLAG | Total packets | Discarded packets |
| A | 0 | 76985 | 0 |
| B | 0 | 82805 | 0 |
| C | 0 | 77113 | 0 |
| D | 0 | 98037 | 0 |
| Mode SS | |||
|---|---|---|---|
| Quadrant | BADHDUFLAG | Total packets | Discarded packets |
| A | 0 | 756 | 0 |
| B | 0 | 754 | 0 |
| C | 0 | 754 | 0 |
| D | 0 | 754 | 0 |
| Mode M9 | |||
|---|---|---|---|
| Quadrant | BADHDUFLAG | Total packets | Discarded packets |
| A | 0 | 165 | 0 |
| B | 0 | 165 | 0 |
| C | 0 | 165 | 0 |
| D | 0 | 165 | 0 |
| Quadrant | Total seconds | Saturated seconds | Saturation percentage |
|---|---|---|---|
| A | 37077 | 309 | 0.833401% |
| B | 37092 | 720 | 1.941119% |
| C | 37086 | 461 | 1.243057% |
| D | 37080 | 2008 | 5.415318% |
Noise dominated data is calculated using 1-second bins in cleaned event files. If a bin has >2000 counts, and if more than 50% of those come from <1% of pixels, then it is considered to be noise-dominated and hence unusable.
| Quadrant | # 1 sec bins | Bins with >0 counts | Bins with >2000 counts | High rate bins dominated by noise | Noise dominated (total time) | Noise dominated (detector-on time) | Marked lightcurve |
|---|---|---|---|---|---|---|---|
| A | 41819 | 36972 | 0 | 0 | 0.00% | 0.00% |  |
| B | 41819 | 36977 | 0 | 0 | 0.00% | 0.00% |  |
| C | 41819 | 36978 | 0 | 0 | 0.00% | 0.00% |  |
| D | 41819 | 36954 | 0 | 0 | 0.00% | 0.00% |  |
Top three noisy pixels from each quadrant. If the there are fewer than three noisy pixels in the level2.evt file, extra rows are filled as -1
| Pixel properties | Quadrant properties | ||||||
|---|---|---|---|---|---|---|---|
| Quadrant | DetID | PixID | Counts | Sigma | Mean | Median | Sigma |
| A | 0 | 29 | 2016 | 10.34 | 569 | 533 | 143.4 |
| A | 7 | 110 | 1846 | 9.16 | 569 | 533 | 143.4 |
| A | 9 | 19 | 1683 | 8.02 | 569 | 533 | 143.4 |
| B | 2 | 9 | 1651 | 10.13 | 549 | 522 | 111.4 |
| B | 14 | 254 | 1417 | 8.03 | 549 | 522 | 111.4 |
| B | 2 | 8 | 1399 | 7.87 | 549 | 522 | 111.4 |
| C | 1 | 80 | 1678 | 7.81 | 565 | 527 | 147.3 |
| C | 1 | 81 | 1663 | 7.71 | 565 | 527 | 147.3 |
| C | 12 | 241 | 1562 | 7.02 | 565 | 527 | 147.3 |
| D | 3 | 14 | 1356 | 6.3 | 523 | 477 | 139.6 |
| D | 7 | 3 | 1335 | 6.15 | 523 | 477 | 139.6 |
| D | 1 | 19 | 1314 | 6.0 | 523 | 477 | 139.6 |
Histogram calculated using DETX and DETY for each event in the final _common_clean file
| Quadrant A | 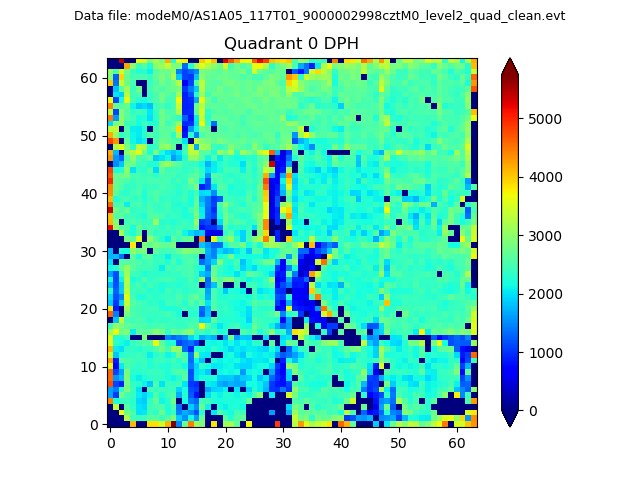 |
 |
Quadrant B |
|---|---|---|---|
| Quadrant D |  |
 |
Quadrant C |
| Plot type | Count rate plots | Images |
|---|---|---|
| Comparison with Poisson distribution Blue bars denote a histogram of data divided into 1 sec bins. Red curve is a Poisson curve with rate = median count rate of data. |
 |
 |
| Quadrant-wise count rates Data is divided into 100 sec bins |
 |
|
| Module-wise count rates for Quadrant A Data is divided into 100 sec bins |
 |
 |
| Module-wise count rates for Quadrant B Data is divided into 100 sec bins |
 |
 |
| Module-wise count rates for Quadrant C Data is divided into 100 sec bins |
 |
 |
| Module-wise count rates for Quadrant D Data is divided into 100 sec bins |
 |
 |
| Parameter | Plot |
|---|---|
| CZT HV Monitor |  |
| D_VDD | 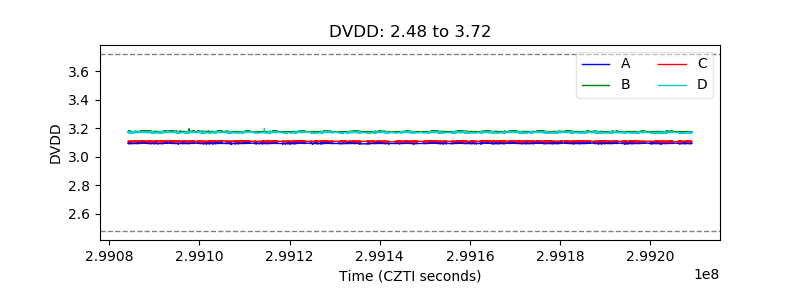 |
| Temperature 1 |  |
| Veto HV Monitor |  |
| Veto LLD |  |
| Alpha Counter |  |
| _CPM_Rate |  |
| CZT Counter |  |
| +2.5 Volts monitor |  |
| +5 Volts monitor |  |
| _ROLL_ROT |  |
| _Roll_DEC |  |
| _Roll_RA |  |
| Veto Counter |  |