| Param | Original file | Final file |
|---|---|---|
| Filename | modeM0/AS1A05_117T01_9000002998_20211cztM0_level2.evt | modeM0/AS1A05_117T01_9000002998_20211cztM0_level2_quad_clean.evt |
| Size (bytes) | 298,877,760 | 41,497,920 |
| Size | 285.0 MB | 39.6 MB |
| Events in quadrant A | 1,968,152 | 250,442 |
| Events in quadrant B | 2,189,420 | 250,781 |
| Events in quadrant C | 1,974,950 | 240,306 |
| Events in quadrant D | 2,652,918 | 239,501 |
| Mode M0 | |||
|---|---|---|---|
| Quadrant | BADHDUFLAG | Total packets | Discarded packets |
| A | 0 | 8233 | 1 |
| B | 0 | 8929 | 2 |
| C | 0 | 8190 | 1 |
| D | 0 | 10422 | 1 |
| Mode SS | |||
|---|---|---|---|
| Quadrant | BADHDUFLAG | Total packets | Discarded packets |
| A | 0 | 80 | 0 |
| B | 0 | 80 | 0 |
| C | 0 | 80 | 0 |
| D | 0 | 80 | 0 |
| Mode M9 | |||
|---|---|---|---|
| Quadrant | BADHDUFLAG | Total packets | Discarded packets |
| A | 0 | 3 | 0 |
| B | 0 | 3 | 0 |
| C | 0 | 3 | 0 |
| D | 0 | 3 | 0 |
| Quadrant | Total seconds | Saturated seconds | Saturation percentage |
|---|---|---|---|
| A | 3896 | 81 | 2.079055% |
| B | 3895 | 144 | 3.697047% |
| C | 3895 | 86 | 2.207959% |
| D | 3895 | 226 | 5.802311% |
Noise dominated data is calculated using 1-second bins in cleaned event files. If a bin has >2000 counts, and if more than 50% of those come from <1% of pixels, then it is considered to be noise-dominated and hence unusable.
| Quadrant | # 1 sec bins | Bins with >0 counts | Bins with >2000 counts | High rate bins dominated by noise | Noise dominated (total time) | Noise dominated (detector-on time) | Marked lightcurve |
|---|---|---|---|---|---|---|---|
| A | 4201 | 3897 | 2 | 2 | 0.05% | 0.05% |  |
| B | 4200 | 3896 | 14 | 14 | 0.33% | 0.36% |  |
| C | 4200 | 3896 | 0 | 0 | 0.00% | 0.00% |  |
| D | 4200 | 3896 | 119 | 119 | 2.83% | 3.05% |  |
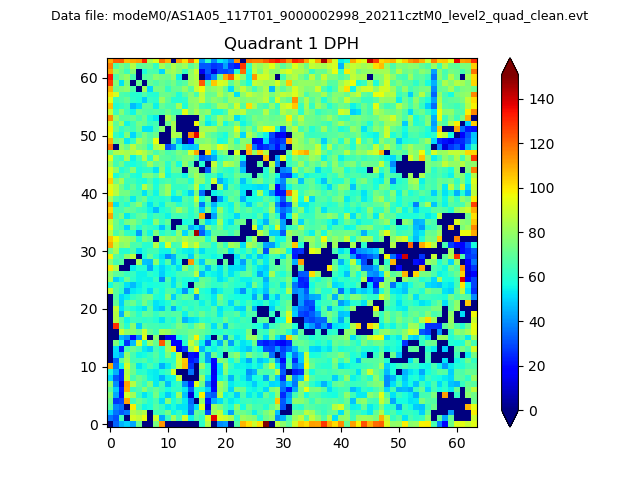
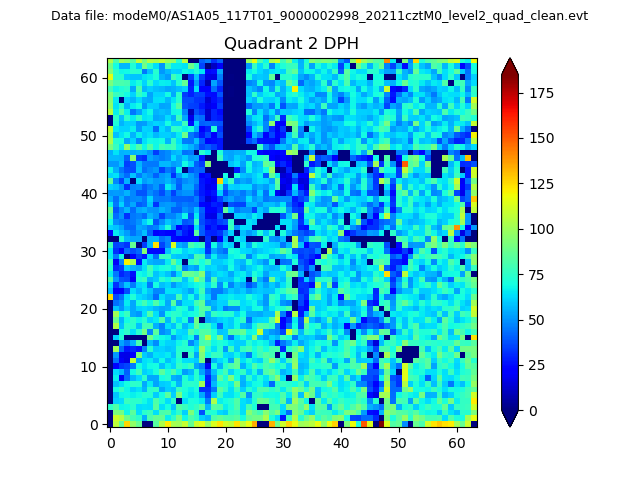
Top three noisy pixels from each quadrant. If the there are fewer than three noisy pixels in the level2.evt file, extra rows are filled as -1
| Pixel properties | Quadrant properties | ||||||
|---|---|---|---|---|---|---|---|
| Quadrant | DetID | PixID | Counts | Sigma | Mean | Median | Sigma |
| A | 4 | 2 | 14084 | 129.46 | 505 | 493 | 105.0 |
| A | 14 | 238 | 6883 | 60.86 | 505 | 493 | 105.0 |
| A | 0 | 226 | 4399 | 37.2 | 505 | 493 | 105.0 |
| B | 0 | 197 | 116761 | 1205.81 | 495 | 482 | 96.4 |
| B | 7 | 220 | 48302 | 495.89 | 495 | 482 | 96.4 |
| B | 15 | 36 | 46368 | 475.84 | 495 | 482 | 96.4 |
| C | 14 | 238 | 72278 | 630.49 | 480 | 483 | 113.9 |
| C | 3 | 233 | 24399 | 210.02 | 480 | 483 | 113.9 |
| C | 1 | 16 | 5188 | 41.32 | 480 | 483 | 113.9 |
| D | 7 | 38 | 431256 | 3629.47 | 488 | 472 | 118.7 |
| D | 1 | 52 | 163959 | 1377.42 | 488 | 472 | 118.7 |
| D | 5 | 222 | 107889 | 905.02 | 488 | 472 | 118.7 |
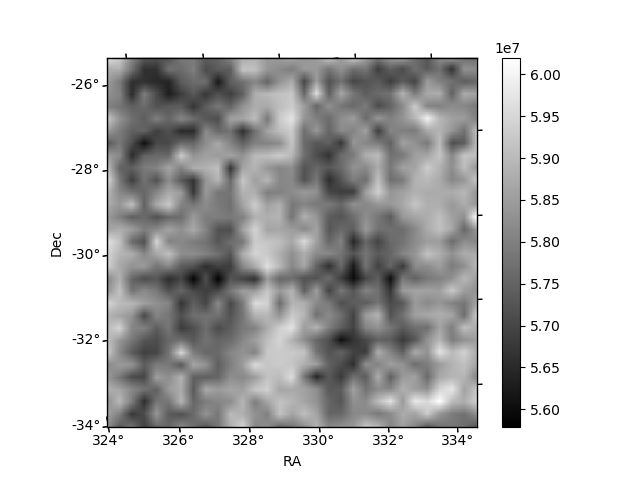
Histogram calculated using DETX and DETY for each event in the final _common_clean file
| Quadrant A | 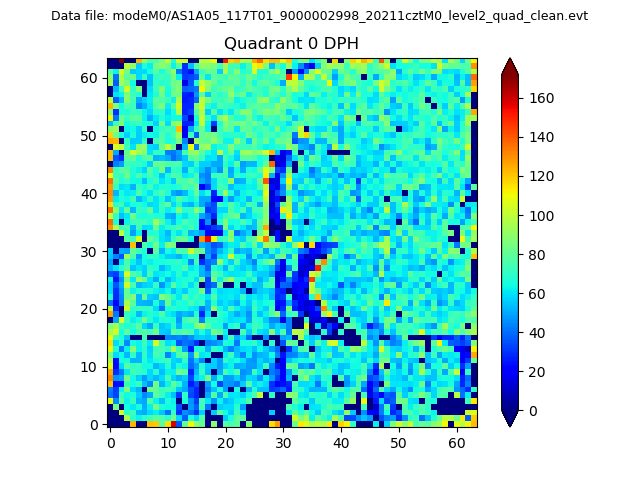 |
 |
Quadrant B |
|---|---|---|---|
| Quadrant D | 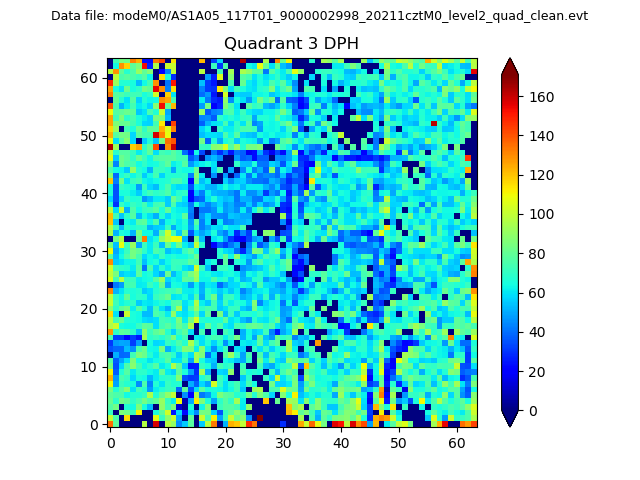 |
 |
Quadrant C |
| Plot type | Count rate plots | Images |
|---|---|---|
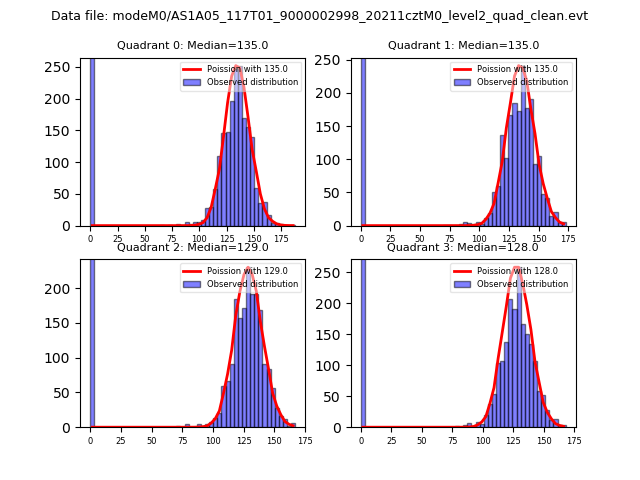
| Comparison with Poisson distribution Blue bars denote a histogram of data divided into 1 sec bins. Red curve is a Poisson curve with rate = median count rate of data. |
 |
 |
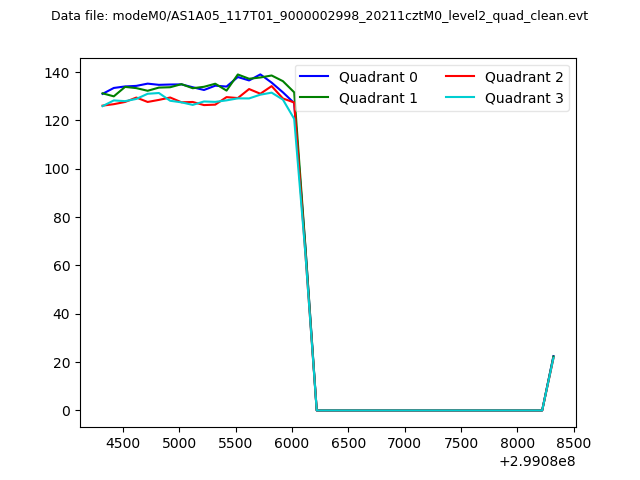
| Quadrant-wise count rates Data is divided into 100 sec bins |
 |
|
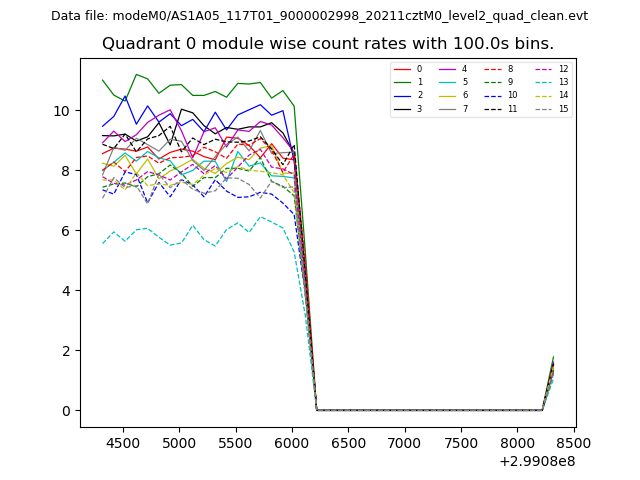
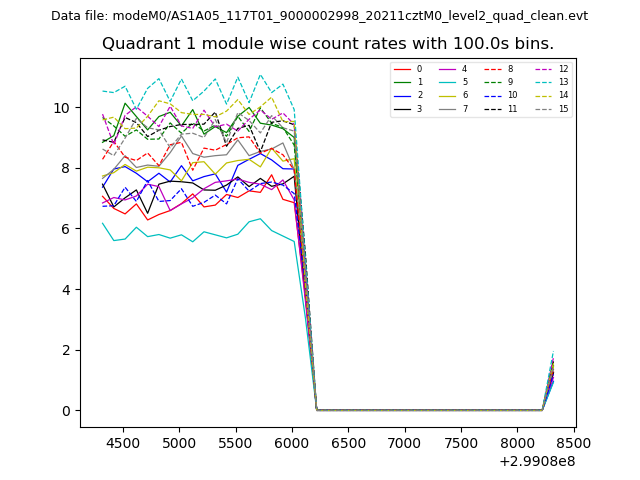
| Module-wise count rates for Quadrant A Data is divided into 100 sec bins |
 |
 |
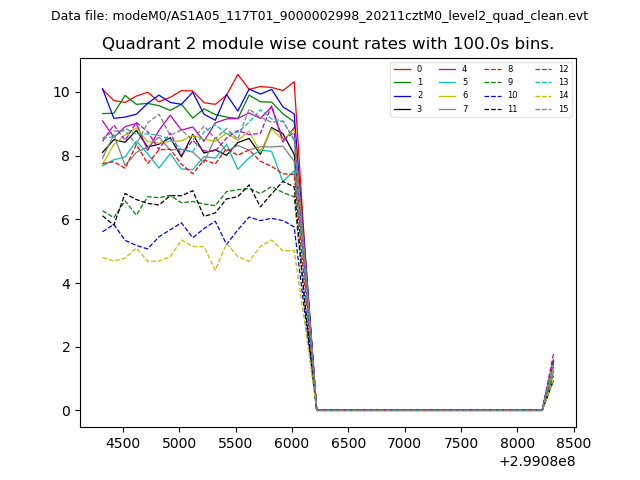
| Module-wise count rates for Quadrant B Data is divided into 100 sec bins |
 |
 |
| Module-wise count rates for Quadrant C Data is divided into 100 sec bins |
 |
 |
| Module-wise count rates for Quadrant D Data is divided into 100 sec bins |
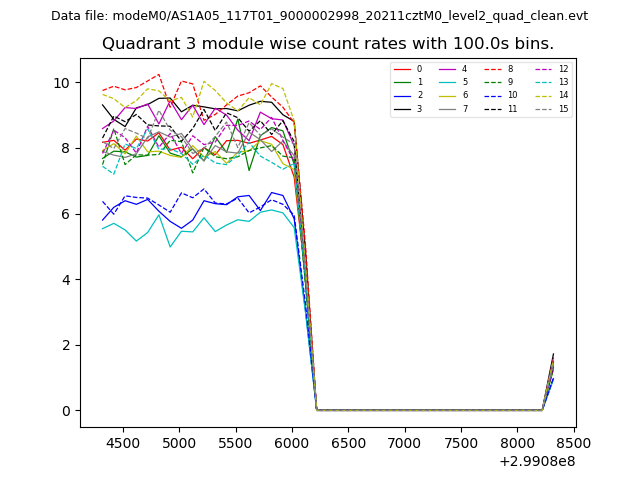 |
 |
| Parameter | Plot |
|---|---|
| CZT HV Monitor | 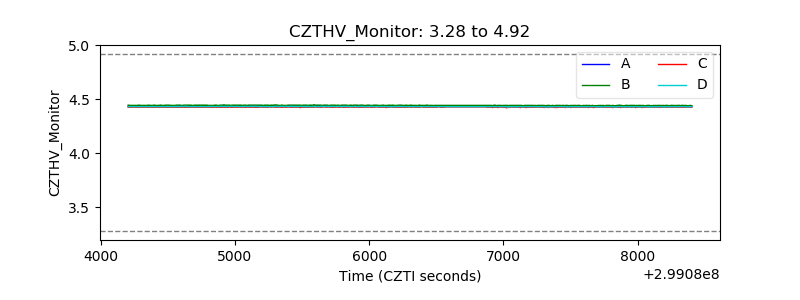 |
| D_VDD | 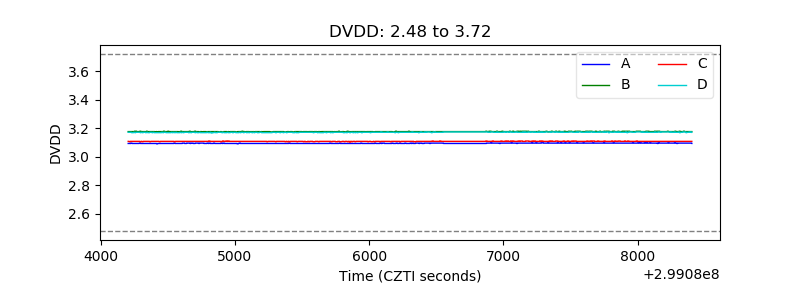 |
| Temperature 1 | 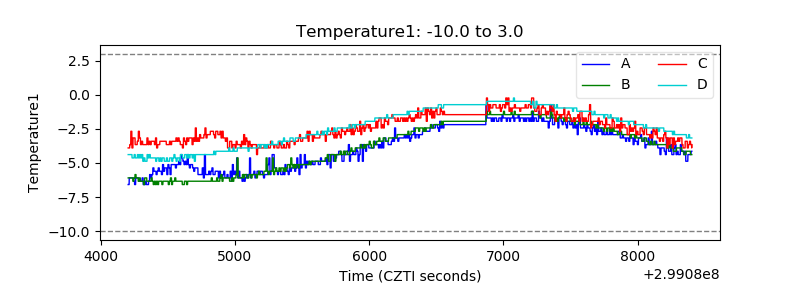 |
| Veto HV Monitor | 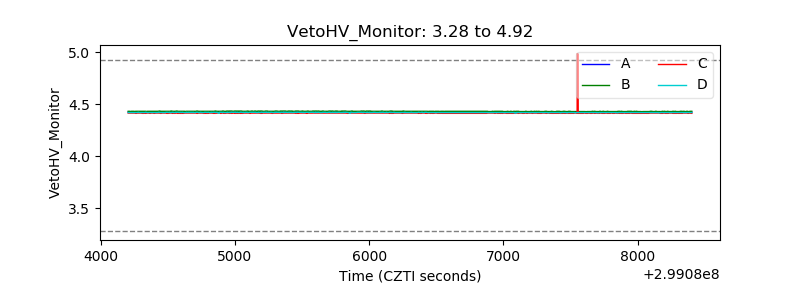 |
| Veto LLD | 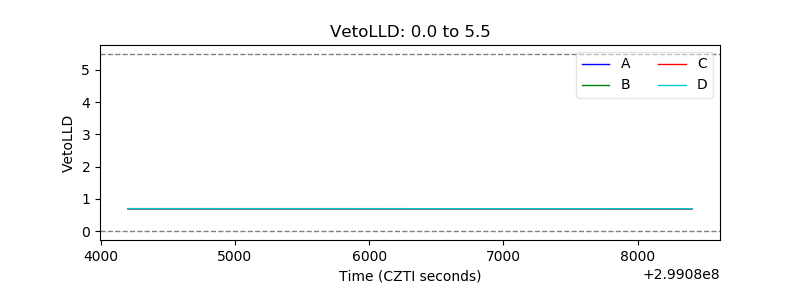 |
| Alpha Counter | 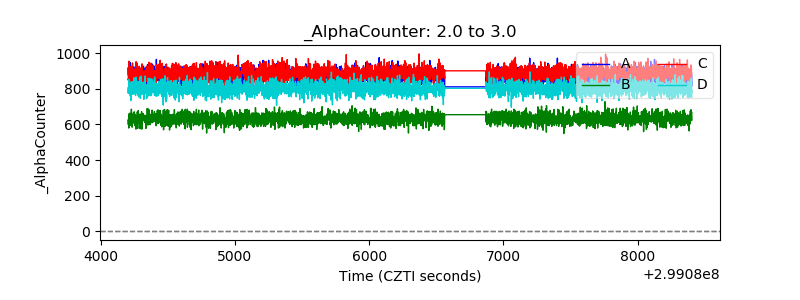 |
| _CPM_Rate | 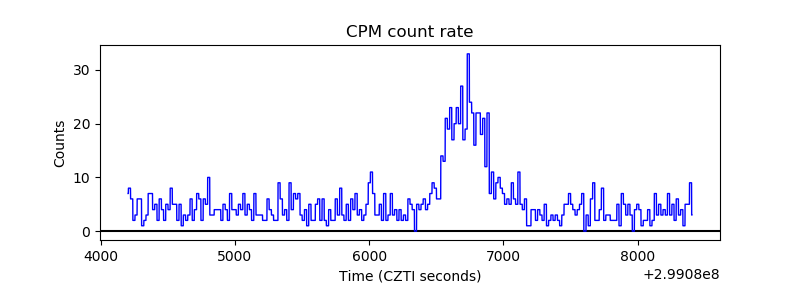 |
| CZT Counter | 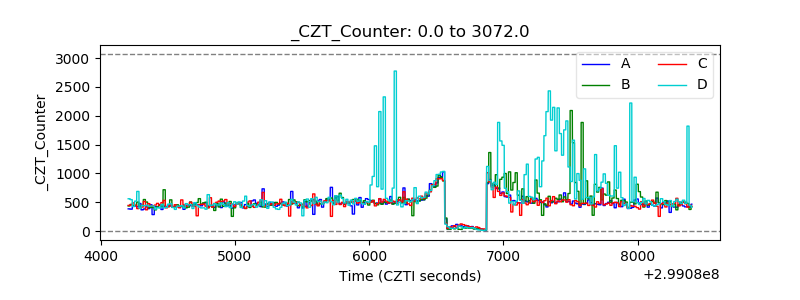 |
| +2.5 Volts monitor |  |
| +5 Volts monitor |  |
| _ROLL_ROT | 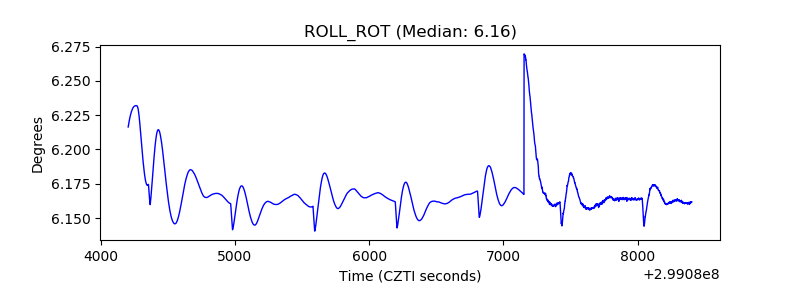 |
| _Roll_DEC | 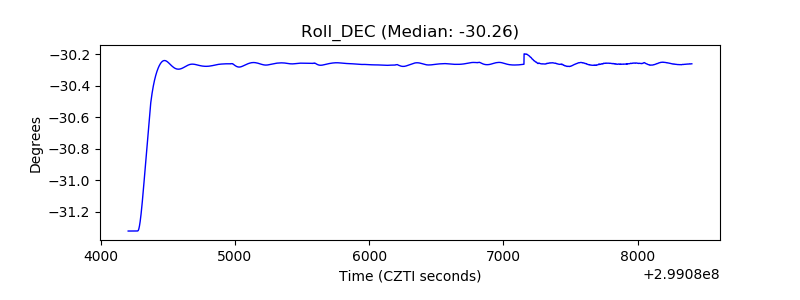 |
| _Roll_RA | 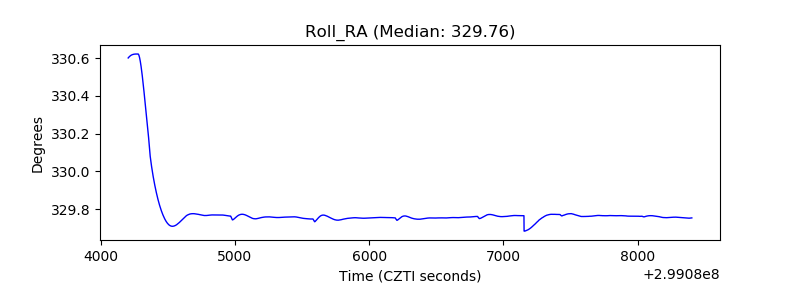 |
| Veto Counter | 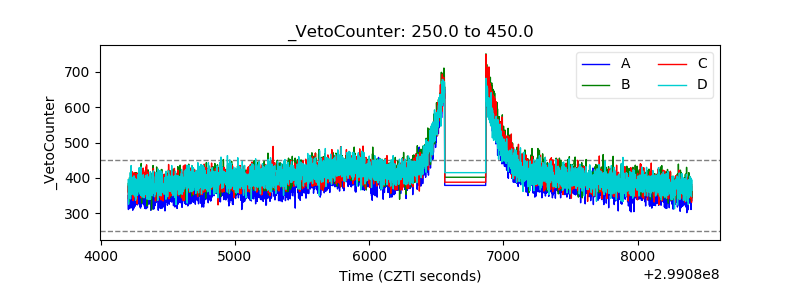 |