| Param | Original file | Final file |
|---|---|---|
| Filename | modeM0/AS1A05_117T01_9000002998_20212cztM0_level2.evt | modeM0/AS1A05_117T01_9000002998_20212cztM0_level2_quad_clean.evt |
| Size (bytes) | 590,624,640 | 86,120,640 |
| Size | 563.3 MB | 82.1 MB |
| Events in quadrant A | 3,640,866 | 540,120 |
| Events in quadrant B | 4,243,249 | 535,588 |
| Events in quadrant C | 3,666,527 | 516,634 |
| Events in quadrant D | 5,826,854 | 492,883 |
| Mode M0 | |||
|---|---|---|---|
| Quadrant | BADHDUFLAG | Total packets | Discarded packets |
| A | 0 | 15574 | 2 |
| B | 0 | 17472 | 2 |
| C | 0 | 15518 | 2 |
| D | 0 | 22371 | 2 |
| Mode SS | |||
|---|---|---|---|
| Quadrant | BADHDUFLAG | Total packets | Discarded packets |
| A | 0 | 152 | 0 |
| B | 0 | 152 | 0 |
| C | 0 | 152 | 0 |
| D | 0 | 152 | 0 |
| Mode M9 | |||
|---|---|---|---|
| Quadrant | BADHDUFLAG | Total packets | Discarded packets |
| A | 0 | 4 | 0 |
| B | 0 | 5 | 0 |
| C | 0 | 5 | 0 |
| D | 0 | 5 | 0 |
| Quadrant | Total seconds | Saturated seconds | Saturation percentage |
|---|---|---|---|
| A | 7511 | 115 | 1.531088% |
| B | 7511 | 228 | 3.035548% |
| C | 7511 | 144 | 1.917188% |
| D | 7511 | 824 | 10.970576% |
Noise dominated data is calculated using 1-second bins in cleaned event files. If a bin has >2000 counts, and if more than 50% of those come from <1% of pixels, then it is considered to be noise-dominated and hence unusable.
| Quadrant | # 1 sec bins | Bins with >0 counts | Bins with >2000 counts | High rate bins dominated by noise | Noise dominated (total time) | Noise dominated (detector-on time) | Marked lightcurve |
|---|---|---|---|---|---|---|---|
| A | 7896 | 7512 | 1 | 1 | 0.01% | 0.01% | 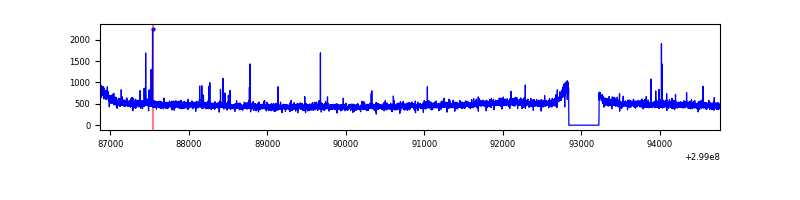 |
| B | 7896 | 7512 | 22 | 22 | 0.28% | 0.29% | 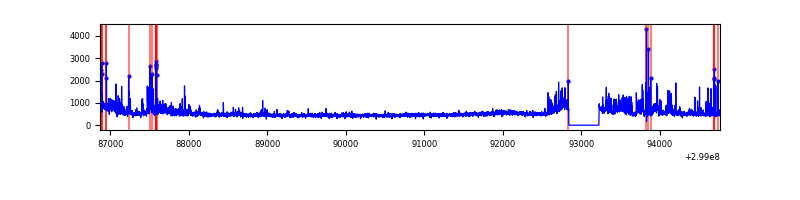 |
| C | 7896 | 7512 | 0 | 0 | 0.00% | 0.00% | 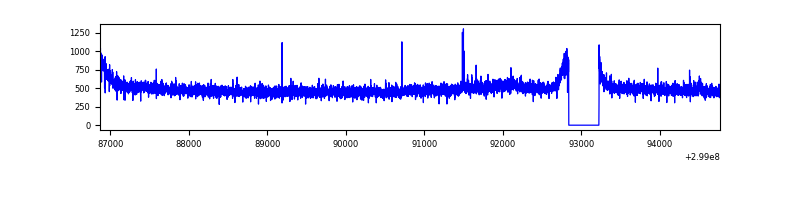 |
| D | 7896 | 7512 | 549 | 549 | 6.95% | 7.31% | 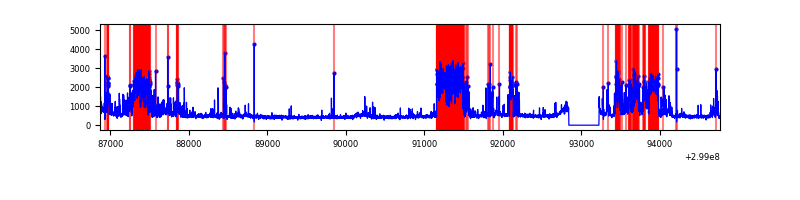 |
Top three noisy pixels from each quadrant. If the there are fewer than three noisy pixels in the level2.evt file, extra rows are filled as -1
| Pixel properties | Quadrant properties | ||||||
|---|---|---|---|---|---|---|---|
| Quadrant | DetID | PixID | Counts | Sigma | Mean | Median | Sigma |
| A | 14 | 238 | 24336 | 124.06 | 934 | 912 | 188.8 |
| A | 4 | 2 | 14583 | 72.41 | 934 | 912 | 188.8 |
| A | 13 | 254 | 8122 | 38.19 | 934 | 912 | 188.8 |
| B | 0 | 197 | 288416 | 1646.84 | 919 | 897 | 174.6 |
| B | 7 | 220 | 112118 | 637.05 | 919 | 897 | 174.6 |
| B | 15 | 222 | 87231 | 494.5 | 919 | 897 | 174.6 |
| C | 14 | 238 | 136399 | 650.78 | 888 | 892 | 208.2 |
| C | 3 | 233 | 46951 | 221.2 | 888 | 892 | 208.2 |
| C | 3 | 9 | 13969 | 62.8 | 888 | 892 | 208.2 |
| D | 7 | 38 | 1067183 | 4974.5 | 882 | 856 | 214.4 |
| D | 1 | 52 | 946490 | 4411.46 | 882 | 856 | 214.4 |
| D | 5 | 222 | 164002 | 761.09 | 882 | 856 | 214.4 |
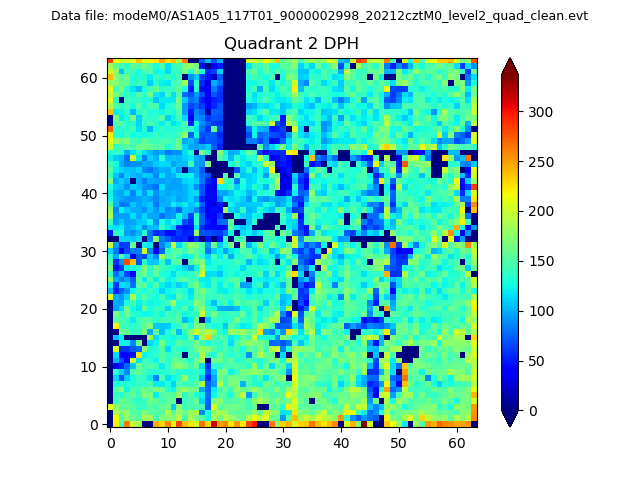
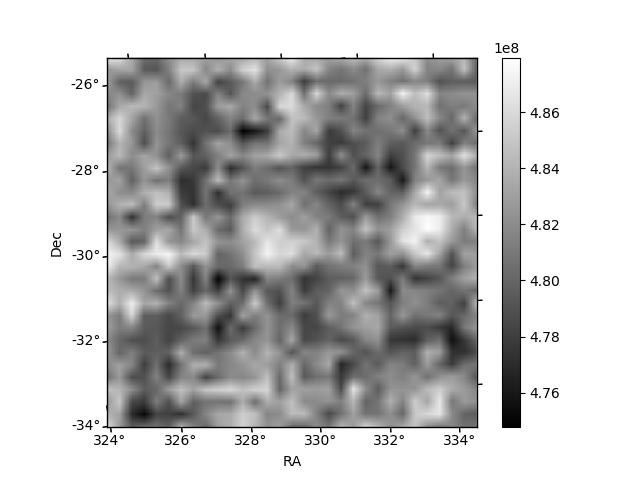
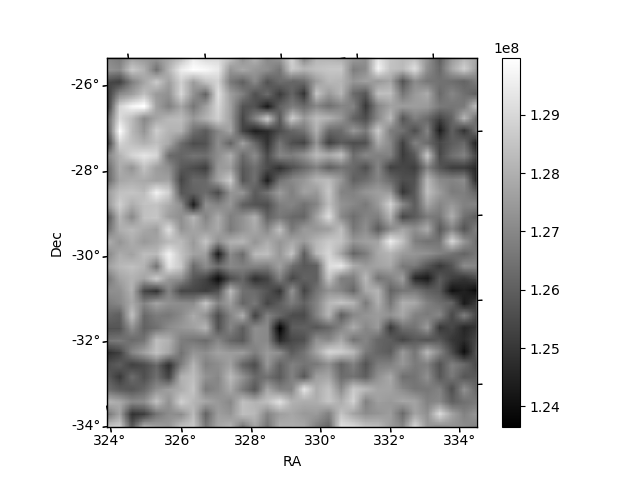
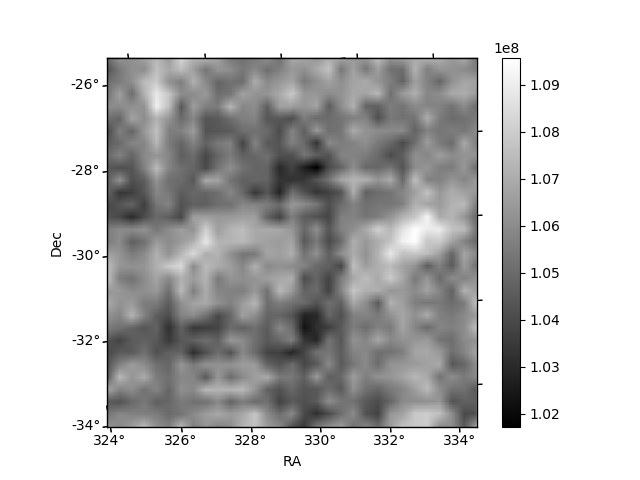
Histogram calculated using DETX and DETY for each event in the final _common_clean file
| Quadrant A | 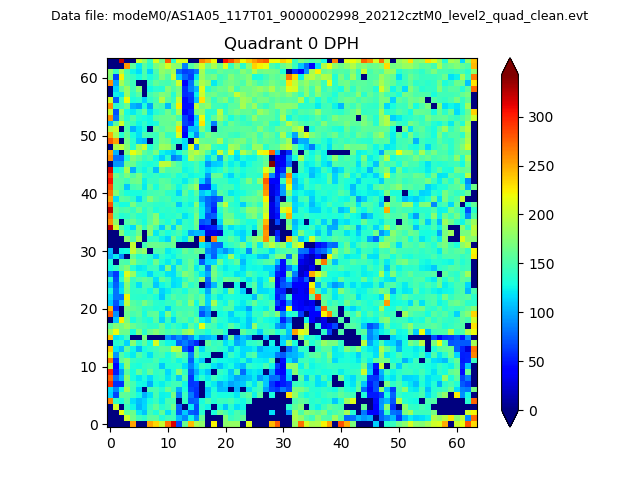 |
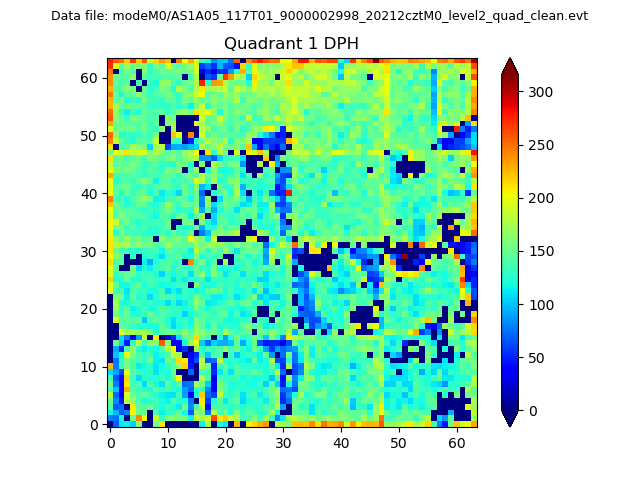 |
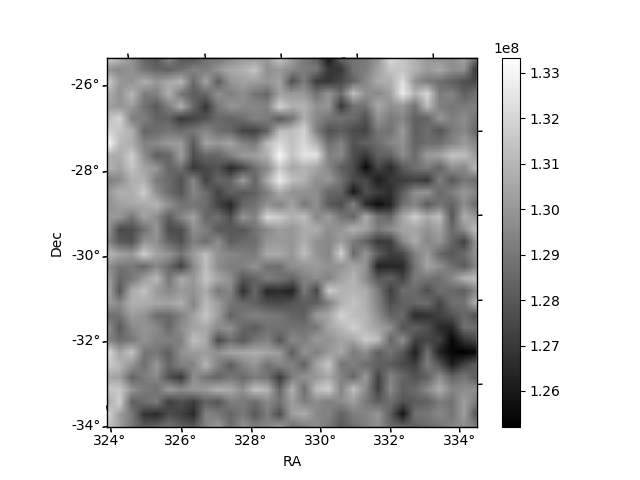
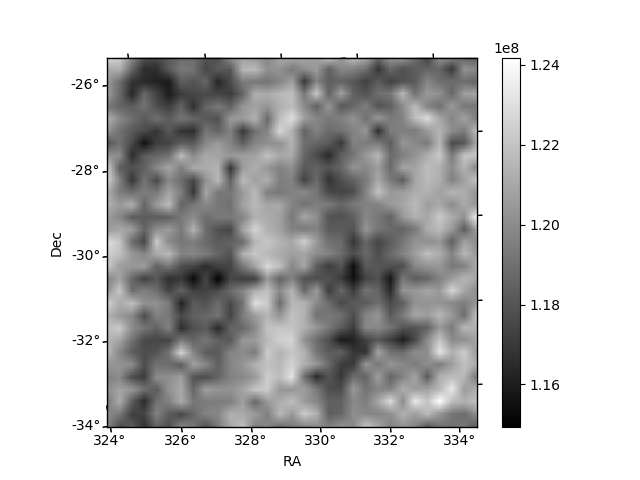
Quadrant B |
|---|---|---|---|
| Quadrant D | 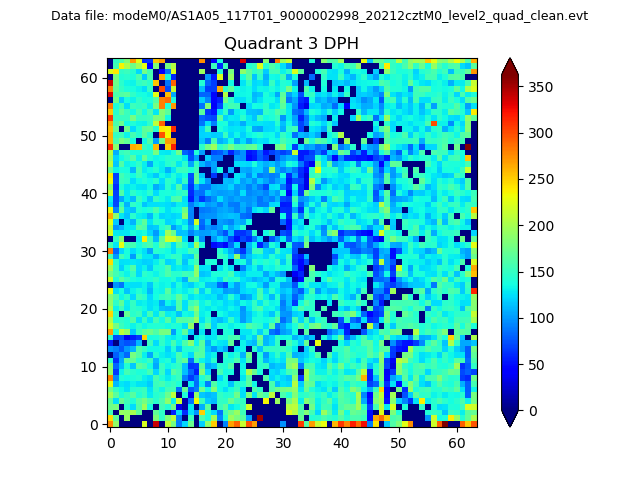 |
 |
Quadrant C |
| Plot type | Count rate plots | Images |
|---|---|---|
| Comparison with Poisson distribution Blue bars denote a histogram of data divided into 1 sec bins. Red curve is a Poisson curve with rate = median count rate of data. |
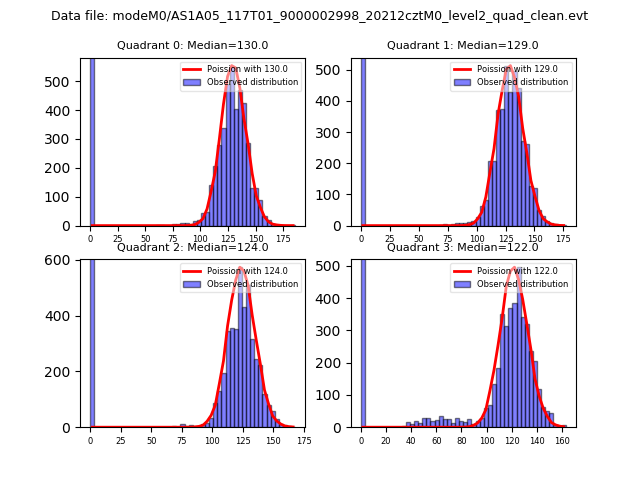 |
 |
| Quadrant-wise count rates Data is divided into 100 sec bins |
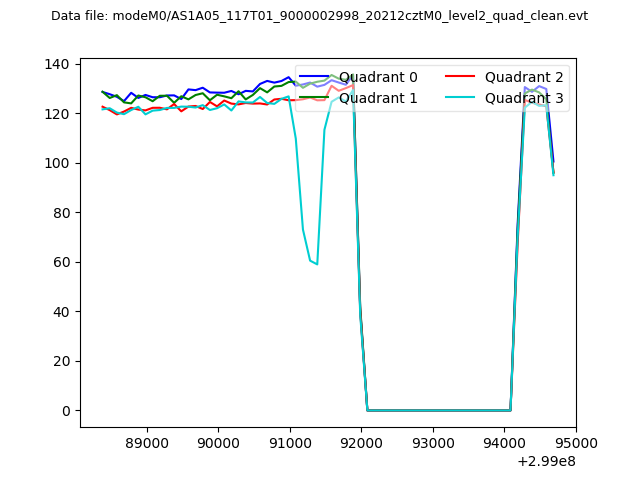 |
|
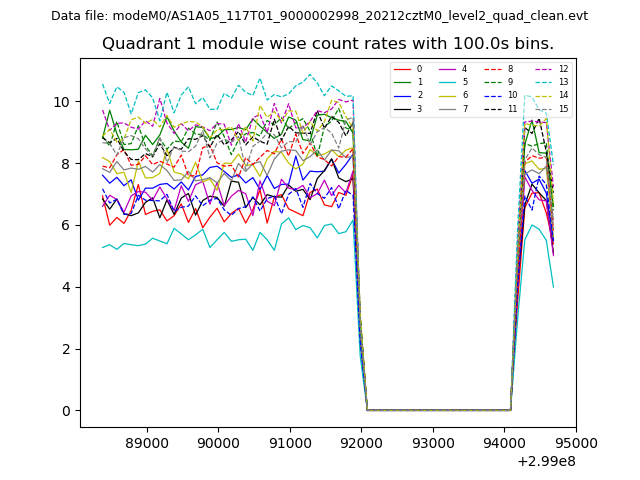
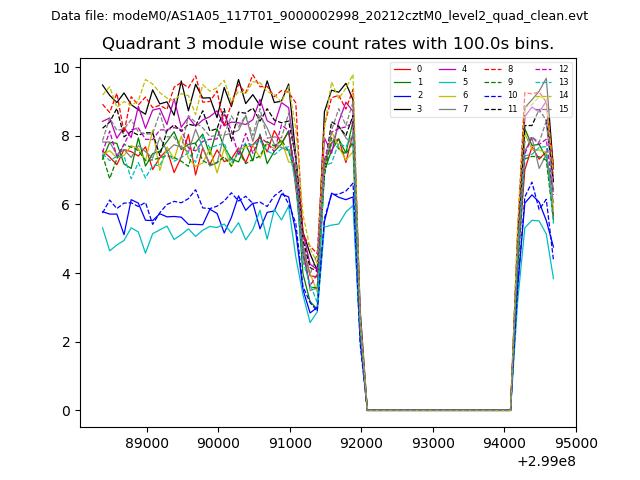
| Module-wise count rates for Quadrant A Data is divided into 100 sec bins |
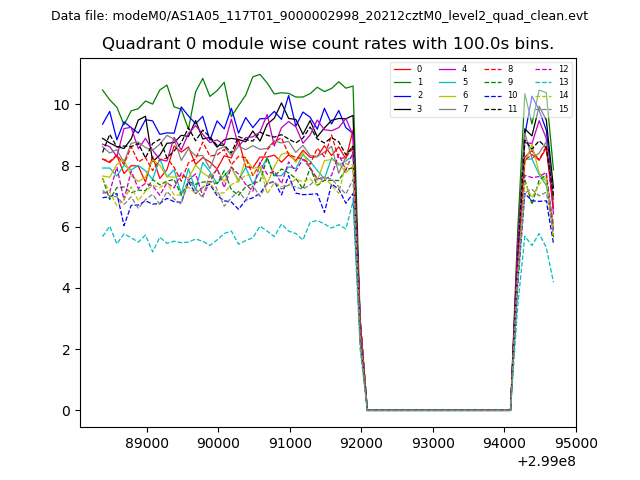 |
 |
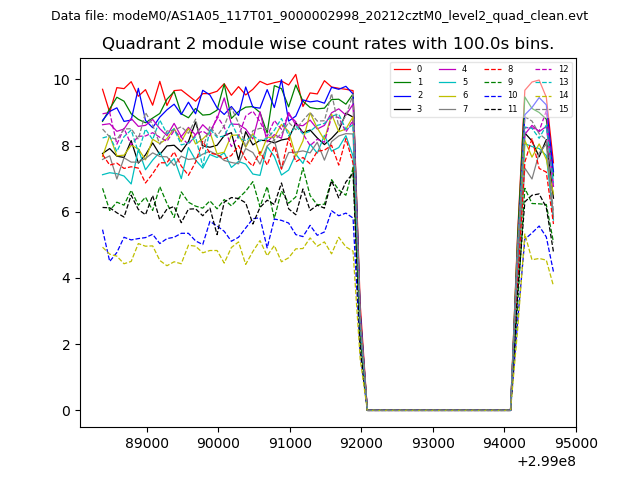
| Module-wise count rates for Quadrant B Data is divided into 100 sec bins |
 |
 |
| Module-wise count rates for Quadrant C Data is divided into 100 sec bins |
 |
 |
| Module-wise count rates for Quadrant D Data is divided into 100 sec bins |
 |
 |
| Parameter | Plot |
|---|---|
| CZT HV Monitor | 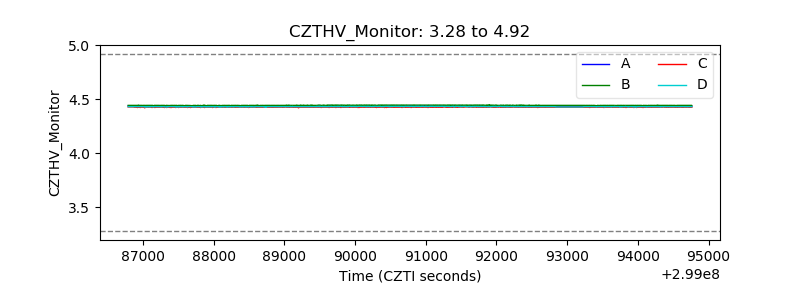 |
| D_VDD | 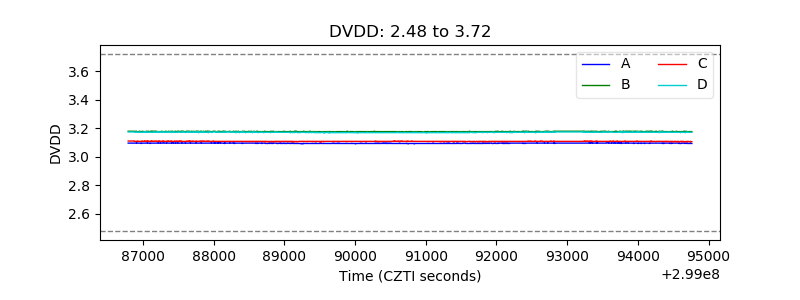 |
| Temperature 1 | 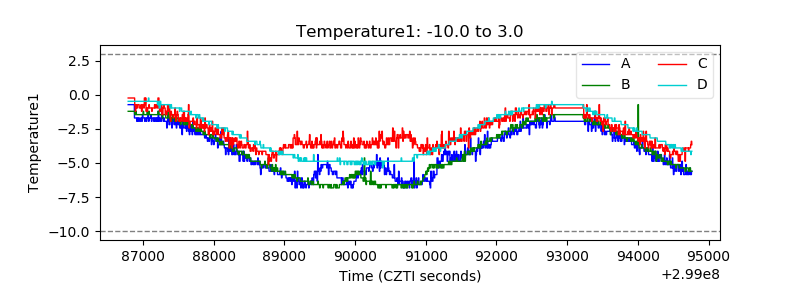 |
| Veto HV Monitor | 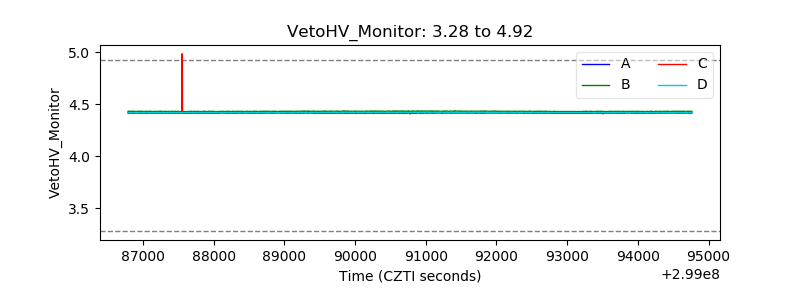 |
| Veto LLD | 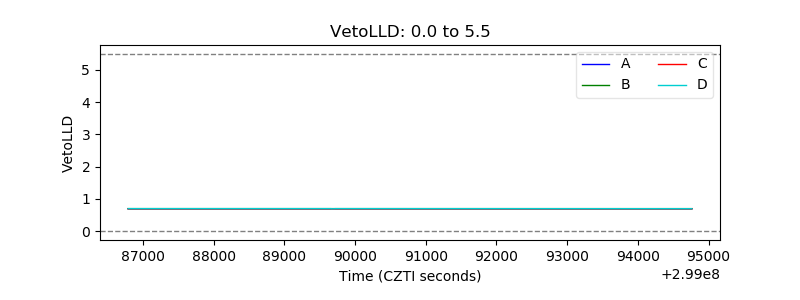 |
| Alpha Counter | 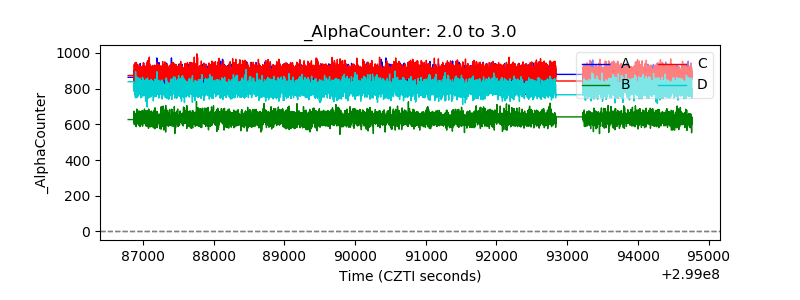 |
| _CPM_Rate | 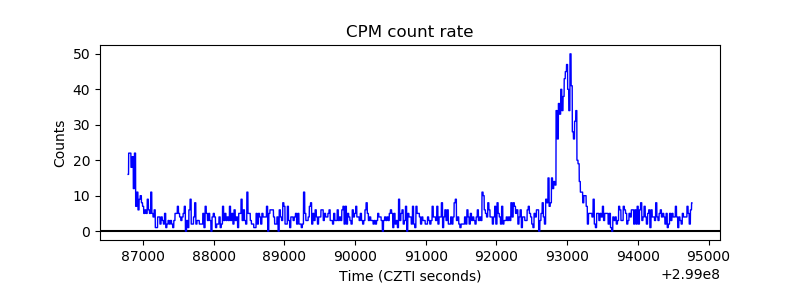 |
| CZT Counter | 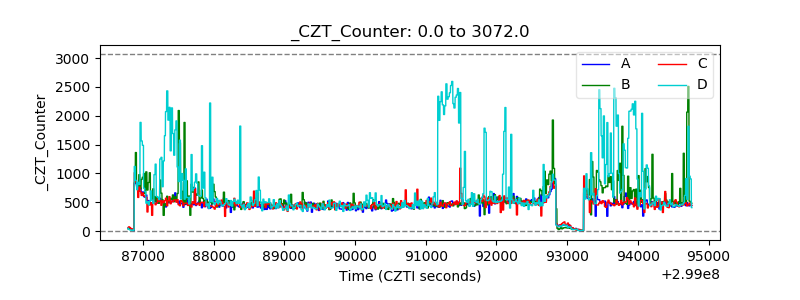 |
| +2.5 Volts monitor |  |
| +5 Volts monitor | 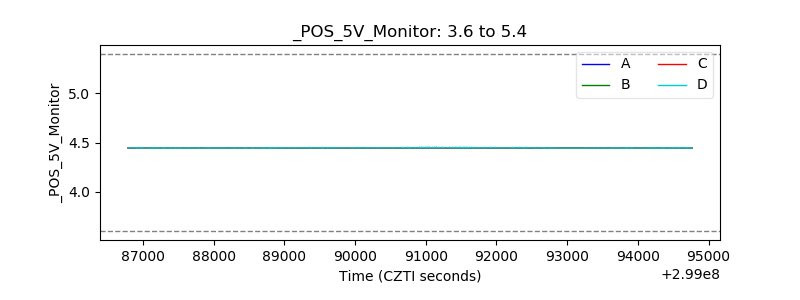 |
| _ROLL_ROT | 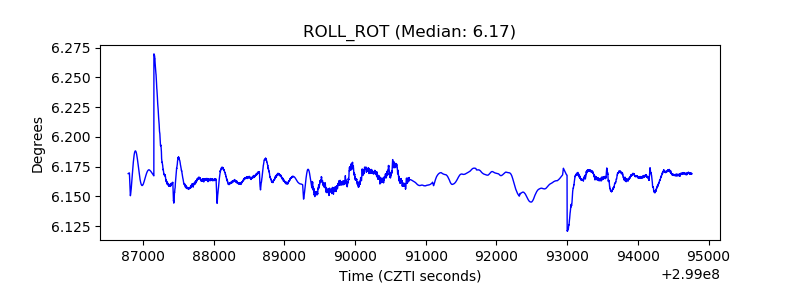 |
| _Roll_DEC | 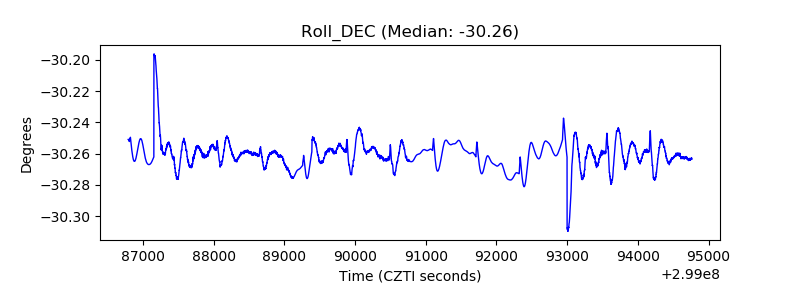 |
| _Roll_RA | 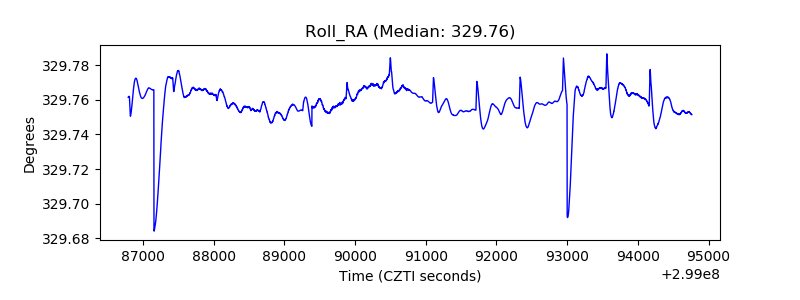 |
| Veto Counter | 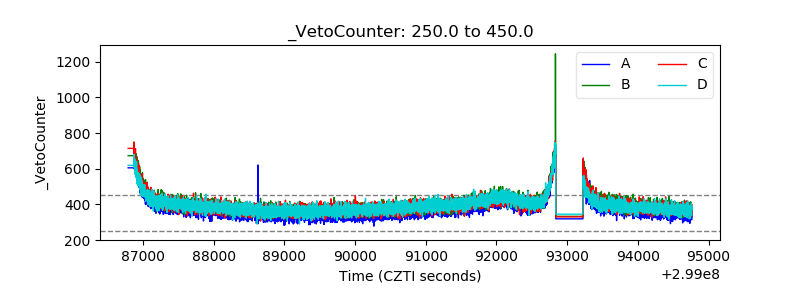 |