| Param | Original file | Final file |
|---|---|---|
| Filename | modeM0/AS1A05_117T01_9000002998_20214cztM0_level2.evt | modeM0/AS1A05_117T01_9000002998_20214cztM0_level2_quad_clean.evt |
| Size (bytes) | 316,944,000 | 70,185,600 |
| Size | 302.3 MB | 66.9 MB |
| Events in quadrant A | 2,037,262 | 463,301 |
| Events in quadrant B | 2,345,195 | 459,761 |
| Events in quadrant C | 2,064,980 | 443,376 |
| Events in quadrant D | 2,842,847 | 441,121 |
| Mode M0 | |||
|---|---|---|---|
| Quadrant | BADHDUFLAG | Total packets | Discarded packets |
| A | 0 | 9112 | 0 |
| B | 0 | 10017 | 0 |
| C | 0 | 9066 | 0 |
| D | 0 | 11574 | 0 |
| Mode SS | |||
|---|---|---|---|
| Quadrant | BADHDUFLAG | Total packets | Discarded packets |
| A | 0 | 90 | 0 |
| B | 0 | 90 | 0 |
| C | 0 | 90 | 0 |
| D | 0 | 90 | 0 |
| Quadrant | Total seconds | Saturated seconds | Saturation percentage |
|---|---|---|---|
| A | 4519 | 3 | 0.066386% |
| B | 4520 | 40 | 0.884956% |
| C | 4520 | 15 | 0.331858% |
| D | 4520 | 208 | 4.601770% |
Noise dominated data is calculated using 1-second bins in cleaned event files. If a bin has >2000 counts, and if more than 50% of those come from <1% of pixels, then it is considered to be noise-dominated and hence unusable.
| Quadrant | # 1 sec bins | Bins with >0 counts | Bins with >2000 counts | High rate bins dominated by noise | Noise dominated (total time) | Noise dominated (detector-on time) | Marked lightcurve |
|---|---|---|---|---|---|---|---|
| A | 4519 | 4519 | 0 | 0 | 0.00% | 0.00% |  |
| B | 4520 | 4520 | 8 | 8 | 0.18% | 0.18% |  |
| C | 4520 | 4520 | 0 | 0 | 0.00% | 0.00% |  |
| D | 4520 | 4520 | 166 | 166 | 3.67% | 3.67% | 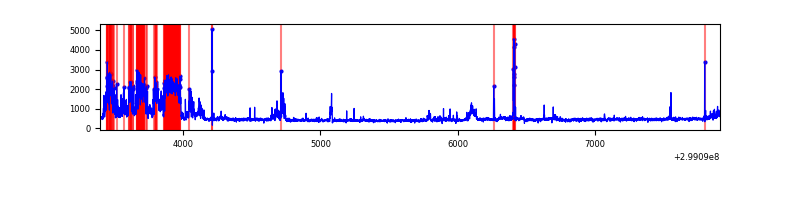 |
Top three noisy pixels from each quadrant. If the there are fewer than three noisy pixels in the level2.evt file, extra rows are filled as -1
| Pixel properties | Quadrant properties | ||||||
|---|---|---|---|---|---|---|---|
| Quadrant | DetID | PixID | Counts | Sigma | Mean | Median | Sigma |
| A | 14 | 238 | 19199 | 173.43 | 523 | 513 | 107.7 |
| A | 0 | 226 | 4416 | 36.23 | 523 | 513 | 107.7 |
| A | 13 | 254 | 4329 | 35.42 | 523 | 513 | 107.7 |
| B | 0 | 197 | 144699 | 1417.06 | 520 | 506 | 101.8 |
| B | 15 | 222 | 86913 | 849.17 | 520 | 506 | 101.8 |
| B | 7 | 220 | 17185 | 163.91 | 520 | 506 | 101.8 |
| C | 14 | 238 | 77817 | 648.04 | 504 | 507 | 119.3 |
| C | 3 | 233 | 13273 | 107.01 | 504 | 507 | 119.3 |
| C | 1 | 16 | 9479 | 75.21 | 504 | 507 | 119.3 |
| D | 7 | 38 | 595512 | 4831.9 | 506 | 492 | 123.1 |
| D | 5 | 222 | 143396 | 1160.46 | 506 | 492 | 123.1 |
| D | 7 | 238 | 81797 | 660.24 | 506 | 492 | 123.1 |
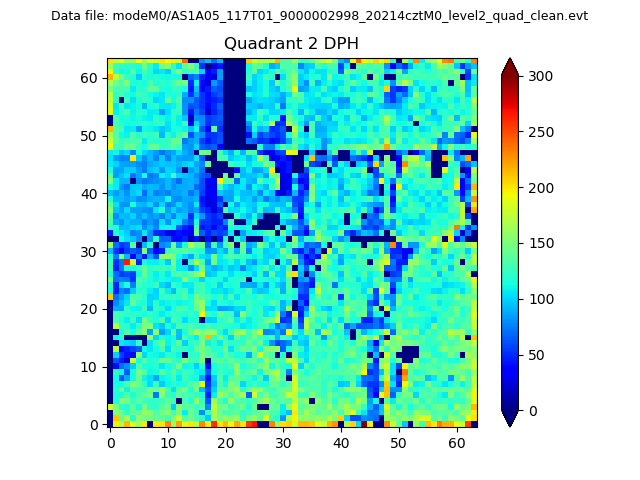
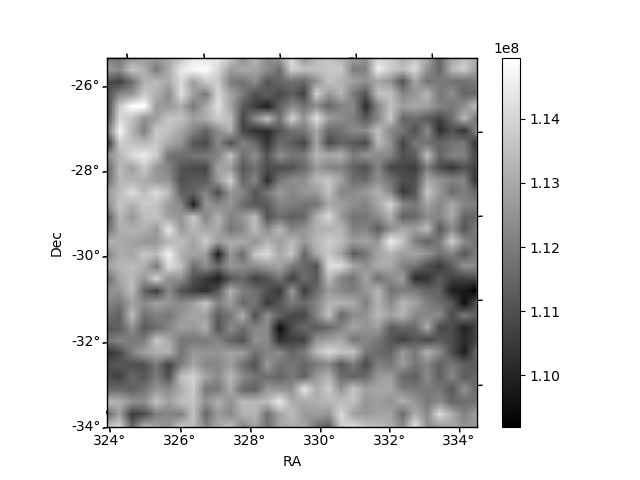
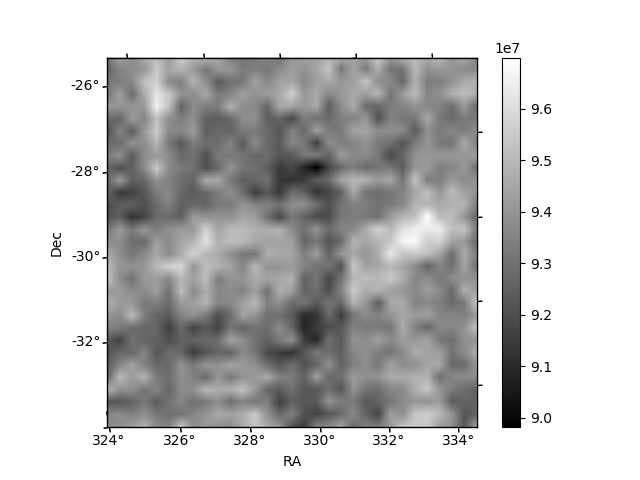
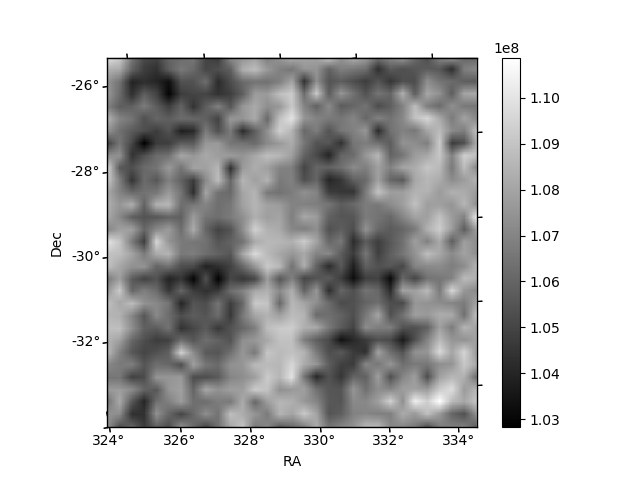
Histogram calculated using DETX and DETY for each event in the final _common_clean file
| Quadrant A | 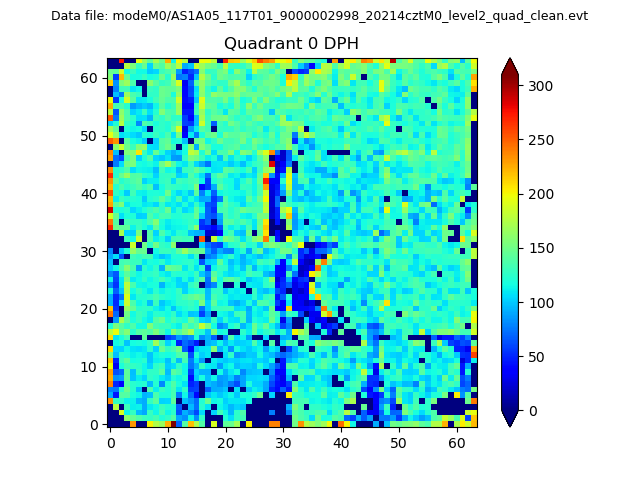 |
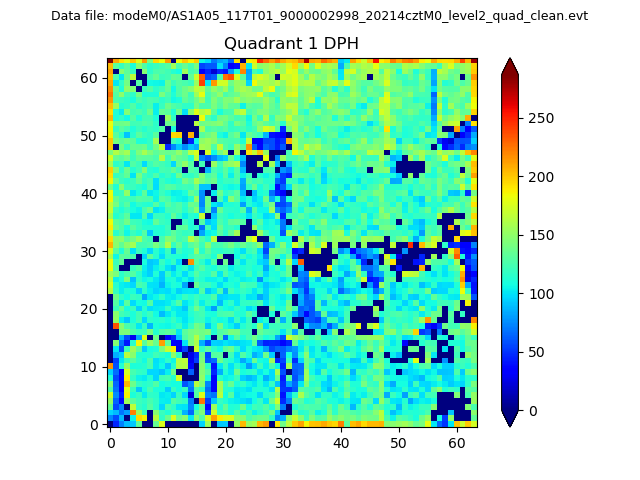 |
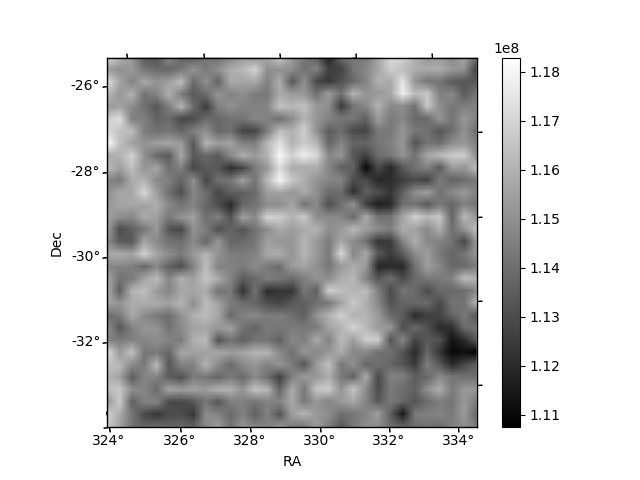
Quadrant B |
|---|---|---|---|
| Quadrant D | 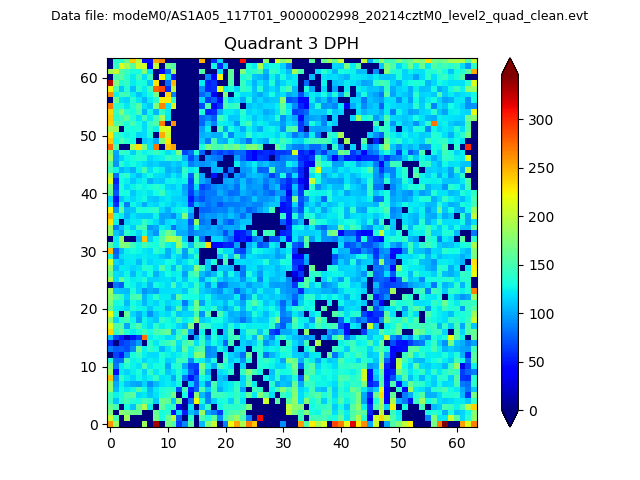 |
 |
Quadrant C |
| Plot type | Count rate plots | Images |
|---|---|---|
| Comparison with Poisson distribution Blue bars denote a histogram of data divided into 1 sec bins. Red curve is a Poisson curve with rate = median count rate of data. |
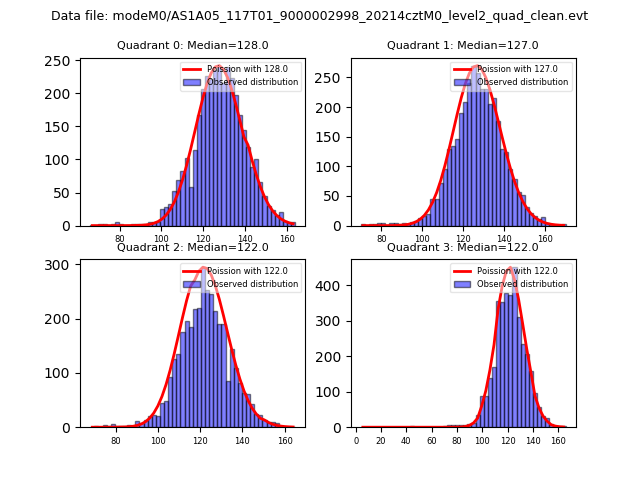 |
 |
| Quadrant-wise count rates Data is divided into 100 sec bins |
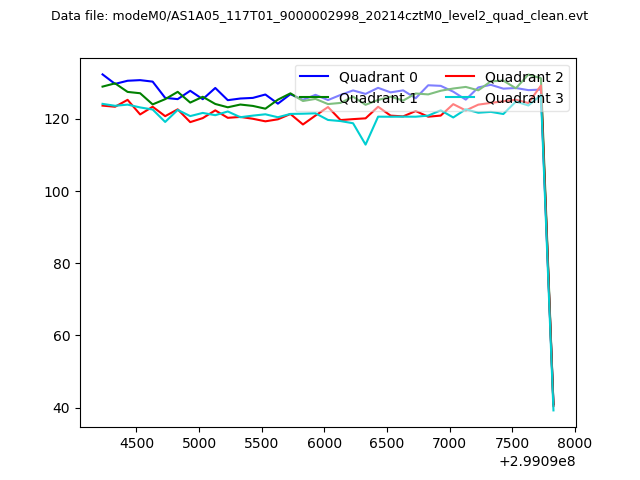 |
|
| Module-wise count rates for Quadrant A Data is divided into 100 sec bins |
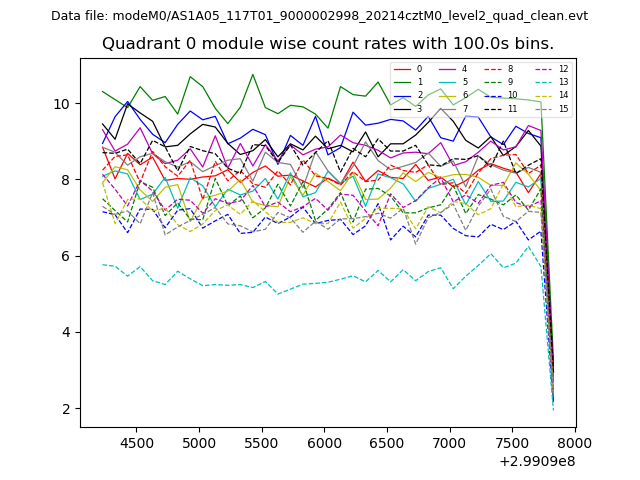 |
 |
| Module-wise count rates for Quadrant B Data is divided into 100 sec bins |
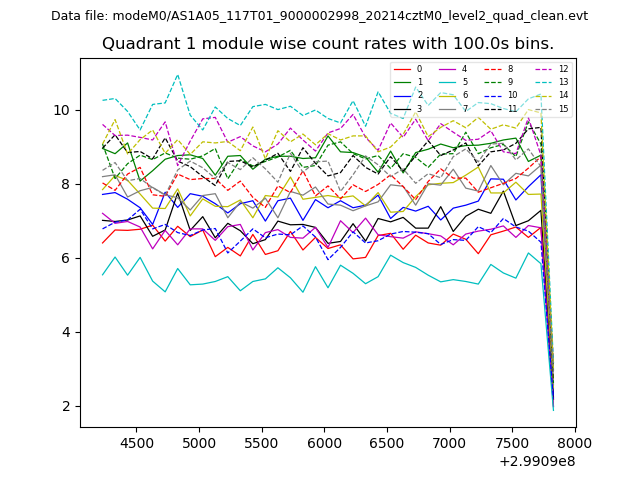 |
 |
| Module-wise count rates for Quadrant C Data is divided into 100 sec bins |
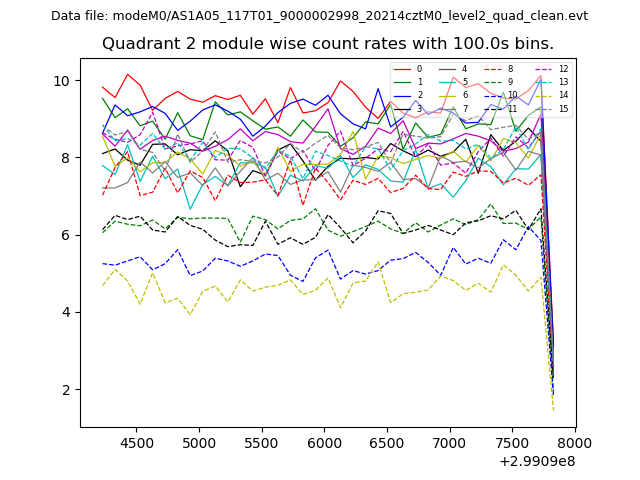 |
 |
| Module-wise count rates for Quadrant D Data is divided into 100 sec bins |
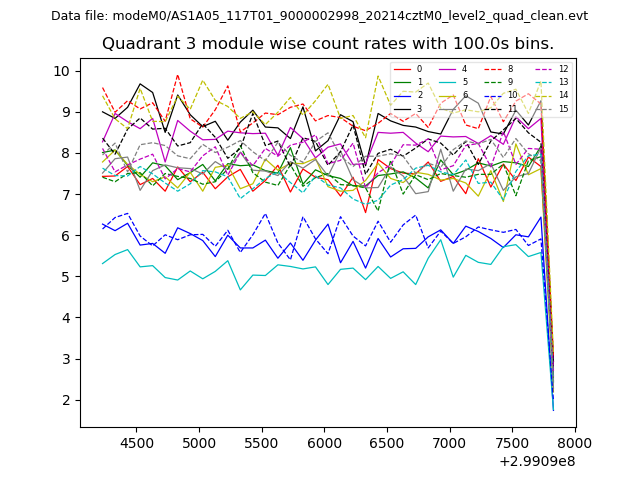 |
 |
| Parameter | Plot |
|---|---|
| CZT HV Monitor | 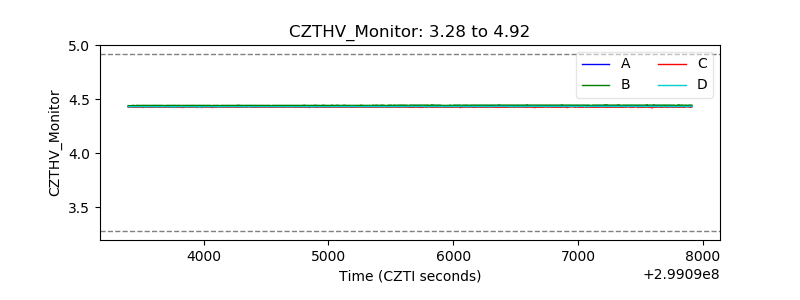 |
| D_VDD | 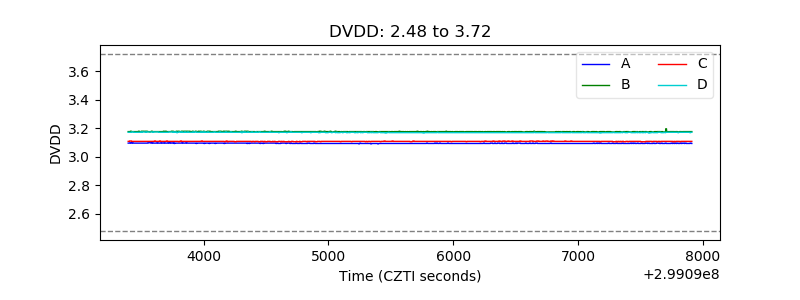 |
| Temperature 1 | 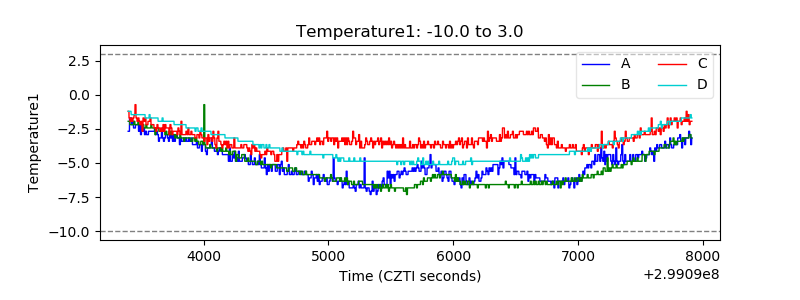 |
| Veto HV Monitor | 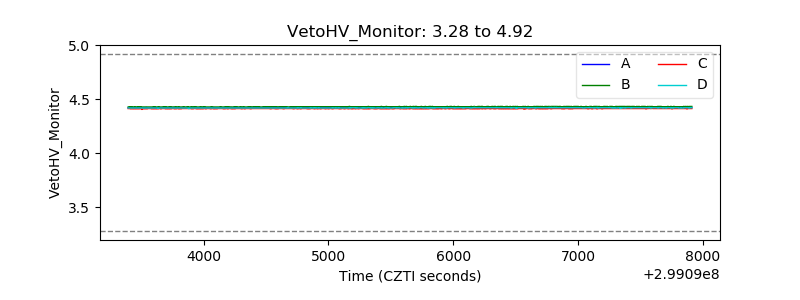 |
| Veto LLD | 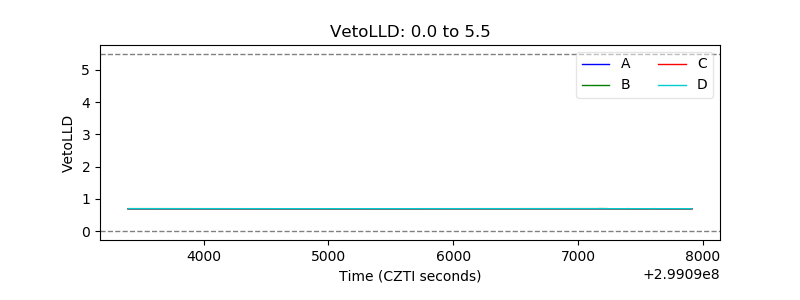 |
| Alpha Counter | 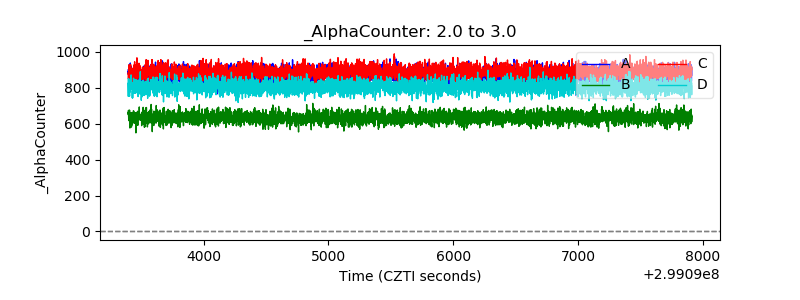 |
| _CPM_Rate | 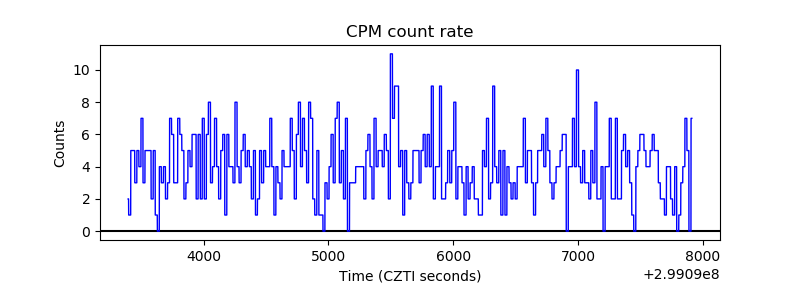 |
| CZT Counter | 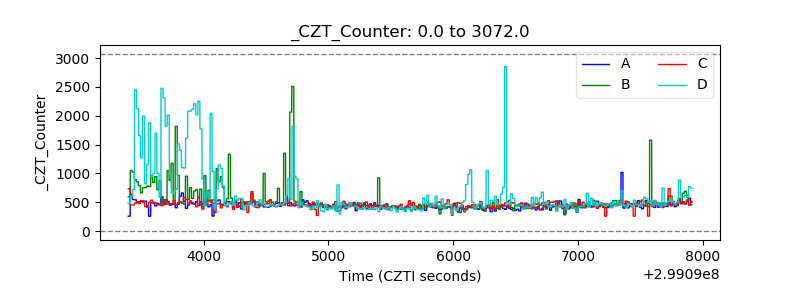 |
| +2.5 Volts monitor |  |
| +5 Volts monitor |  |
| _ROLL_ROT | 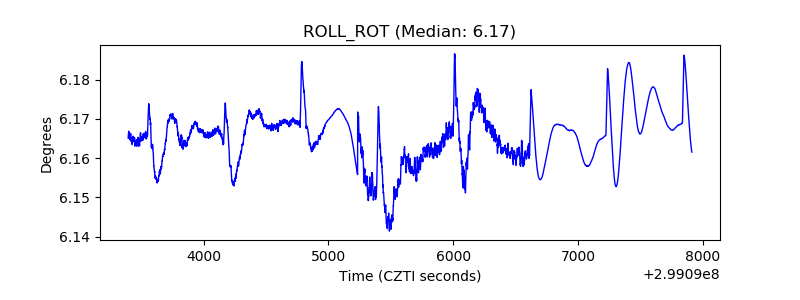 |
| _Roll_DEC | 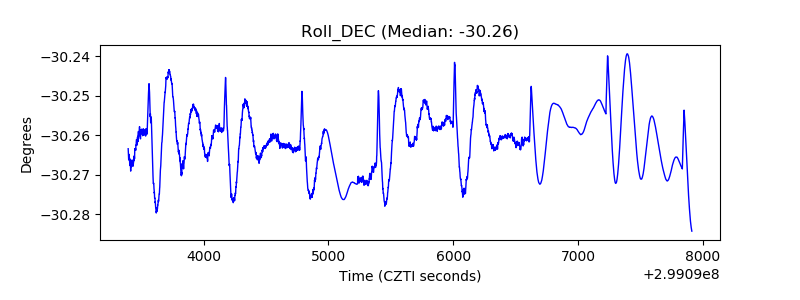 |
| _Roll_RA | 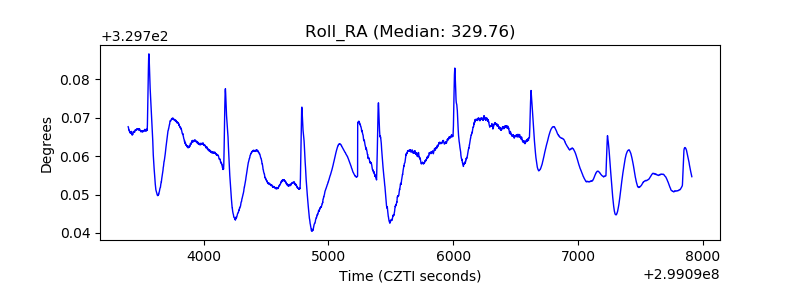 |
| Veto Counter | 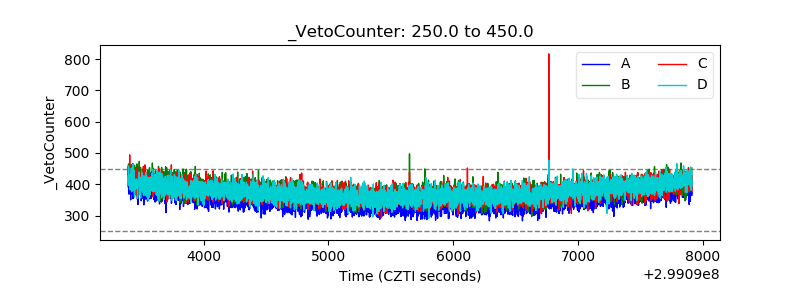 |