| Param | Original file | Final file |
|---|---|---|
| Filename | modeM0/AS1A05_117T01_9000002998_20216cztM0_level2.evt | modeM0/AS1A05_117T01_9000002998_20216cztM0_level2_quad_clean.evt |
| Size (bytes) | 478,753,920 | 94,066,560 |
| Size | 456.6 MB | 89.7 MB |
| Events in quadrant A | 3,173,146 | 609,723 |
| Events in quadrant B | 3,362,612 | 614,823 |
| Events in quadrant C | 3,292,258 | 593,917 |
| Events in quadrant D | 4,230,401 | 577,431 |
| Mode M0 | |||
|---|---|---|---|
| Quadrant | BADHDUFLAG | Total packets | Discarded packets |
| A | 0 | 13506 | 2 |
| B | 0 | 14122 | 2 |
| C | 0 | 13613 | 2 |
| D | 0 | 16960 | 2 |
| Mode SS | |||
|---|---|---|---|
| Quadrant | BADHDUFLAG | Total packets | Discarded packets |
| A | 0 | 134 | 0 |
| B | 0 | 134 | 0 |
| C | 0 | 134 | 0 |
| D | 0 | 134 | 0 |
| Mode M9 | |||
|---|---|---|---|
| Quadrant | BADHDUFLAG | Total packets | Discarded packets |
| A | 0 | 18 | 0 |
| B | 0 | 19 | 0 |
| C | 0 | 19 | 0 |
| D | 0 | 19 | 0 |
| Quadrant | Total seconds | Saturated seconds | Saturation percentage |
|---|---|---|---|
| A | 6492 | 28 | 0.431300% |
| B | 6492 | 58 | 0.893407% |
| C | 6492 | 62 | 0.955022% |
| D | 6492 | 167 | 2.572397% |
Noise dominated data is calculated using 1-second bins in cleaned event files. If a bin has >2000 counts, and if more than 50% of those come from <1% of pixels, then it is considered to be noise-dominated and hence unusable.
| Quadrant | # 1 sec bins | Bins with >0 counts | Bins with >2000 counts | High rate bins dominated by noise | Noise dominated (total time) | Noise dominated (detector-on time) | Marked lightcurve |
|---|---|---|---|---|---|---|---|
| A | 7517 | 6493 | 7 | 7 | 0.09% | 0.11% | 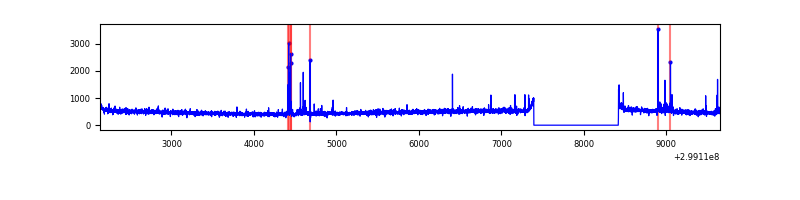 |
| B | 7517 | 6493 | 10 | 10 | 0.13% | 0.15% | 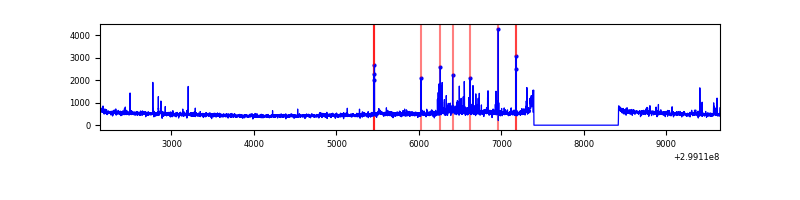 |
| C | 7517 | 6493 | 0 | 0 | 0.00% | 0.00% | 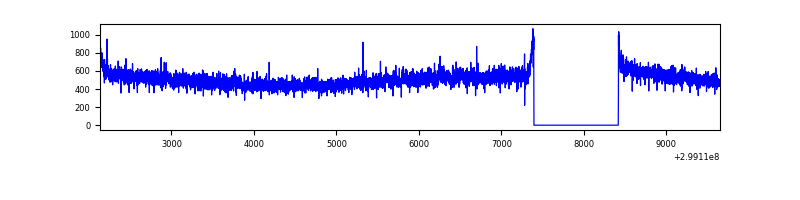 |
| D | 7517 | 6493 | 130 | 130 | 1.73% | 2.00% | 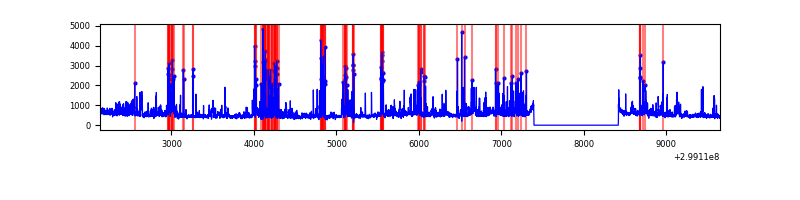 |
Top three noisy pixels from each quadrant. If the there are fewer than three noisy pixels in the level2.evt file, extra rows are filled as -1
| Pixel properties | Quadrant properties | ||||||
|---|---|---|---|---|---|---|---|
| Quadrant | DetID | PixID | Counts | Sigma | Mean | Median | Sigma |
| A | 14 | 238 | 45554 | 274.75 | 802 | 785 | 162.9 |
| A | 4 | 2 | 24149 | 143.39 | 802 | 785 | 162.9 |
| A | 13 | 252 | 11672 | 66.81 | 802 | 785 | 162.9 |
| B | 7 | 220 | 102066 | 659.56 | 800 | 779 | 153.6 |
| B | 10 | 245 | 39915 | 254.85 | 800 | 779 | 153.6 |
| B | 0 | 198 | 20910 | 131.09 | 800 | 779 | 153.6 |
| C | 14 | 238 | 121604 | 657.07 | 780 | 786 | 183.9 |
| C | 3 | 233 | 112629 | 608.26 | 780 | 786 | 183.9 |
| C | 1 | 16 | 16418 | 85.02 | 780 | 786 | 183.9 |
| D | 1 | 52 | 1124653 | 5899.42 | 781 | 757 | 190.5 |
| D | 7 | 238 | 36604 | 188.16 | 781 | 757 | 190.5 |
| D | 7 | 38 | 35180 | 180.69 | 781 | 757 | 190.5 |
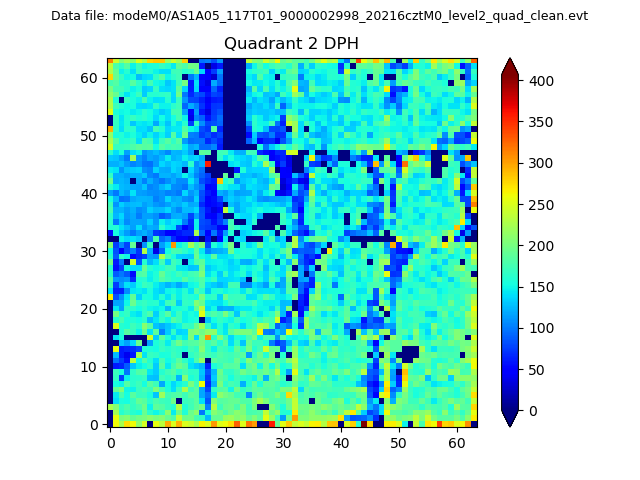
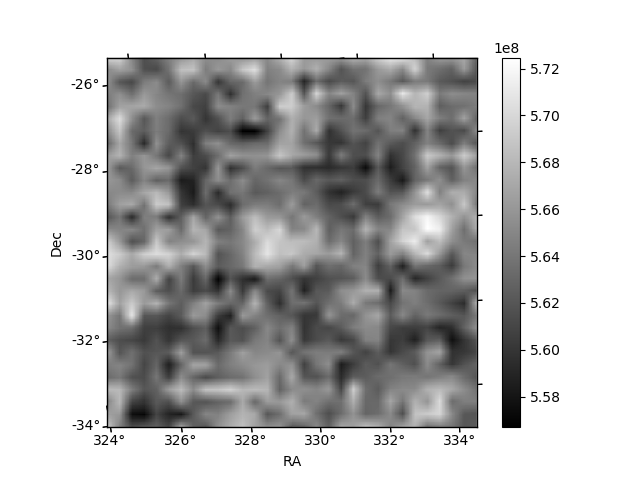
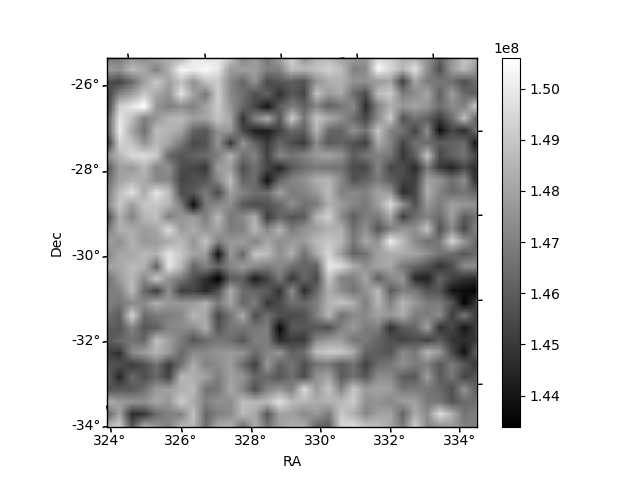
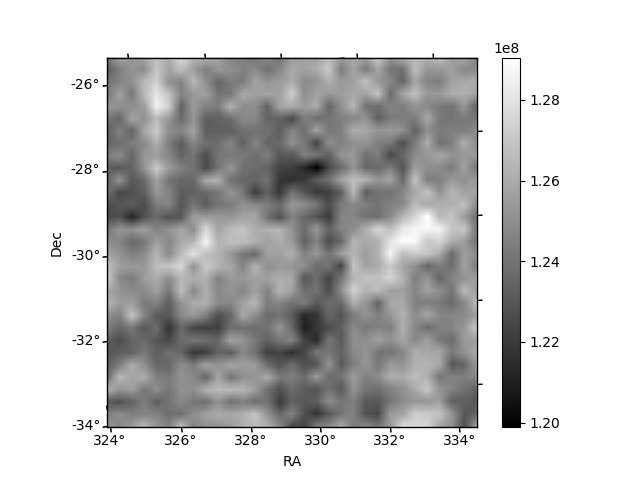
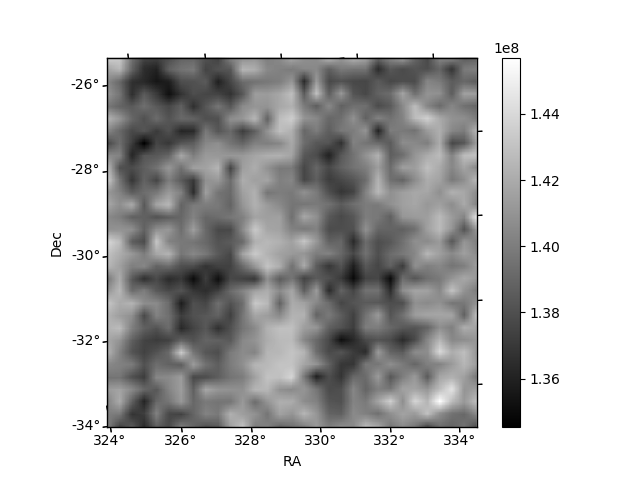
Histogram calculated using DETX and DETY for each event in the final _common_clean file
| Quadrant A | 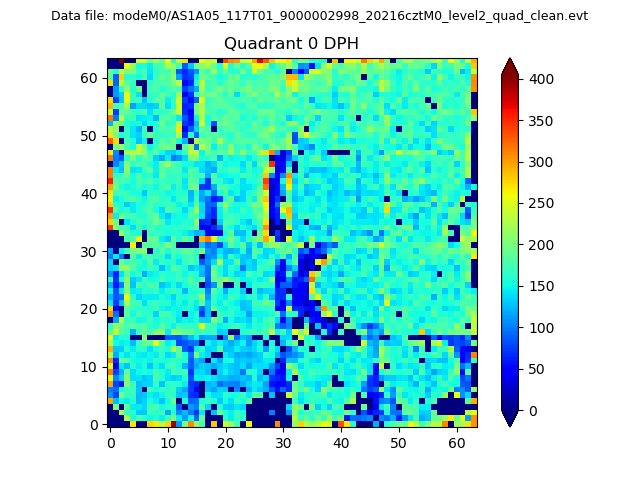 |
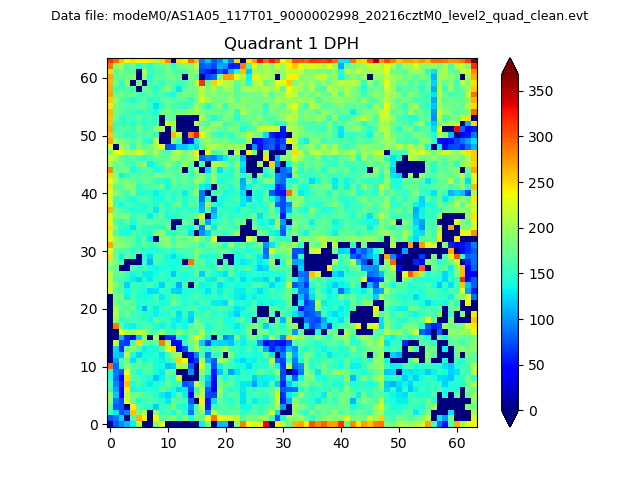 |
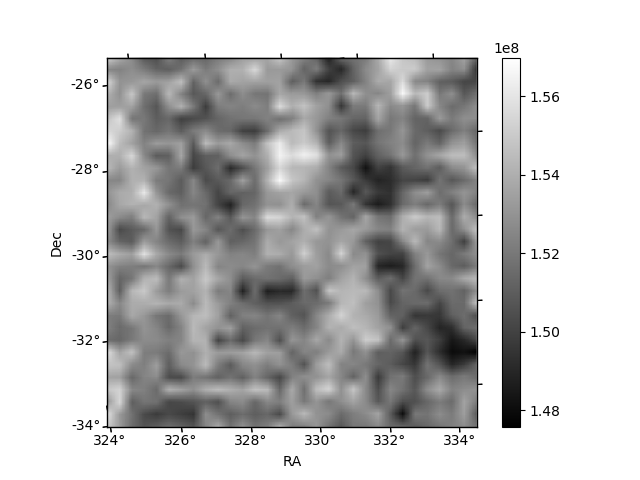
Quadrant B |
|---|---|---|---|
| Quadrant D | 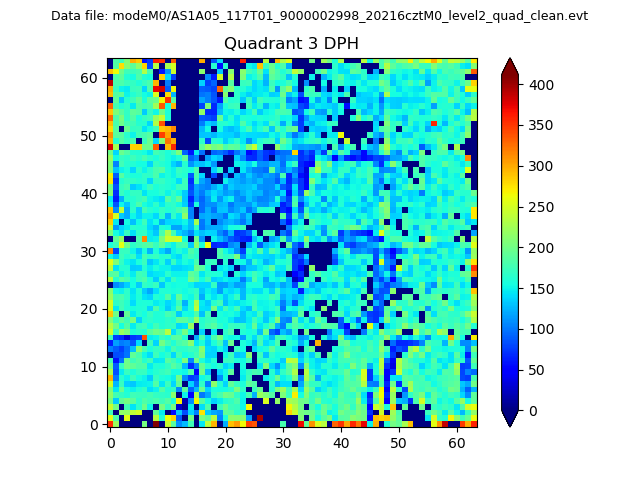 |
 |
Quadrant C |
| Plot type | Count rate plots | Images |
|---|---|---|
| Comparison with Poisson distribution Blue bars denote a histogram of data divided into 1 sec bins. Red curve is a Poisson curve with rate = median count rate of data. |
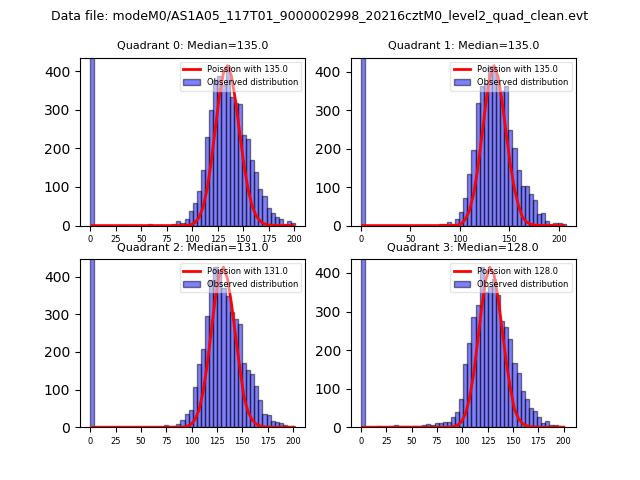 |
 |
| Quadrant-wise count rates Data is divided into 100 sec bins |
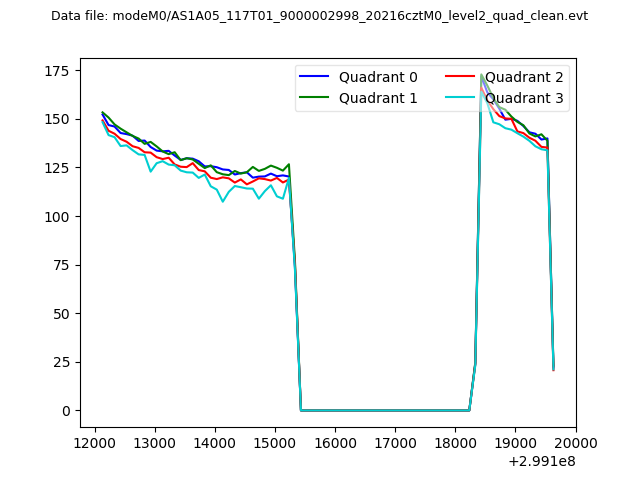 |
|
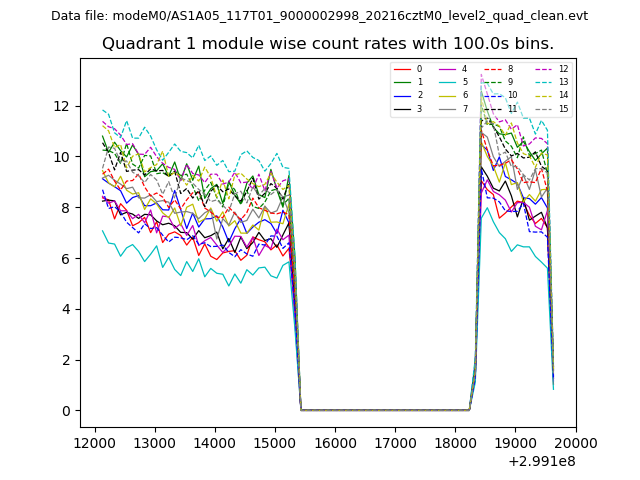
| Module-wise count rates for Quadrant A Data is divided into 100 sec bins |
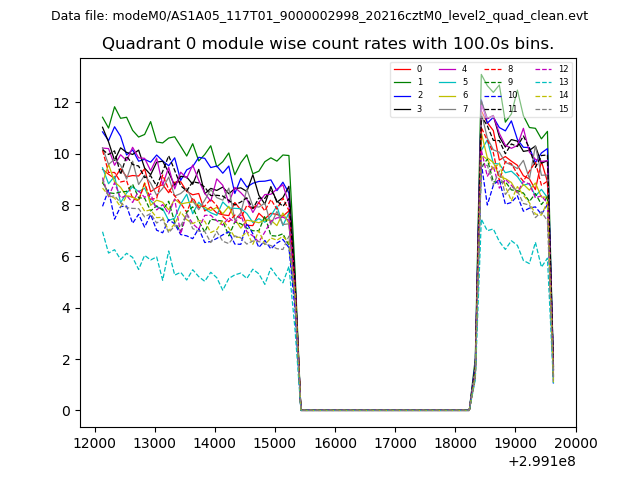 |
 |
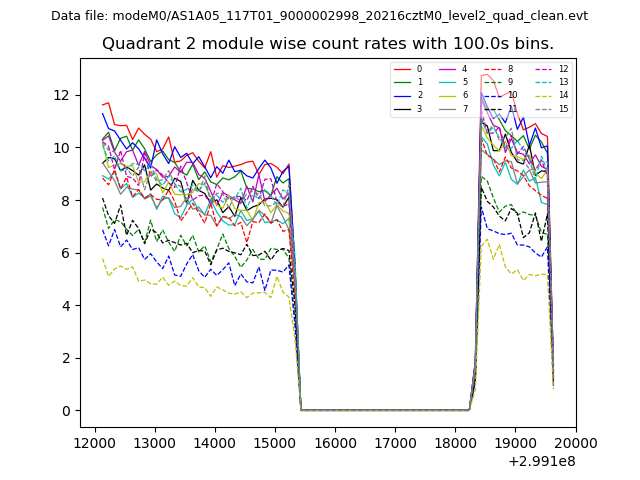
| Module-wise count rates for Quadrant B Data is divided into 100 sec bins |
 |
 |
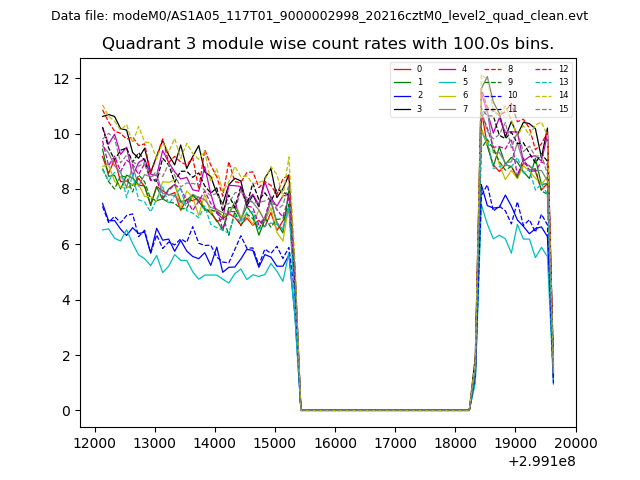
| Module-wise count rates for Quadrant C Data is divided into 100 sec bins |
 |
 |
| Module-wise count rates for Quadrant D Data is divided into 100 sec bins |
 |
 |
| Parameter | Plot |
|---|---|
| CZT HV Monitor | 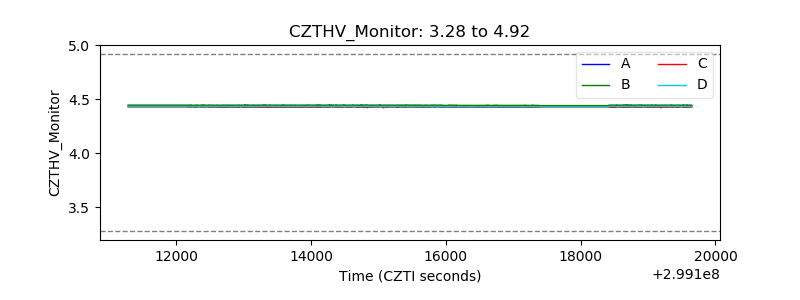 |
| D_VDD | 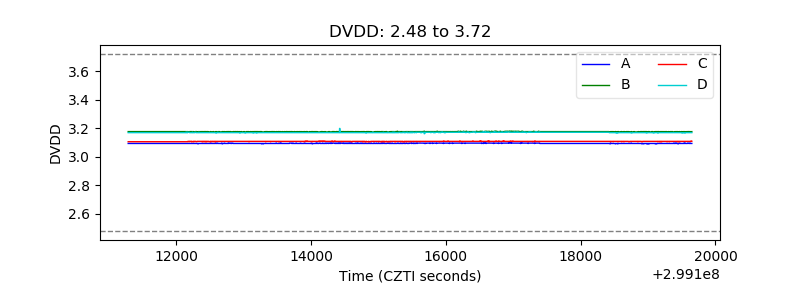 |
| Temperature 1 | 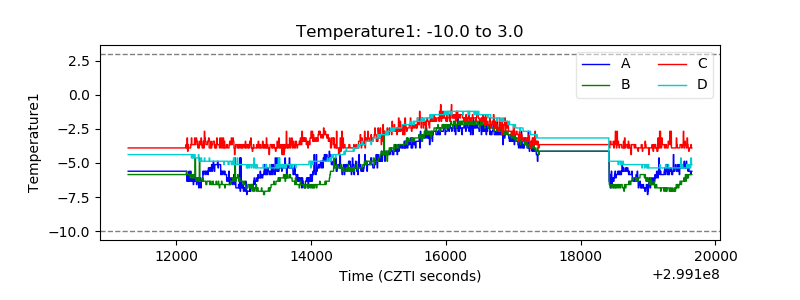 |
| Veto HV Monitor | 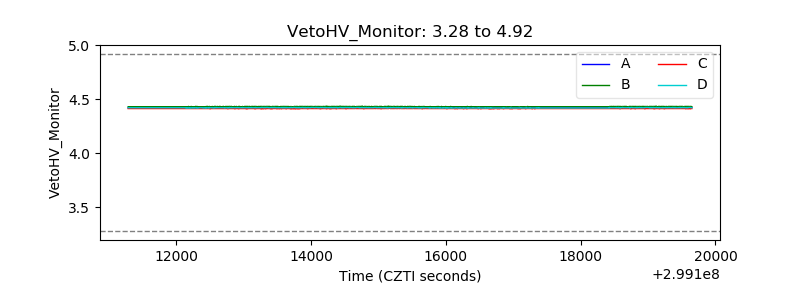 |
| Veto LLD | 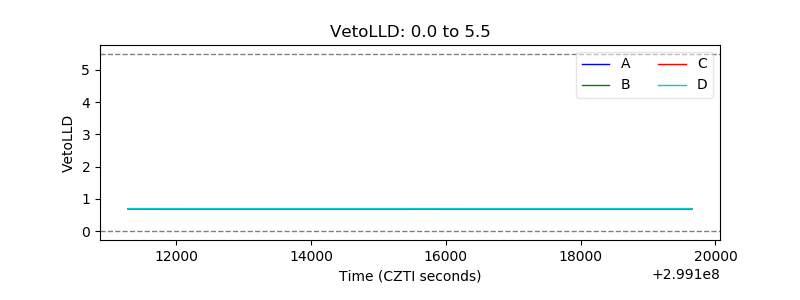 |
| Alpha Counter | 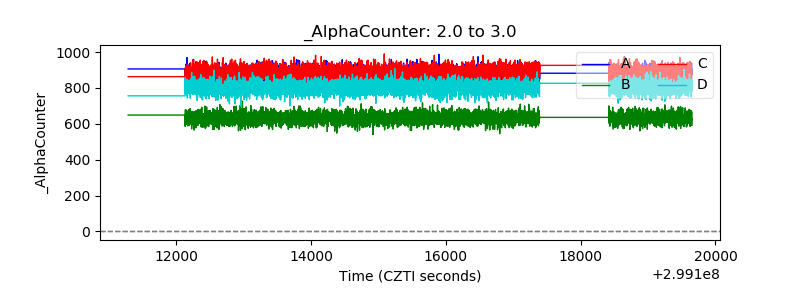 |
| _CPM_Rate | 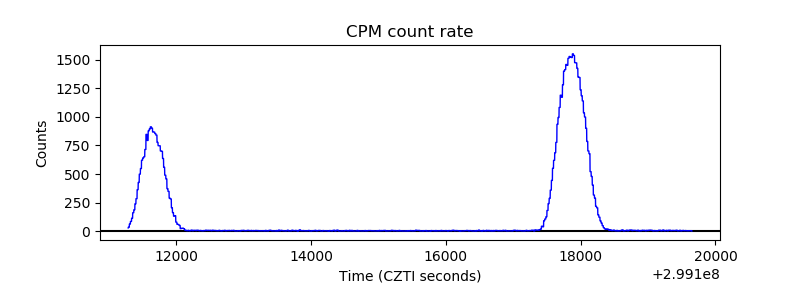 |
| CZT Counter | 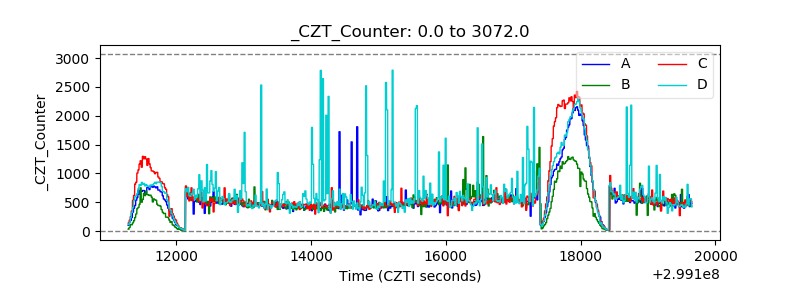 |
| +2.5 Volts monitor |  |
| +5 Volts monitor |  |
| _ROLL_ROT | 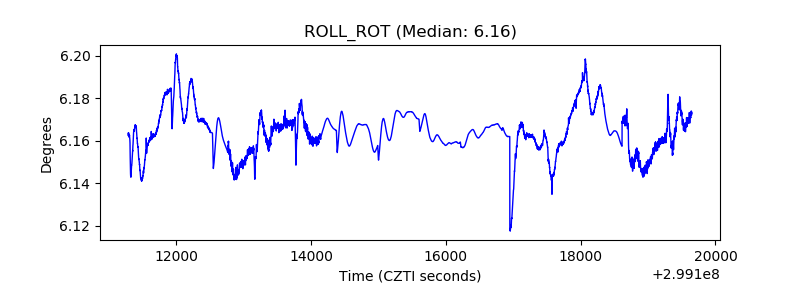 |
| _Roll_DEC |  |
| _Roll_RA | 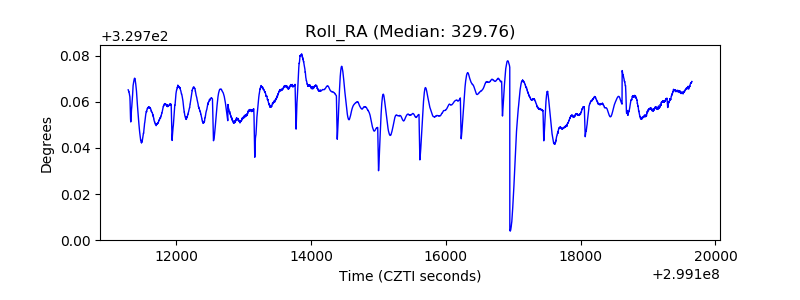 |
| Veto Counter | 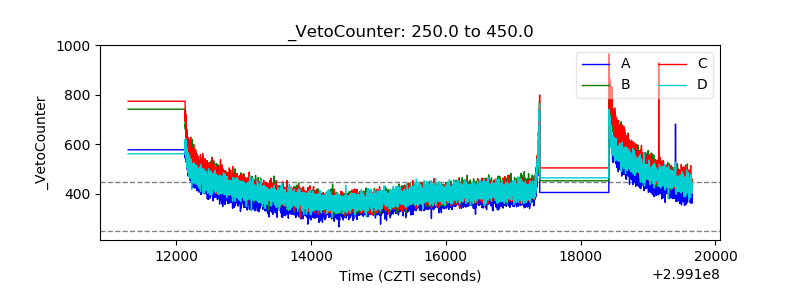 |