| Param | Original file | Final file |
|---|---|---|
| Filename | modeM0/AS1A05_117T01_9000002998_20218cztM0_level2.evt | modeM0/AS1A05_117T01_9000002998_20218cztM0_level2_quad_clean.evt |
| Size (bytes) | 516,677,760 | 95,636,160 |
| Size | 492.7 MB | 91.2 MB |
| Events in quadrant A | 3,299,094 | 621,821 |
| Events in quadrant B | 3,900,774 | 625,876 |
| Events in quadrant C | 3,437,358 | 605,422 |
| Events in quadrant D | 4,571,544 | 591,847 |
| Mode M0 | |||
|---|---|---|---|
| Quadrant | BADHDUFLAG | Total packets | Discarded packets |
| A | 0 | 13782 | 1 |
| B | 0 | 15545 | 1 |
| C | 0 | 14099 | 1 |
| D | 0 | 17794 | 1 |
| Mode SS | |||
|---|---|---|---|
| Quadrant | BADHDUFLAG | Total packets | Discarded packets |
| A | 0 | 130 | 0 |
| B | 0 | 130 | 0 |
| C | 0 | 130 | 0 |
| D | 0 | 130 | 0 |
| Mode M9 | |||
|---|---|---|---|
| Quadrant | BADHDUFLAG | Total packets | Discarded packets |
| A | 0 | 19 | 0 |
| B | 0 | 20 | 0 |
| C | 0 | 20 | 0 |
| D | 0 | 20 | 0 |
| Quadrant | Total seconds | Saturated seconds | Saturation percentage |
|---|---|---|---|
| A | 6474 | 59 | 0.911338% |
| B | 6474 | 184 | 2.842138% |
| C | 6474 | 81 | 1.251158% |
| D | 6474 | 292 | 4.510349% |
Noise dominated data is calculated using 1-second bins in cleaned event files. If a bin has >2000 counts, and if more than 50% of those come from <1% of pixels, then it is considered to be noise-dominated and hence unusable.
| Quadrant | # 1 sec bins | Bins with >0 counts | Bins with >2000 counts | High rate bins dominated by noise | Noise dominated (total time) | Noise dominated (detector-on time) | Marked lightcurve |
|---|---|---|---|---|---|---|---|
| A | 7604 | 6475 | 19 | 19 | 0.25% | 0.29% | 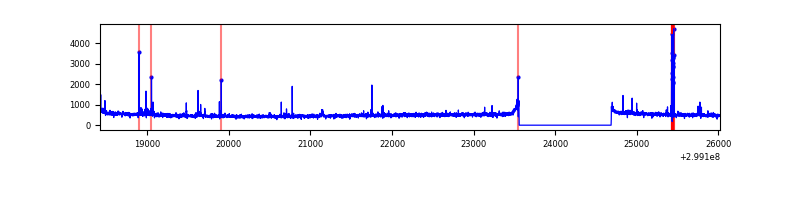 |
| B | 7604 | 6475 | 64 | 64 | 0.84% | 0.99% | 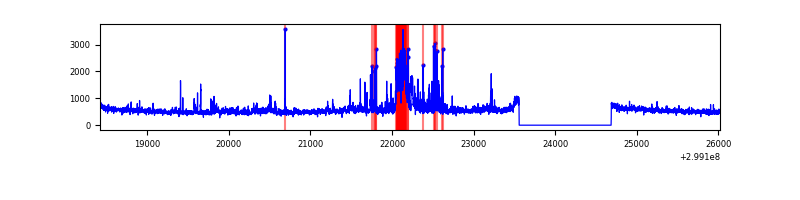 |
| C | 7604 | 6475 | 0 | 0 | 0.00% | 0.00% | 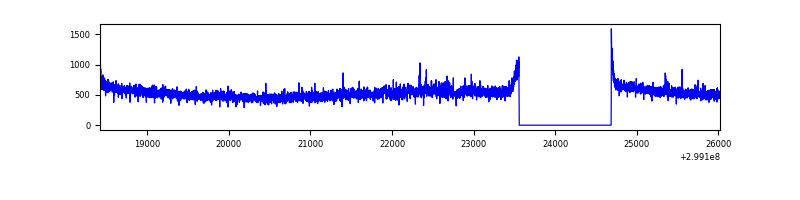 |
| D | 7604 | 6475 | 191 | 191 | 2.51% | 2.95% | 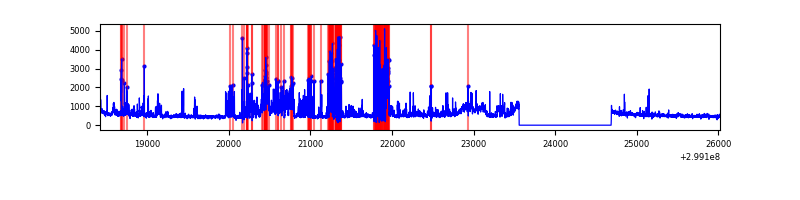 |
Top three noisy pixels from each quadrant. If the there are fewer than three noisy pixels in the level2.evt file, extra rows are filled as -1
| Pixel properties | Quadrant properties | ||||||
|---|---|---|---|---|---|---|---|
| Quadrant | DetID | PixID | Counts | Sigma | Mean | Median | Sigma |
| A | 4 | 2 | 99801 | 602.62 | 825 | 809 | 164.3 |
| A | 14 | 238 | 22333 | 131.03 | 825 | 809 | 164.3 |
| A | 0 | 226 | 7111 | 38.36 | 825 | 809 | 164.3 |
| B | 10 | 245 | 390486 | 2479.55 | 817 | 795 | 157.2 |
| B | 15 | 32 | 134405 | 850.14 | 817 | 795 | 157.2 |
| B | 7 | 220 | 88454 | 557.76 | 817 | 795 | 157.2 |
| C | 3 | 233 | 151990 | 807.15 | 801 | 810 | 187.3 |
| C | 14 | 238 | 125309 | 664.7 | 801 | 810 | 187.3 |
| C | 3 | 9 | 17010 | 86.49 | 801 | 810 | 187.3 |
| D | 1 | 52 | 1330783 | 6984.4 | 795 | 774 | 190.4 |
| D | 7 | 38 | 139491 | 728.46 | 795 | 774 | 190.4 |
| D | 2 | 234 | 30119 | 154.1 | 795 | 774 | 190.4 |
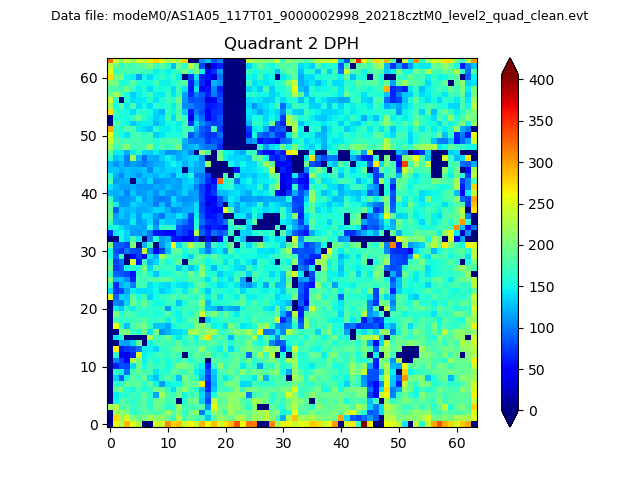
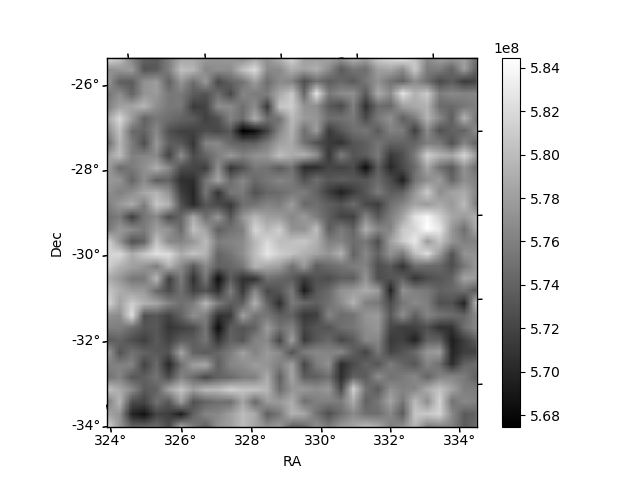
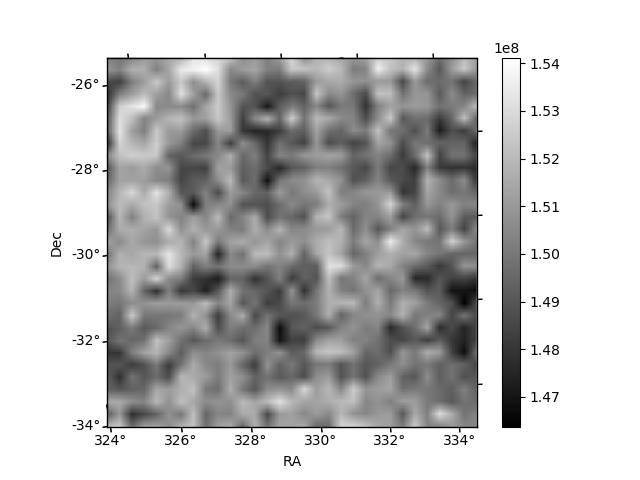
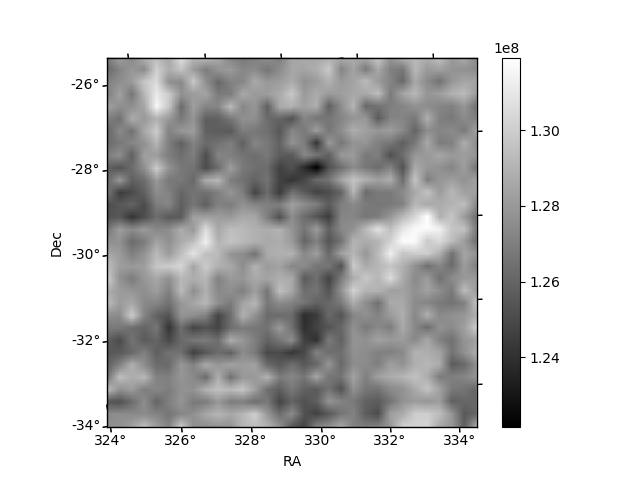
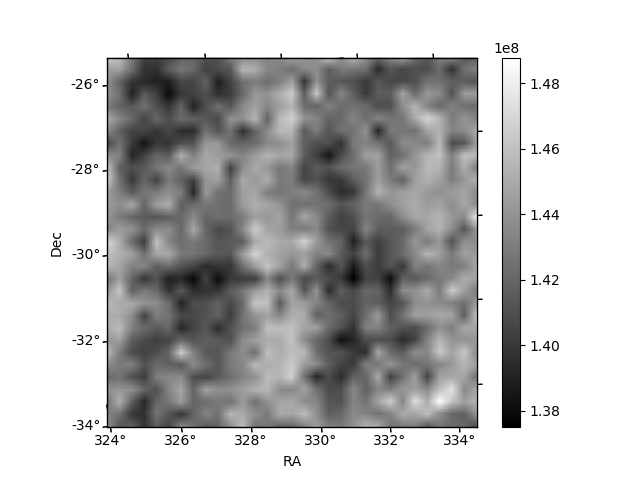
Histogram calculated using DETX and DETY for each event in the final _common_clean file
| Quadrant A | 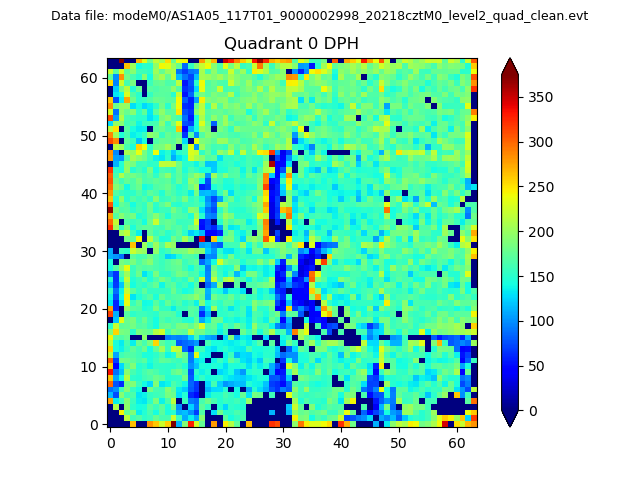 |
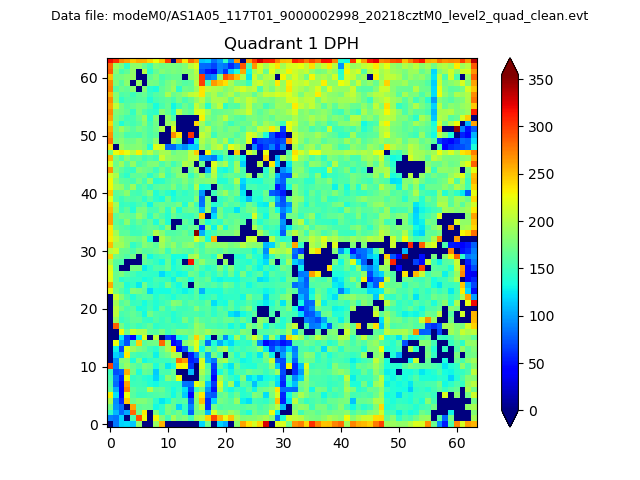 |
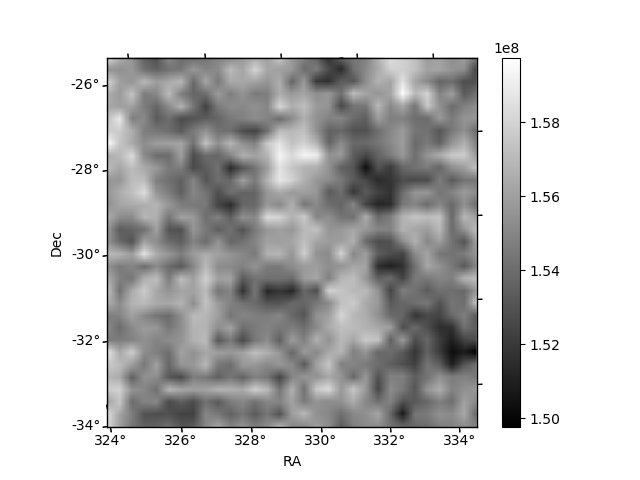
Quadrant B |
|---|---|---|---|
| Quadrant D | 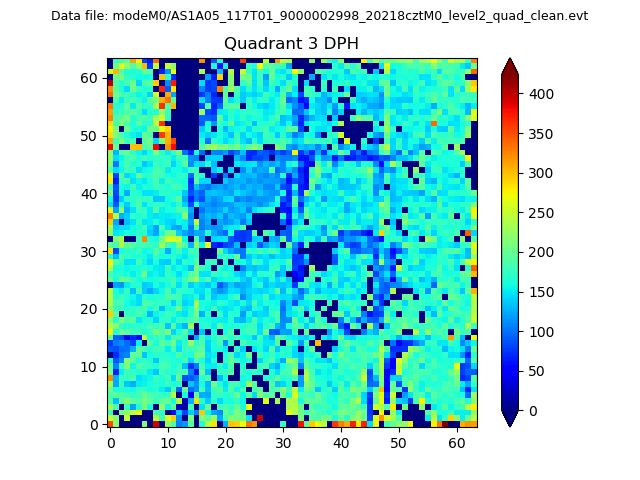 |
 |
Quadrant C |
| Plot type | Count rate plots | Images |
|---|---|---|
| Comparison with Poisson distribution Blue bars denote a histogram of data divided into 1 sec bins. Red curve is a Poisson curve with rate = median count rate of data. |
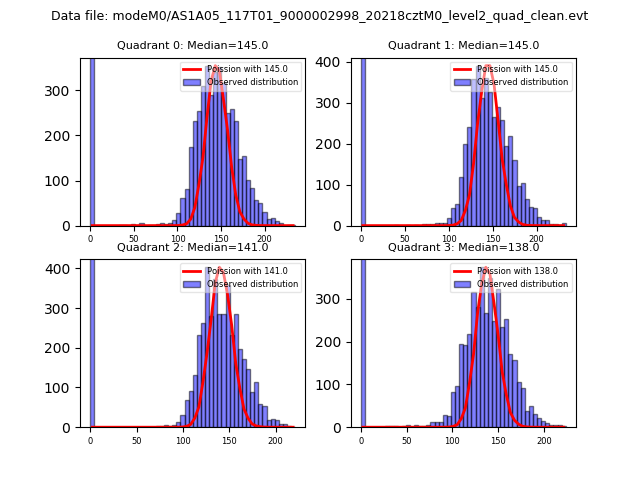 |
 |
| Quadrant-wise count rates Data is divided into 100 sec bins |
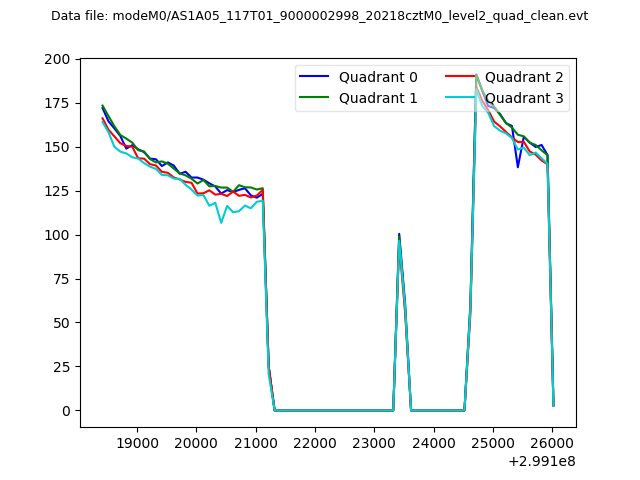 |
|
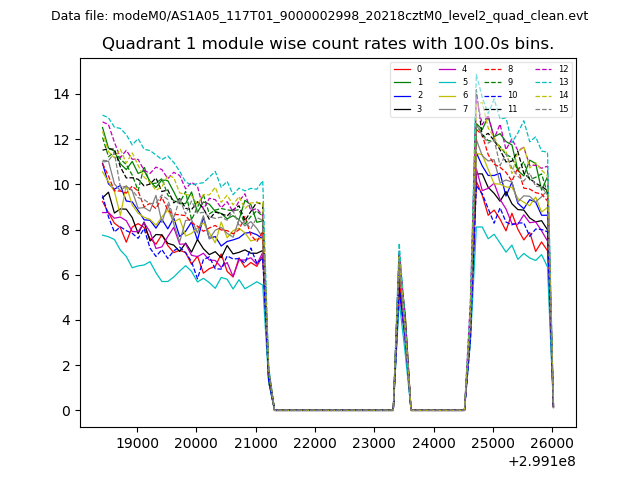
| Module-wise count rates for Quadrant A Data is divided into 100 sec bins |
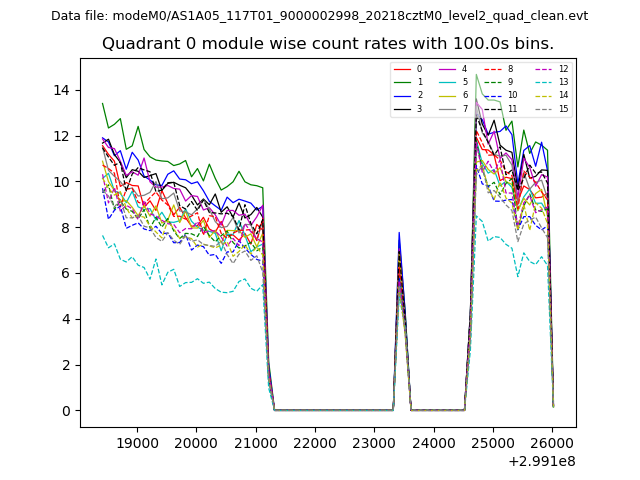 |
 |
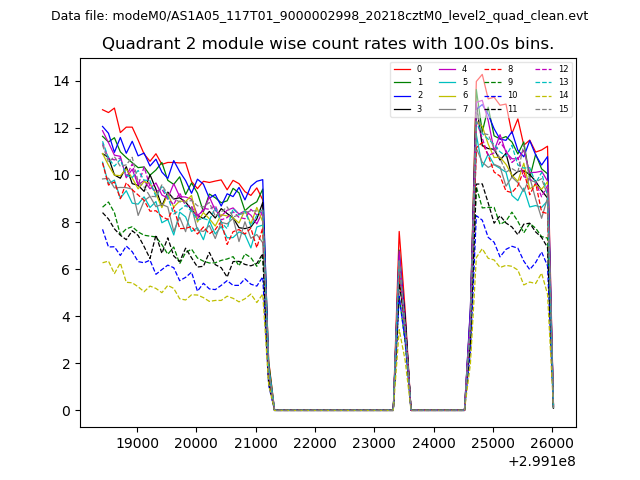
| Module-wise count rates for Quadrant B Data is divided into 100 sec bins |
 |
 |
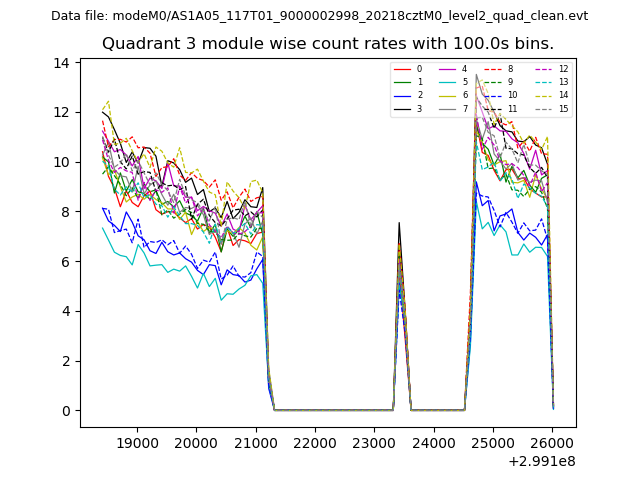
| Module-wise count rates for Quadrant C Data is divided into 100 sec bins |
 |
 |
| Module-wise count rates for Quadrant D Data is divided into 100 sec bins |
 |
 |
| Parameter | Plot |
|---|---|
| CZT HV Monitor | 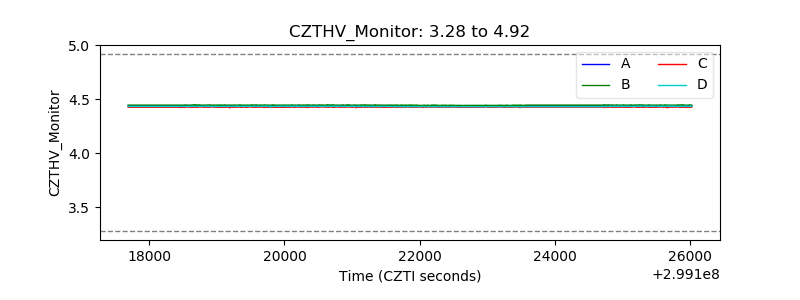 |
| D_VDD | 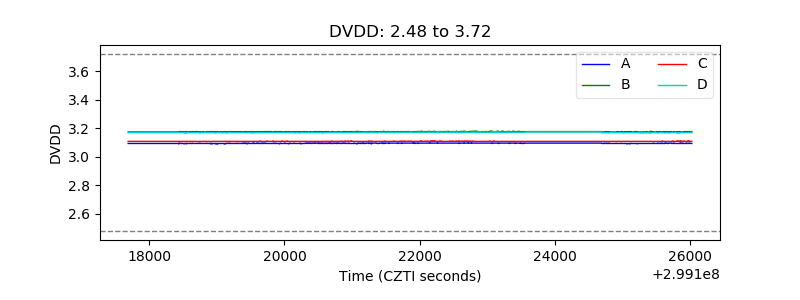 |
| Temperature 1 | 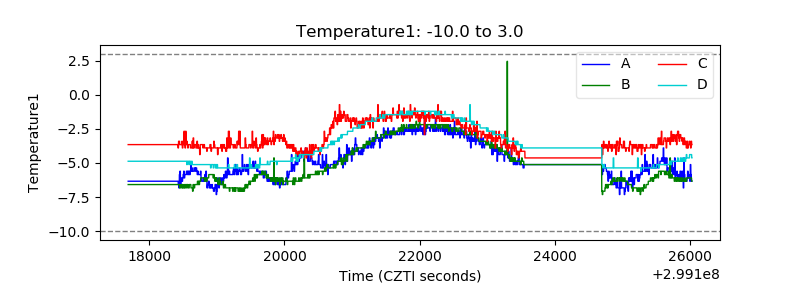 |
| Veto HV Monitor | 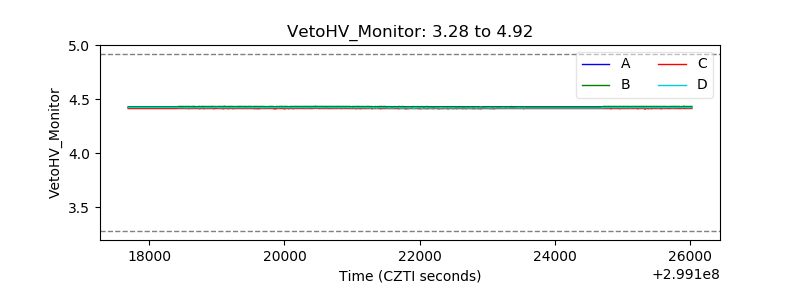 |
| Veto LLD | 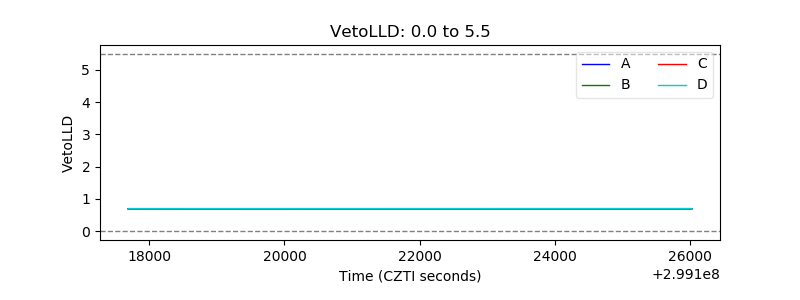 |
| Alpha Counter | 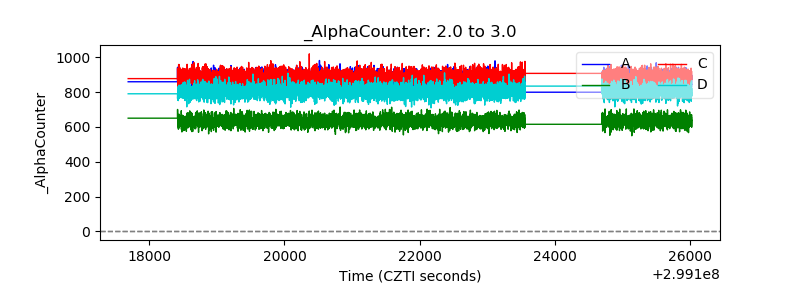 |
| _CPM_Rate | 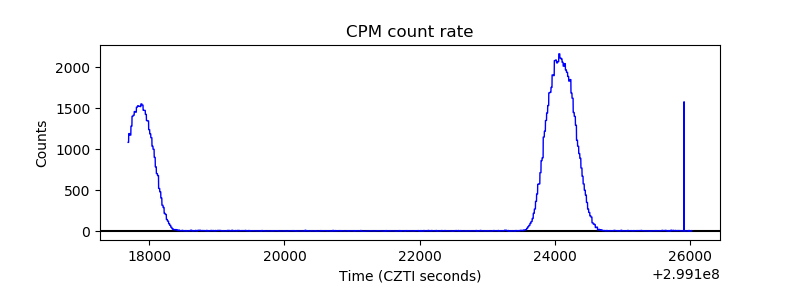 |
| CZT Counter | 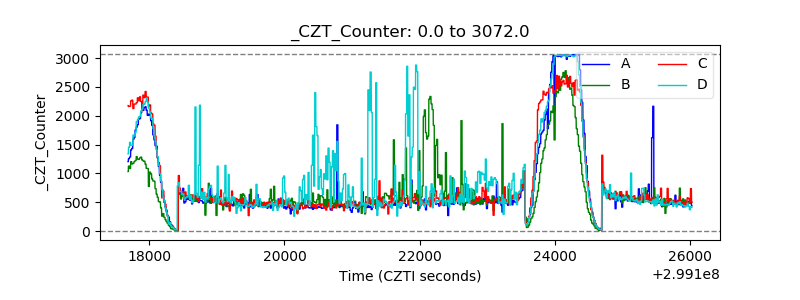 |
| +2.5 Volts monitor | 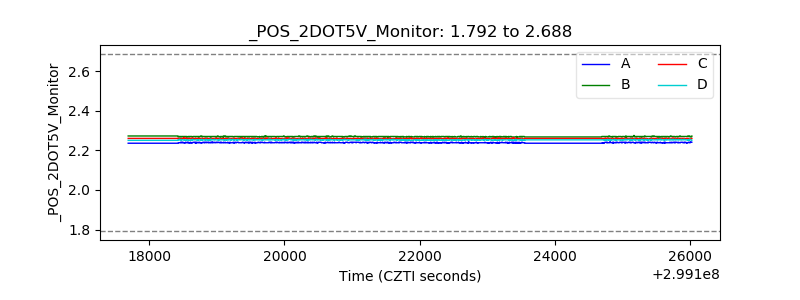 |
| +5 Volts monitor |  |
| _ROLL_ROT | 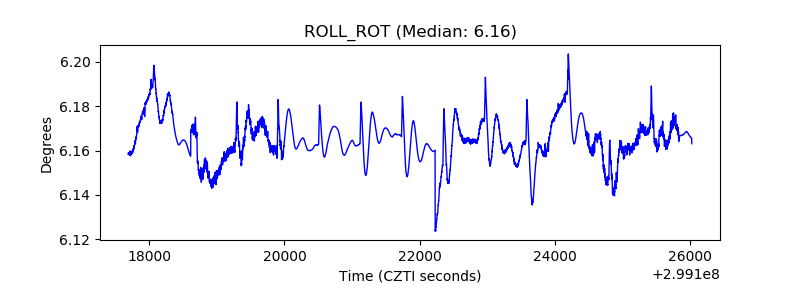 |
| _Roll_DEC | 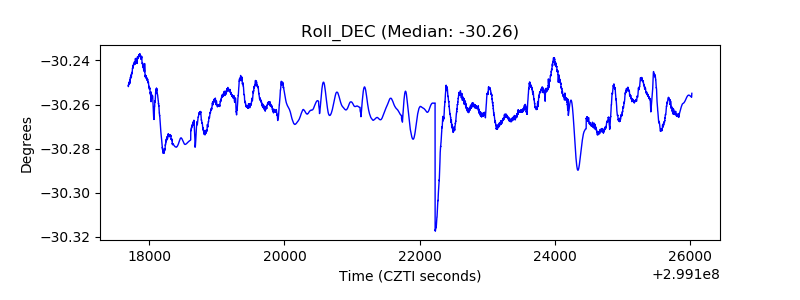 |
| _Roll_RA | 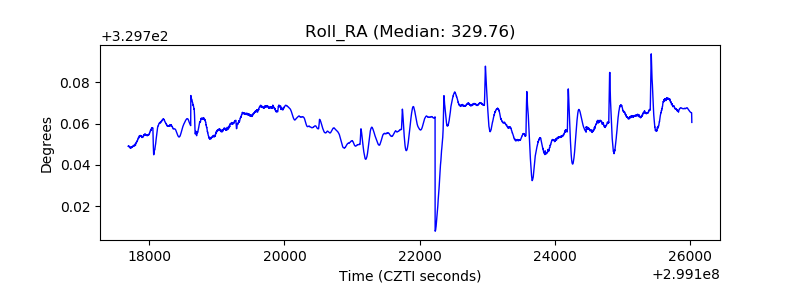 |
| Veto Counter | 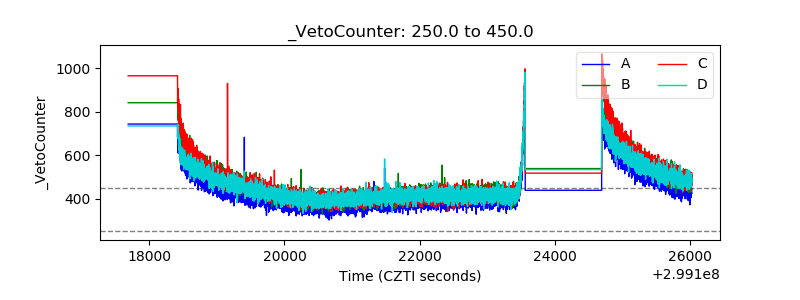 |