| Param | Original file | Final file |
|---|---|---|
| Filename | modeM0/AS1A05_117T01_9000002998_20219cztM0_level2.evt | modeM0/AS1A05_117T01_9000002998_20219cztM0_level2_quad_clean.evt |
| Size (bytes) | 503,326,080 | 109,589,760 |
| Size | 480.0 MB | 104.5 MB |
| Events in quadrant A | 3,570,038 | 724,290 |
| Events in quadrant B | 3,658,493 | 730,536 |
| Events in quadrant C | 3,691,363 | 699,548 |
| Events in quadrant D | 3,860,678 | 689,371 |
| Mode M0 | |||
|---|---|---|---|
| Quadrant | BADHDUFLAG | Total packets | Discarded packets |
| A | 0 | 14664 | 1 |
| B | 0 | 14983 | 1 |
| C | 0 | 14940 | 1 |
| D | 0 | 15592 | 1 |
| Mode SS | |||
|---|---|---|---|
| Quadrant | BADHDUFLAG | Total packets | Discarded packets |
| A | 0 | 138 | 0 |
| B | 0 | 138 | 0 |
| C | 0 | 138 | 0 |
| D | 0 | 138 | 0 |
| Mode M9 | |||
|---|---|---|---|
| Quadrant | BADHDUFLAG | Total packets | Discarded packets |
| A | 0 | 21 | 0 |
| B | 0 | 22 | 0 |
| C | 0 | 22 | 0 |
| D | 0 | 22 | 0 |
| Quadrant | Total seconds | Saturated seconds | Saturation percentage |
|---|---|---|---|
| A | 6822 | 74 | 1.084726% |
| B | 6822 | 60 | 0.879507% |
| C | 6822 | 92 | 1.348578% |
| D | 6821 | 77 | 1.128867% |
Noise dominated data is calculated using 1-second bins in cleaned event files. If a bin has >2000 counts, and if more than 50% of those come from <1% of pixels, then it is considered to be noise-dominated and hence unusable.
| Quadrant | # 1 sec bins | Bins with >0 counts | Bins with >2000 counts | High rate bins dominated by noise | Noise dominated (total time) | Noise dominated (detector-on time) | Marked lightcurve |
|---|---|---|---|---|---|---|---|
| A | 8032 | 6823 | 16 | 16 | 0.20% | 0.23% | 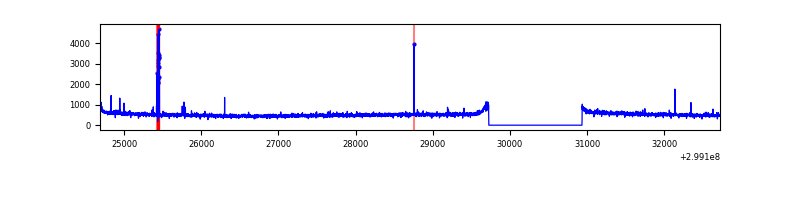 |
| B | 8032 | 6823 | 3 | 3 | 0.04% | 0.04% | 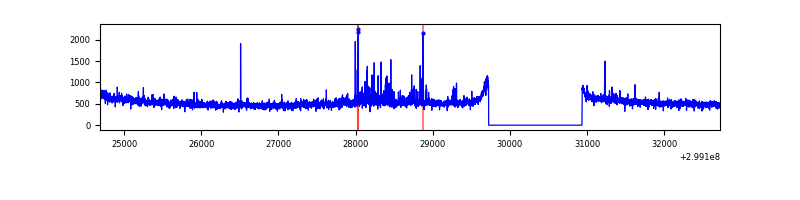 |
| C | 8032 | 6823 | 0 | 0 | 0.00% | 0.00% | 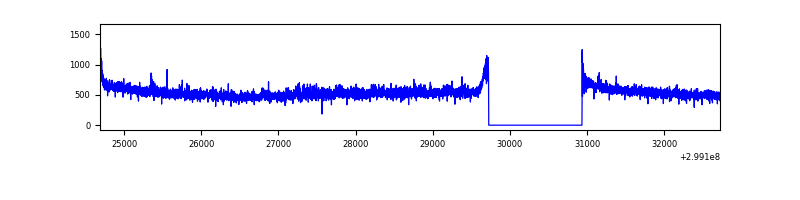 |
| D | 8031 | 6822 | 32 | 32 | 0.40% | 0.47% | 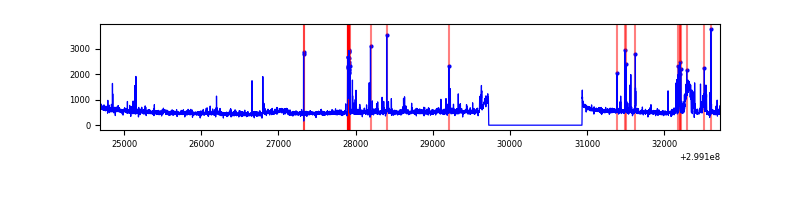 |
Top three noisy pixels from each quadrant. If the there are fewer than three noisy pixels in the level2.evt file, extra rows are filled as -1
| Pixel properties | Quadrant properties | ||||||
|---|---|---|---|---|---|---|---|
| Quadrant | DetID | PixID | Counts | Sigma | Mean | Median | Sigma |
| A | 4 | 2 | 68555 | 373.95 | 906 | 890 | 180.9 |
| A | 14 | 238 | 16288 | 85.1 | 906 | 890 | 180.9 |
| A | 0 | 226 | 7828 | 38.34 | 906 | 890 | 180.9 |
| B | 7 | 220 | 58001 | 338.7 | 892 | 870 | 168.7 |
| B | 0 | 229 | 33684 | 194.54 | 892 | 870 | 168.7 |
| B | 0 | 198 | 31556 | 181.92 | 892 | 870 | 168.7 |
| C | 3 | 233 | 140756 | 688.08 | 871 | 880 | 203.3 |
| C | 14 | 238 | 136727 | 668.26 | 871 | 880 | 203.3 |
| C | 1 | 16 | 8564 | 37.8 | 871 | 880 | 203.3 |
| D | 1 | 52 | 186372 | 855.26 | 891 | 869 | 216.9 |
| D | 9 | 85 | 135774 | 621.97 | 891 | 869 | 216.9 |
| D | 11 | 176 | 61854 | 281.17 | 891 | 869 | 216.9 |
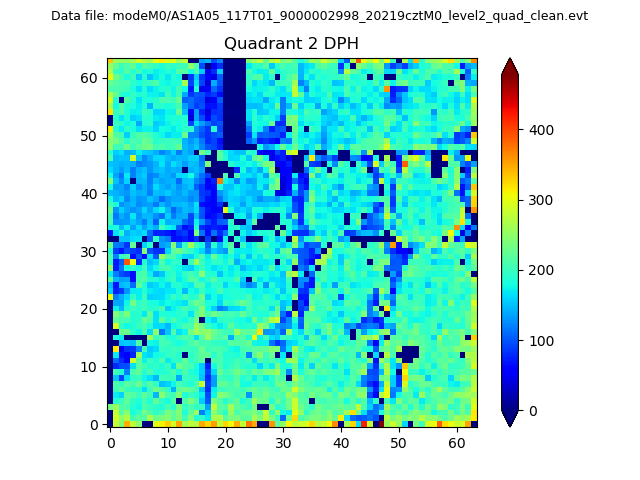
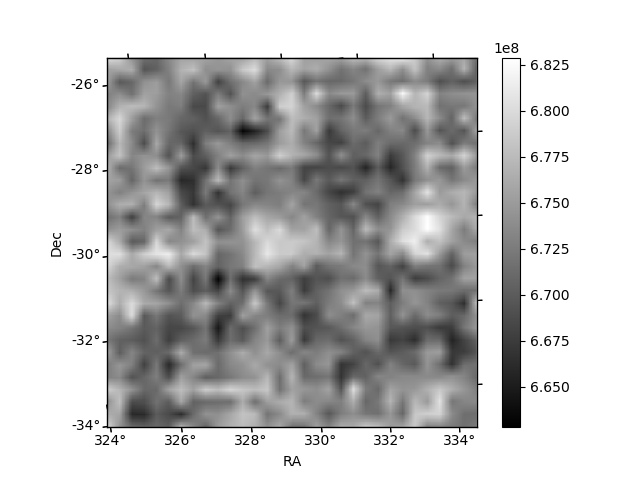
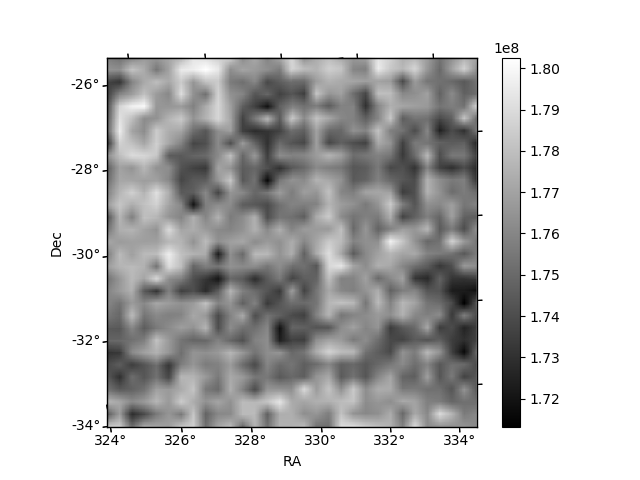
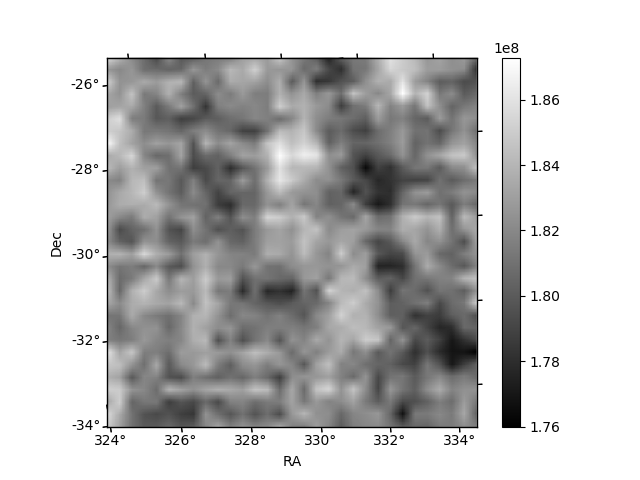
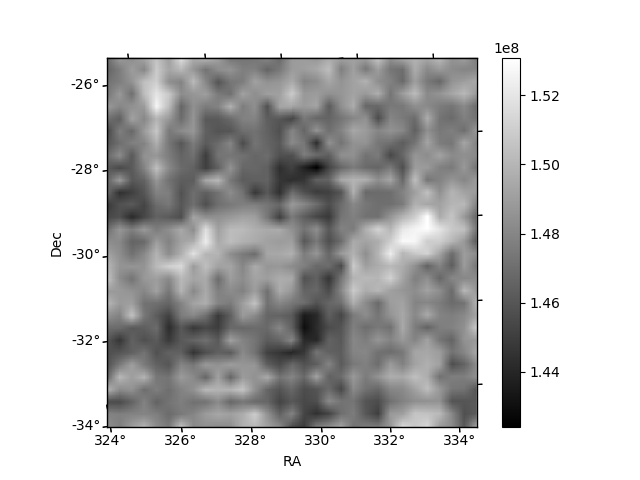
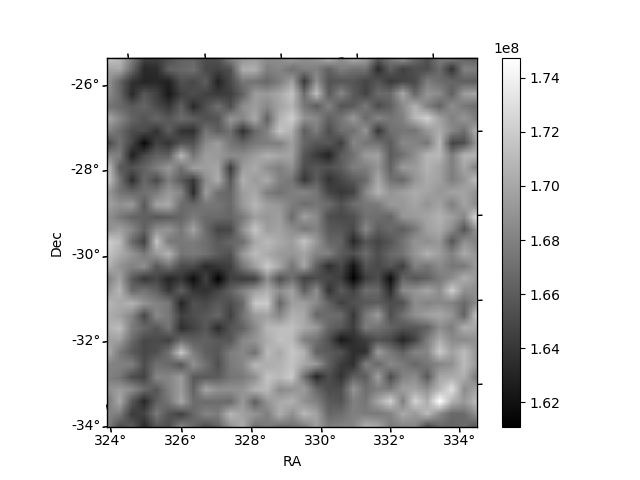
Histogram calculated using DETX and DETY for each event in the final _common_clean file
| Quadrant A | 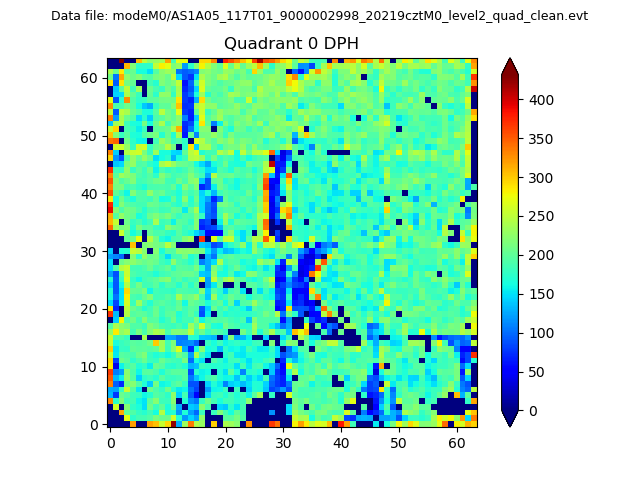 |
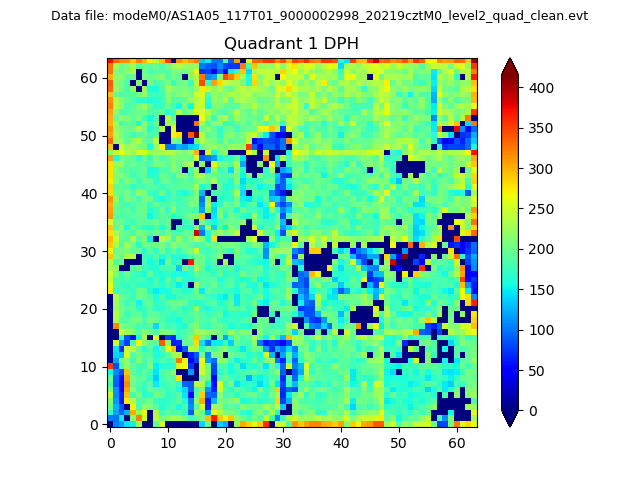 |
Quadrant B |
|---|---|---|---|
| Quadrant D | 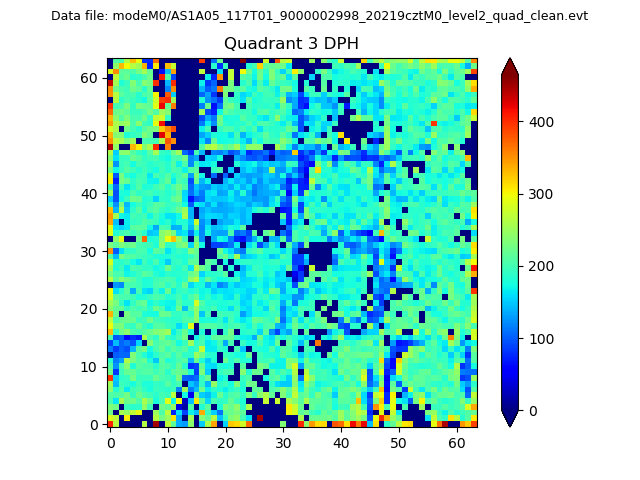 |
 |
Quadrant C |
| Plot type | Count rate plots | Images |
|---|---|---|
| Comparison with Poisson distribution Blue bars denote a histogram of data divided into 1 sec bins. Red curve is a Poisson curve with rate = median count rate of data. |
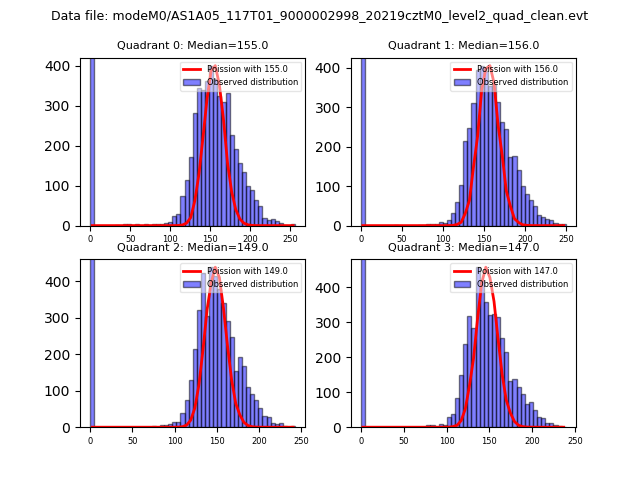 |
 |
| Quadrant-wise count rates Data is divided into 100 sec bins |
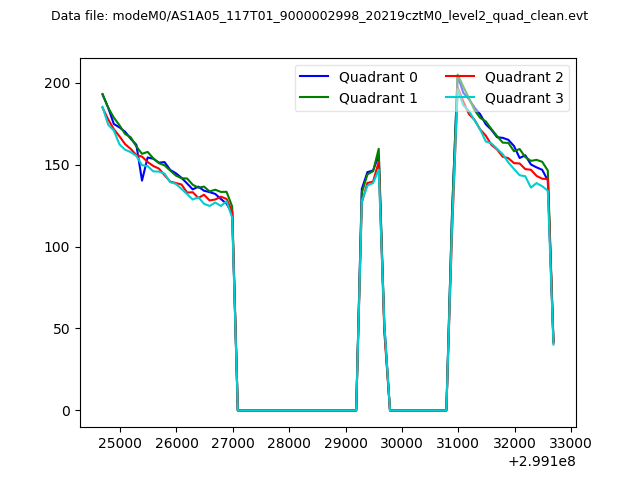 |
|
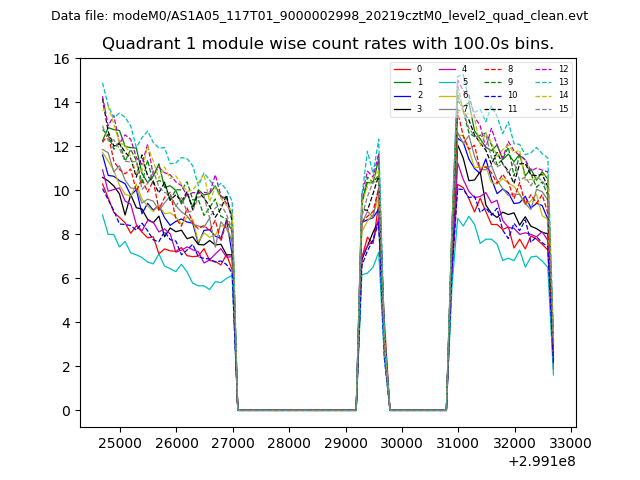
| Module-wise count rates for Quadrant A Data is divided into 100 sec bins |
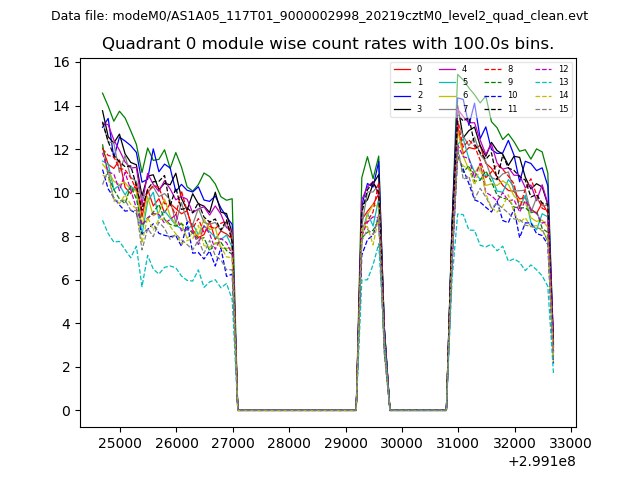 |
 |
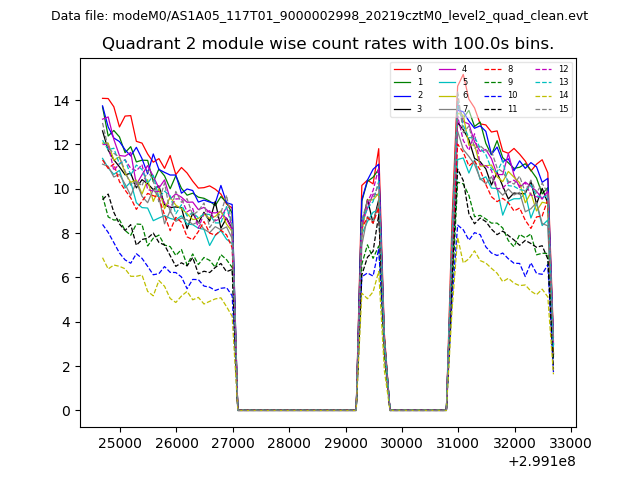
| Module-wise count rates for Quadrant B Data is divided into 100 sec bins |
 |
 |
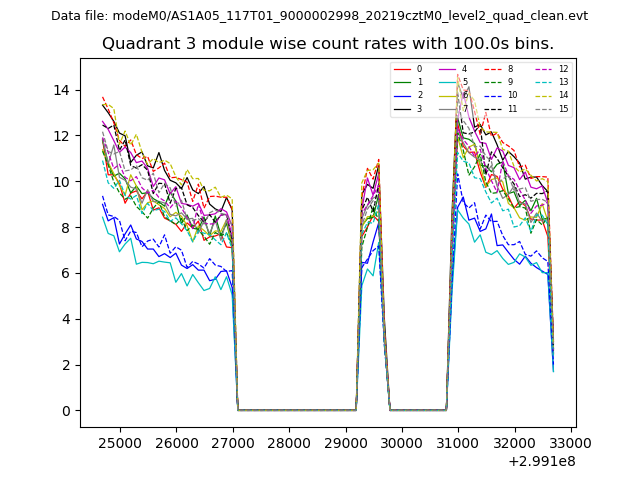
| Module-wise count rates for Quadrant C Data is divided into 100 sec bins |
 |
 |
| Module-wise count rates for Quadrant D Data is divided into 100 sec bins |
 |
 |
| Parameter | Plot |
|---|---|
| CZT HV Monitor | 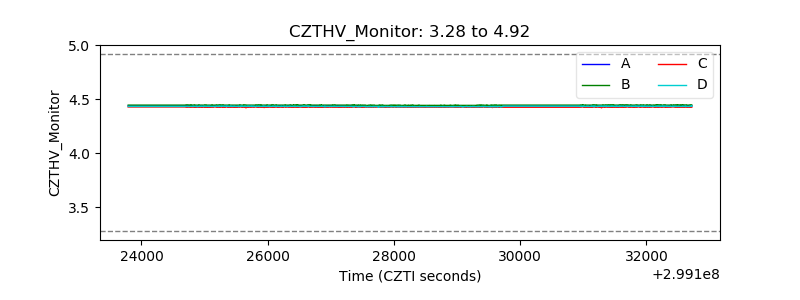 |
| D_VDD | 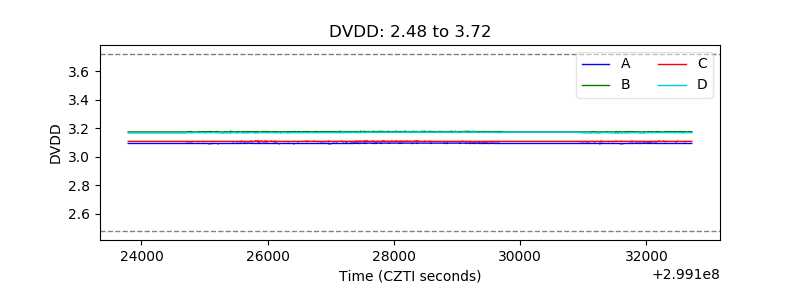 |
| Temperature 1 | 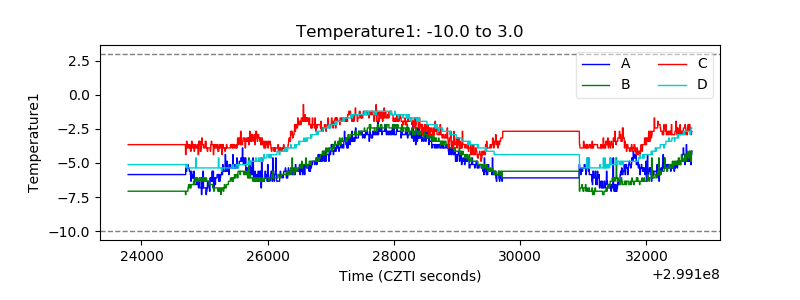 |
| Veto HV Monitor | 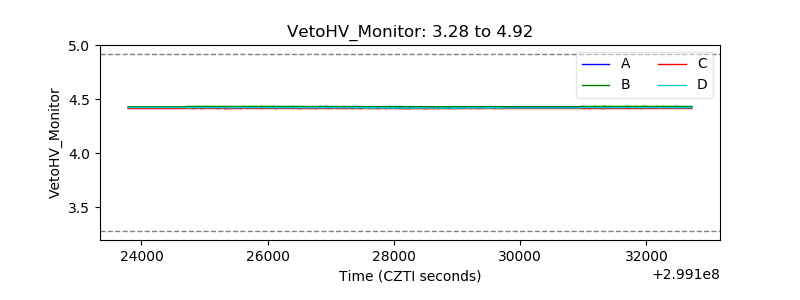 |
| Veto LLD | 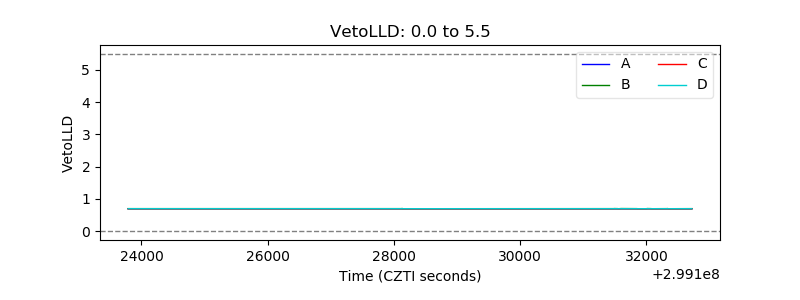 |
| Alpha Counter | 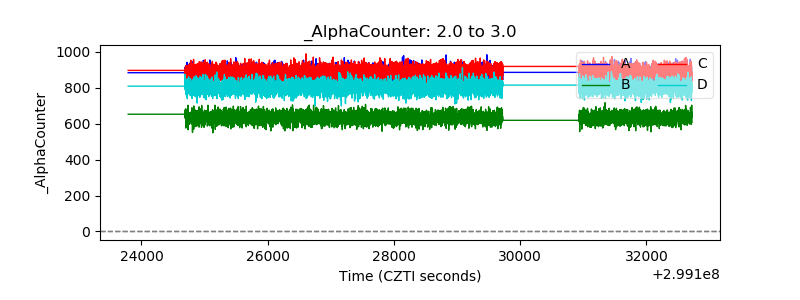 |
| _CPM_Rate | 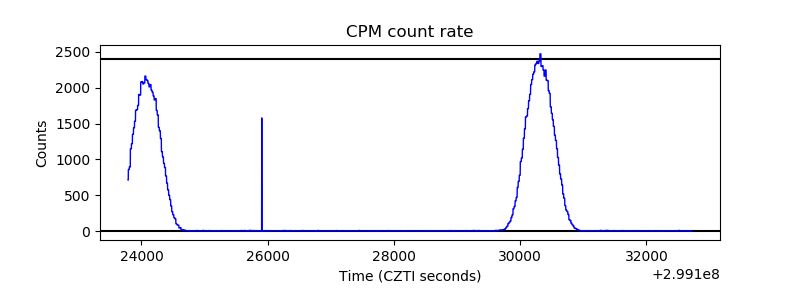 |
| CZT Counter | 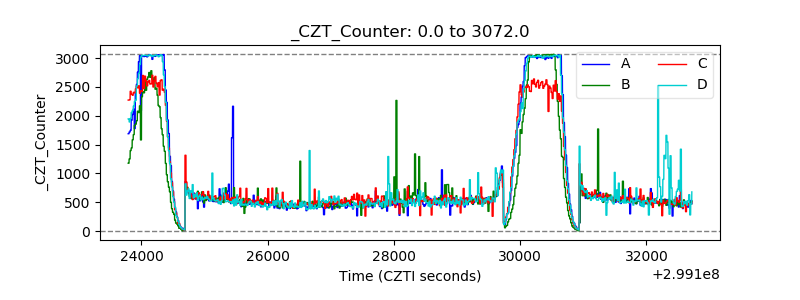 |
| +2.5 Volts monitor |  |
| +5 Volts monitor | 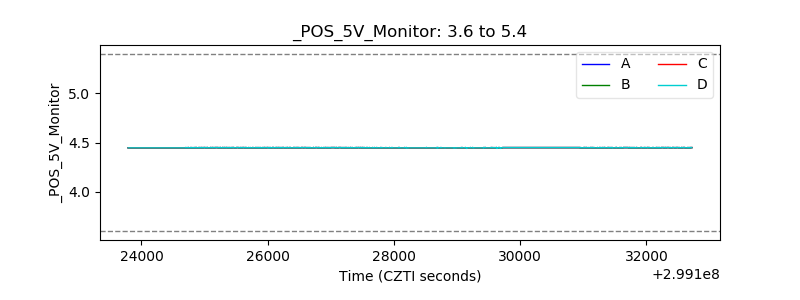 |
| _ROLL_ROT |  |
| _Roll_DEC | 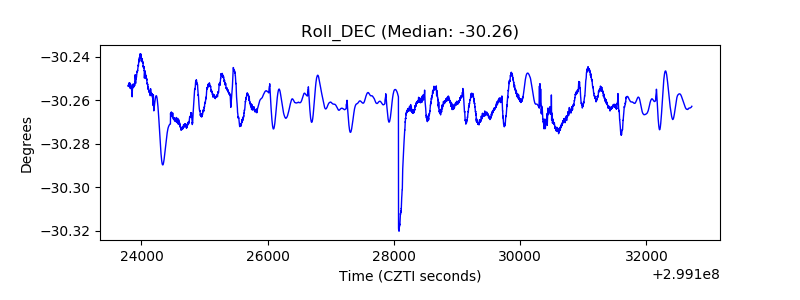 |
| _Roll_RA | 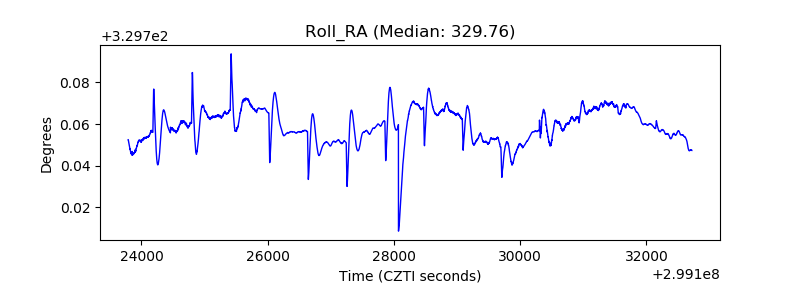 |
| Veto Counter | 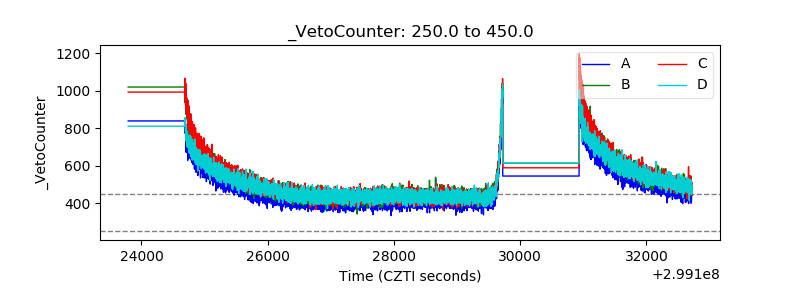 |