| Param | Original file | Final file |
|---|---|---|
| Filename | modeM0/AS1A05_117T01_9000002998_20222cztM0_level2.evt | modeM0/AS1A05_117T01_9000002998_20222cztM0_level2_quad_clean.evt |
| Size (bytes) | 1,150,364,160 | 190,941,120 |
| Size | 1.1 GB | 182.1 MB |
| Events in quadrant A | 8,078,703 | 1,220,523 |
| Events in quadrant B | 8,523,878 | 1,221,080 |
| Events in quadrant C | 8,086,119 | 1,153,612 |
| Events in quadrant D | 9,126,259 | 1,141,597 |
| Mode M0 | |||
|---|---|---|---|
| Quadrant | BADHDUFLAG | Total packets | Discarded packets |
| A | 0 | 32558 | 3 |
| B | 0 | 34022 | 3 |
| C | 0 | 32516 | 3 |
| D | 0 | 36315 | 3 |
| Mode SS | |||
|---|---|---|---|
| Quadrant | BADHDUFLAG | Total packets | Discarded packets |
| A | 0 | 310 | 0 |
| B | 0 | 310 | 0 |
| C | 0 | 310 | 0 |
| D | 0 | 310 | 0 |
| Mode M9 | |||
|---|---|---|---|
| Quadrant | BADHDUFLAG | Total packets | Discarded packets |
| A | 0 | 38 | 0 |
| B | 0 | 38 | 0 |
| C | 0 | 38 | 0 |
| D | 0 | 38 | 0 |
| Quadrant | Total seconds | Saturated seconds | Saturation percentage |
|---|---|---|---|
| A | 15155 | 218 | 1.438469% |
| B | 15155 | 290 | 1.913560% |
| C | 15155 | 272 | 1.794787% |
| D | 15155 | 318 | 2.098317% |
Noise dominated data is calculated using 1-second bins in cleaned event files. If a bin has >2000 counts, and if more than 50% of those come from <1% of pixels, then it is considered to be noise-dominated and hence unusable.
| Quadrant | # 1 sec bins | Bins with >0 counts | Bins with >2000 counts | High rate bins dominated by noise | Noise dominated (total time) | Noise dominated (detector-on time) | Marked lightcurve |
|---|---|---|---|---|---|---|---|
| A | 19005 | 15158 | 12 | 12 | 0.06% | 0.08% | 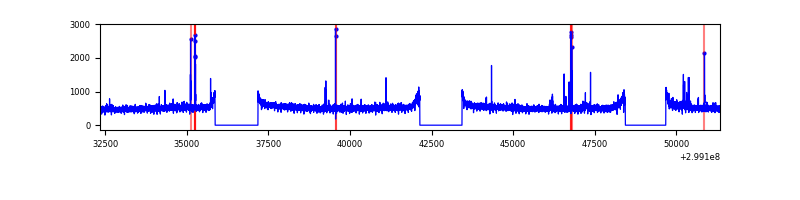 |
| B | 19005 | 15158 | 27 | 27 | 0.14% | 0.18% | 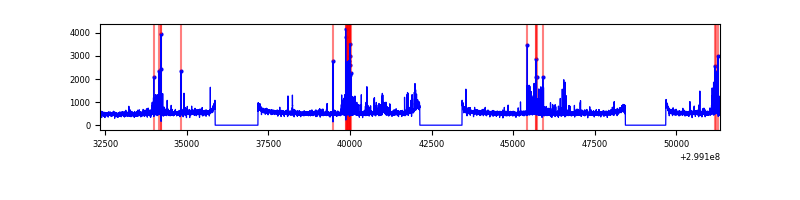 |
| C | 19005 | 15158 | 5 | 5 | 0.03% | 0.03% | 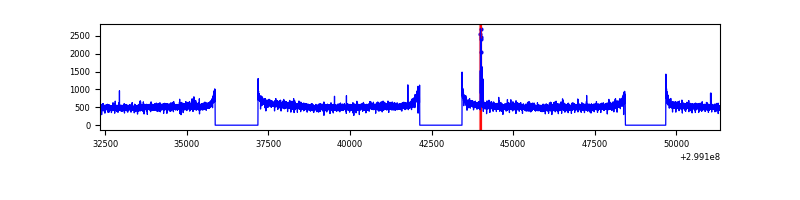 |
| D | 19005 | 15158 | 156 | 156 | 0.82% | 1.03% | 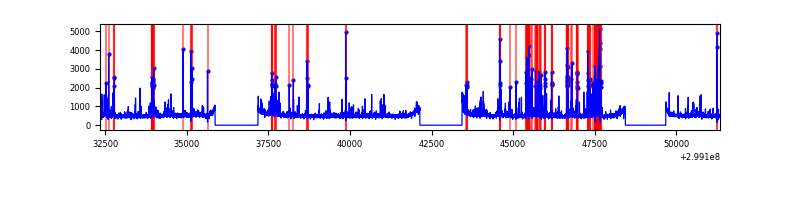 |
Top three noisy pixels from each quadrant. If the there are fewer than three noisy pixels in the level2.evt file, extra rows are filled as -1
| Pixel properties | Quadrant properties | ||||||
|---|---|---|---|---|---|---|---|
| Quadrant | DetID | PixID | Counts | Sigma | Mean | Median | Sigma |
| A | 14 | 238 | 61680 | 146.11 | 2054 | 2018 | 408.3 |
| A | 9 | 143 | 35545 | 82.11 | 2054 | 2018 | 408.3 |
| A | 13 | 252 | 34433 | 79.39 | 2054 | 2018 | 408.3 |
| B | 7 | 220 | 338425 | 901.05 | 2011 | 1964 | 373.4 |
| B | 10 | 245 | 128971 | 340.13 | 2011 | 1964 | 373.4 |
| B | 12 | 111 | 43452 | 111.11 | 2011 | 1964 | 373.4 |
| C | 14 | 238 | 305617 | 676.56 | 1943 | 1964 | 448.8 |
| C | 3 | 233 | 197038 | 434.64 | 1943 | 1964 | 448.8 |
| C | 1 | 16 | 15655 | 30.5 | 1943 | 1964 | 448.8 |
| D | 1 | 52 | 865631 | 1806.17 | 2001 | 1950 | 478.2 |
| D | 11 | 176 | 227557 | 471.8 | 2001 | 1950 | 478.2 |
| D | 9 | 1 | 111384 | 228.85 | 2001 | 1950 | 478.2 |
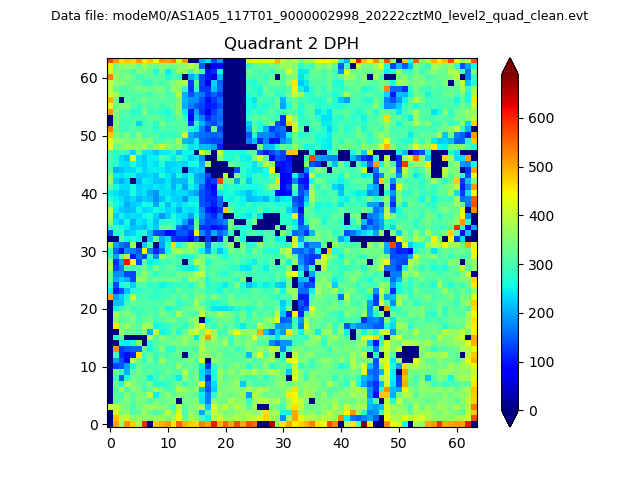
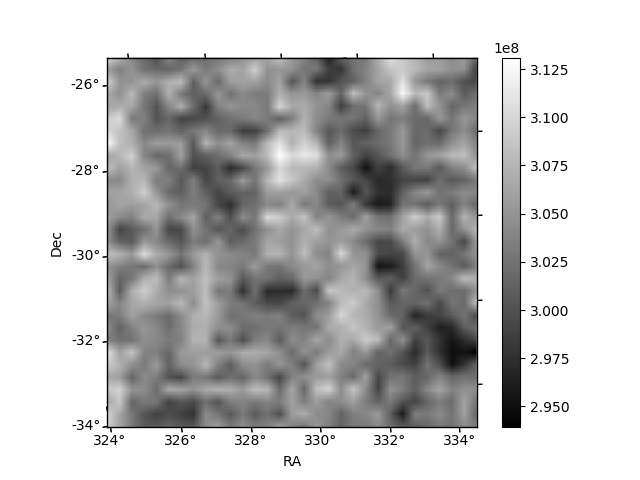
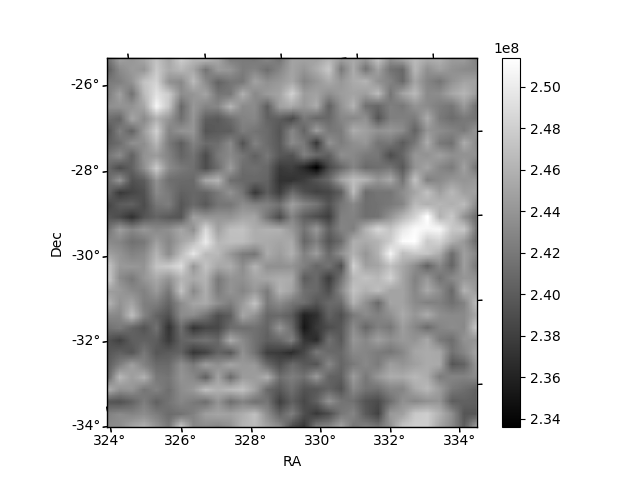
Histogram calculated using DETX and DETY for each event in the final _common_clean file
| Quadrant A | 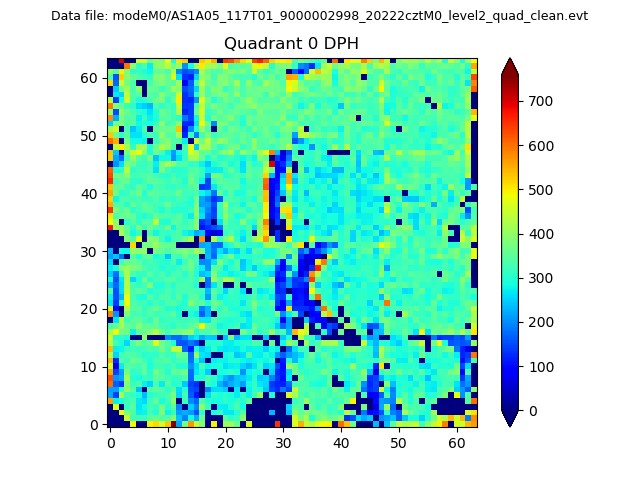 |
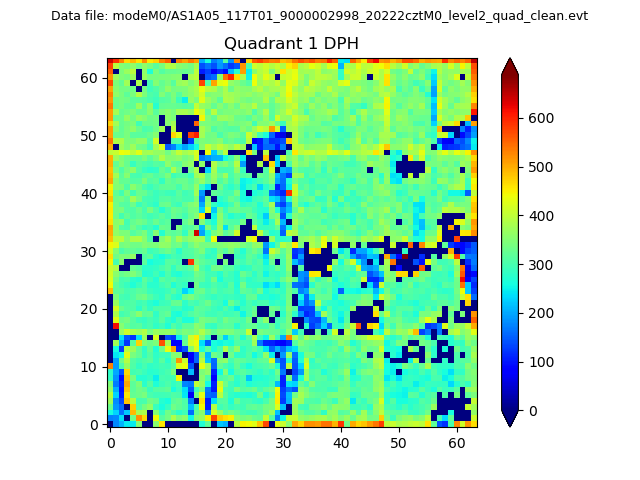 |
Quadrant B |
|---|---|---|---|
| Quadrant D | 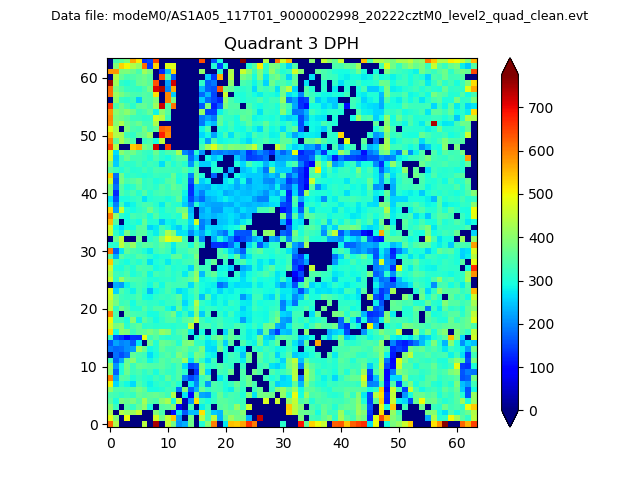 |
 |
Quadrant C |
| Plot type | Count rate plots | Images |
|---|---|---|
| Comparison with Poisson distribution Blue bars denote a histogram of data divided into 1 sec bins. Red curve is a Poisson curve with rate = median count rate of data. |
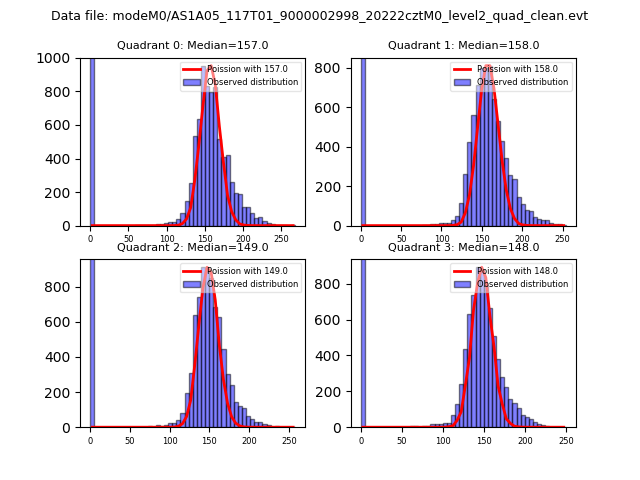 |
 |
| Quadrant-wise count rates Data is divided into 100 sec bins |
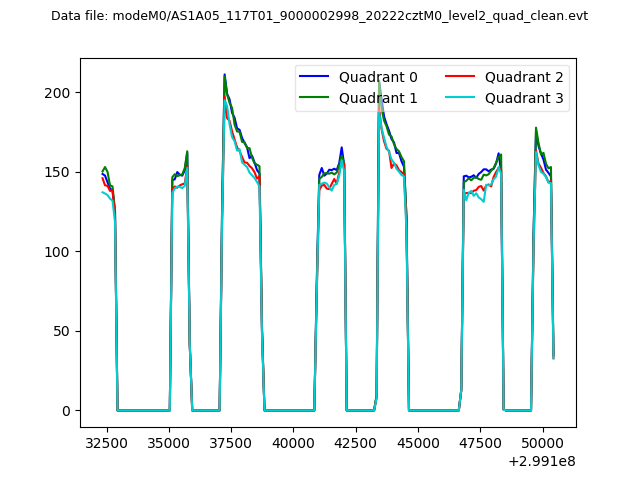 |
|
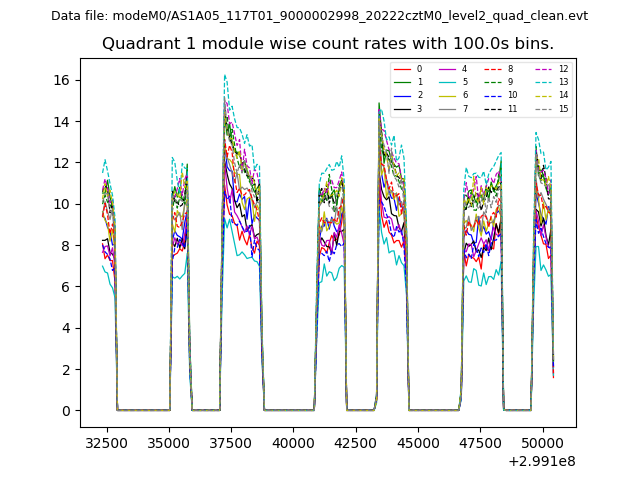
| Module-wise count rates for Quadrant A Data is divided into 100 sec bins |
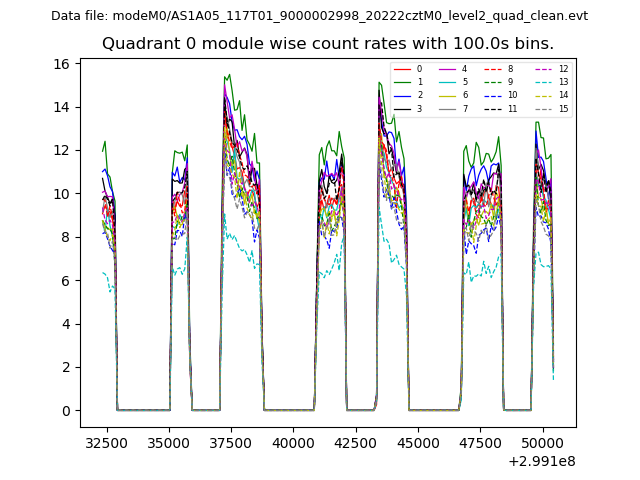 |
 |
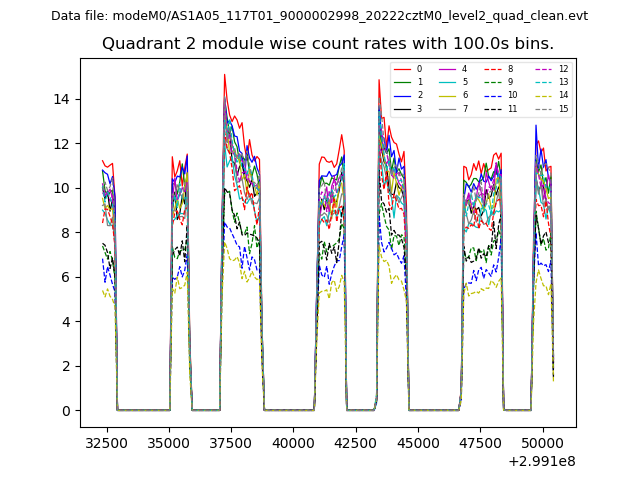
| Module-wise count rates for Quadrant B Data is divided into 100 sec bins |
 |
 |
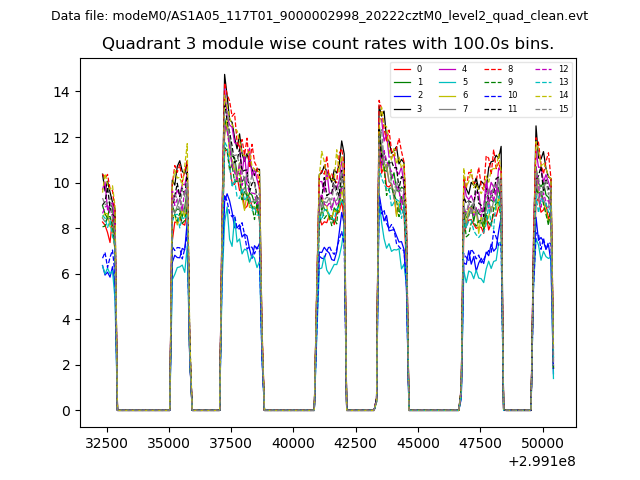
| Module-wise count rates for Quadrant C Data is divided into 100 sec bins |
 |
 |
| Module-wise count rates for Quadrant D Data is divided into 100 sec bins |
 |
 |
| Parameter | Plot |
|---|---|
| CZT HV Monitor | 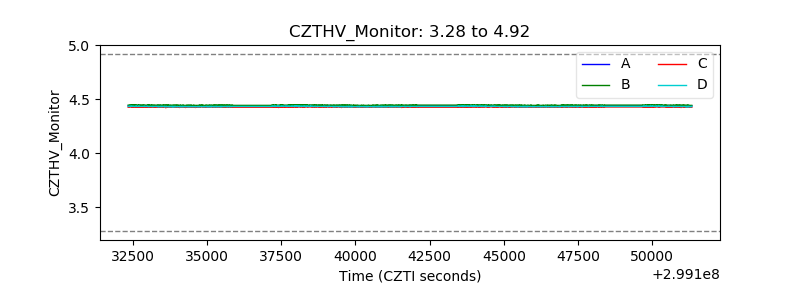 |
| D_VDD |  |
| Temperature 1 | 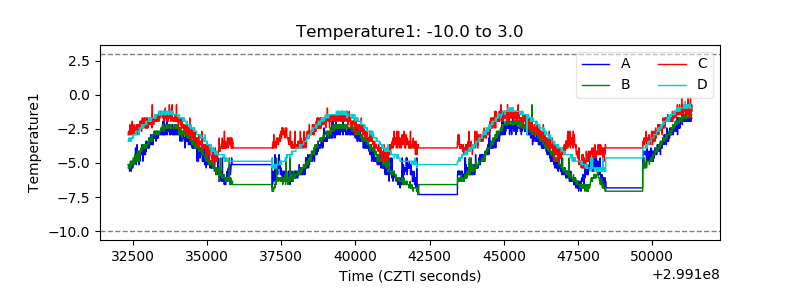 |
| Veto HV Monitor |  |
| Veto LLD | 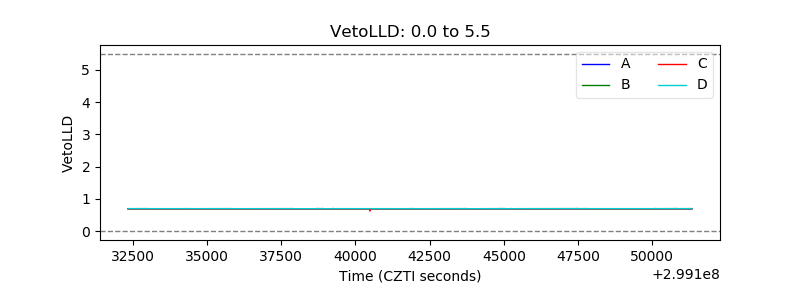 |
| Alpha Counter |  |
| _CPM_Rate | 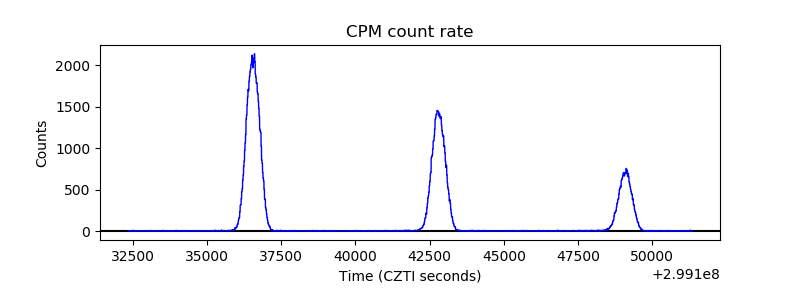 |
| CZT Counter | 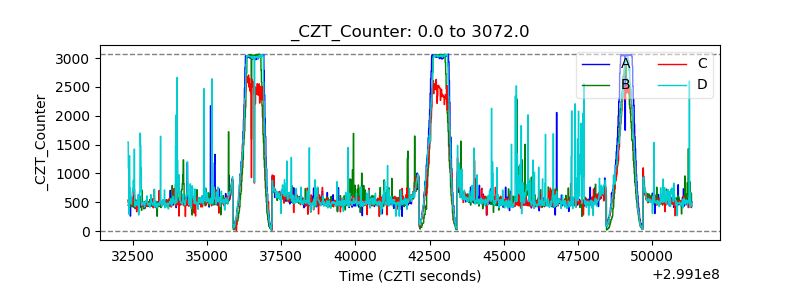 |
| +2.5 Volts monitor |  |
| +5 Volts monitor |  |
| _ROLL_ROT | 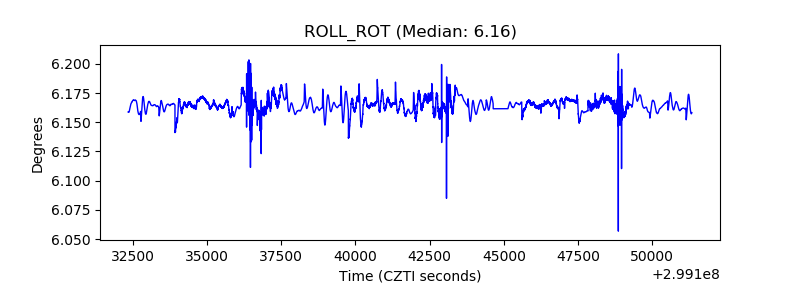 |
| _Roll_DEC | 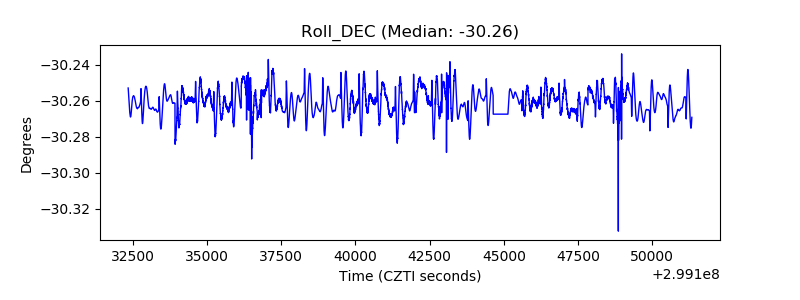 |
| _Roll_RA |  |
| Veto Counter | 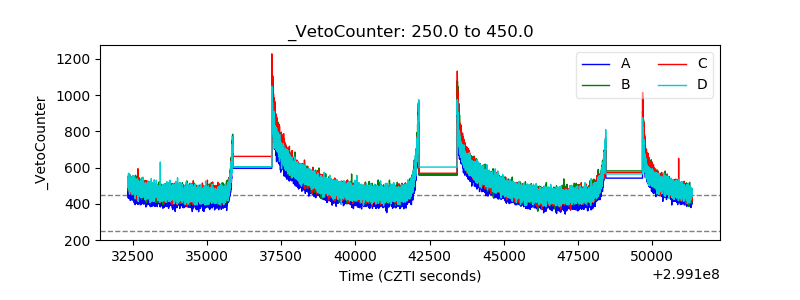 |