| Param | Original file | Final file |
|---|---|---|
| Filename | modeM0/AS1A05_117T01_9000002998_20223cztM0_level2.evt | modeM0/AS1A05_117T01_9000002998_20223cztM0_level2_quad_clean.evt |
| Size (bytes) | 547,352,640 | 77,215,680 |
| Size | 522.0 MB | 73.6 MB |
| Events in quadrant A | 3,512,839 | 483,986 |
| Events in quadrant B | 3,854,988 | 482,113 |
| Events in quadrant C | 3,478,196 | 458,211 |
| Events in quadrant D | 5,273,378 | 444,106 |
| Mode M0 | |||
|---|---|---|---|
| Quadrant | BADHDUFLAG | Total packets | Discarded packets |
| A | 0 | 14357 | 1 |
| B | 0 | 15414 | 1 |
| C | 0 | 14054 | 1 |
| D | 0 | 19925 | 1 |
| Mode SS | |||
|---|---|---|---|
| Quadrant | BADHDUFLAG | Total packets | Discarded packets |
| A | 0 | 136 | 0 |
| B | 0 | 136 | 0 |
| C | 0 | 136 | 0 |
| D | 0 | 136 | 0 |
| Mode M9 | |||
|---|---|---|---|
| Quadrant | BADHDUFLAG | Total packets | Discarded packets |
| A | 0 | 10 | 0 |
| B | 0 | 10 | 0 |
| C | 0 | 10 | 0 |
| D | 0 | 10 | 0 |
| Quadrant | Total seconds | Saturated seconds | Saturation percentage |
|---|---|---|---|
| A | 6738 | 125 | 1.855150% |
| B | 6739 | 177 | 2.626502% |
| C | 6739 | 137 | 2.032943% |
| D | 6739 | 723 | 10.728595% |
Noise dominated data is calculated using 1-second bins in cleaned event files. If a bin has >2000 counts, and if more than 50% of those come from <1% of pixels, then it is considered to be noise-dominated and hence unusable.
| Quadrant | # 1 sec bins | Bins with >0 counts | Bins with >2000 counts | High rate bins dominated by noise | Noise dominated (total time) | Noise dominated (detector-on time) | Marked lightcurve |
|---|---|---|---|---|---|---|---|
| A | 7728 | 6739 | 6 | 6 | 0.08% | 0.09% | 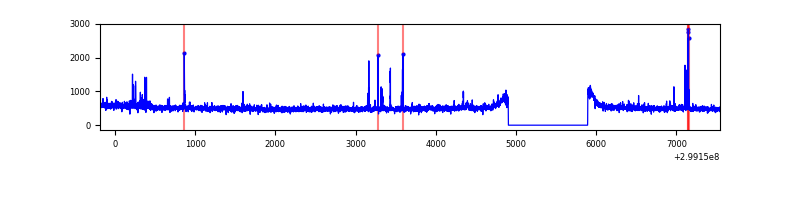 |
| B | 7729 | 6740 | 32 | 32 | 0.41% | 0.47% | 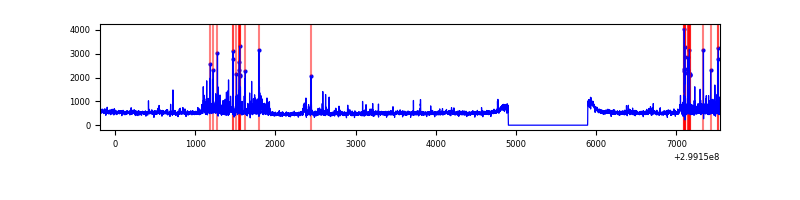 |
| C | 7729 | 6740 | 0 | 0 | 0.00% | 0.00% | 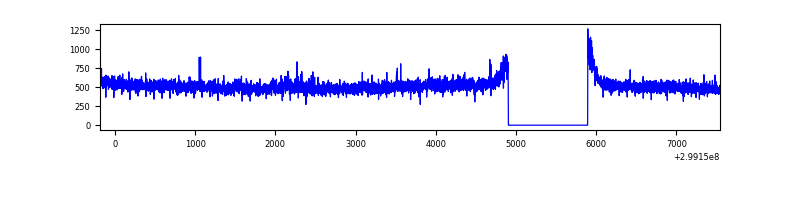 |
| D | 7729 | 6740 | 581 | 581 | 7.52% | 8.62% | 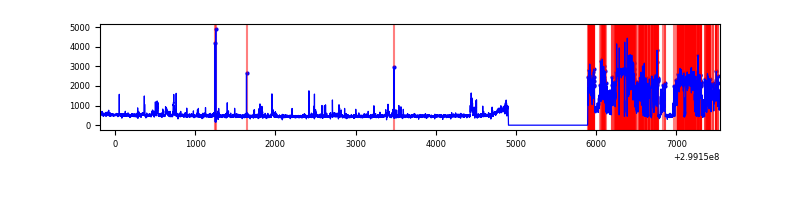 |
Top three noisy pixels from each quadrant. If the there are fewer than three noisy pixels in the level2.evt file, extra rows are filled as -1
| Pixel properties | Quadrant properties | ||||||
|---|---|---|---|---|---|---|---|
| Quadrant | DetID | PixID | Counts | Sigma | Mean | Median | Sigma |
| A | 14 | 238 | 48492 | 268.79 | 880 | 863 | 177.2 |
| A | 4 | 2 | 33184 | 182.4 | 880 | 863 | 177.2 |
| A | 13 | 252 | 30852 | 169.24 | 880 | 863 | 177.2 |
| B | 7 | 220 | 302922 | 1846.95 | 863 | 843 | 163.6 |
| B | 0 | 197 | 55312 | 333.03 | 863 | 843 | 163.6 |
| B | 4 | 171 | 25319 | 149.65 | 863 | 843 | 163.6 |
| C | 14 | 238 | 131450 | 678.47 | 831 | 839 | 192.5 |
| C | 3 | 233 | 96210 | 495.41 | 831 | 839 | 192.5 |
| C | 1 | 16 | 5884 | 26.21 | 831 | 839 | 192.5 |
| D | 1 | 52 | 1158388 | 5847.27 | 817 | 796 | 198.0 |
| D | 12 | 218 | 860085 | 4340.47 | 817 | 796 | 198.0 |
| D | 7 | 238 | 61930 | 308.8 | 817 | 796 | 198.0 |
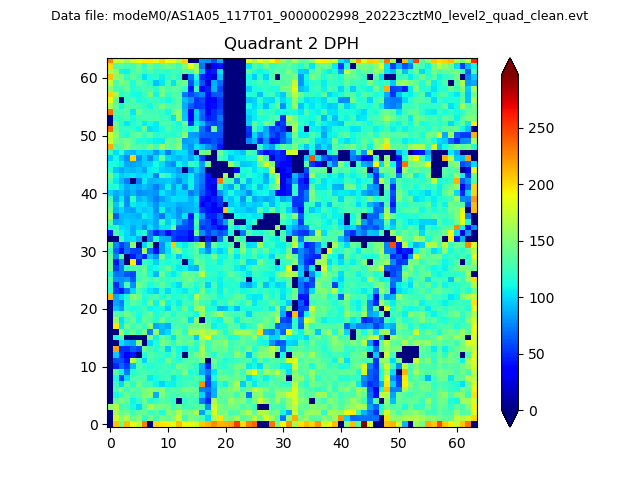
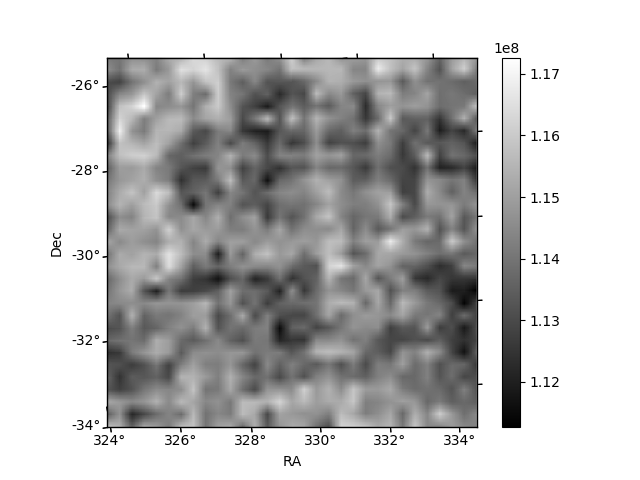
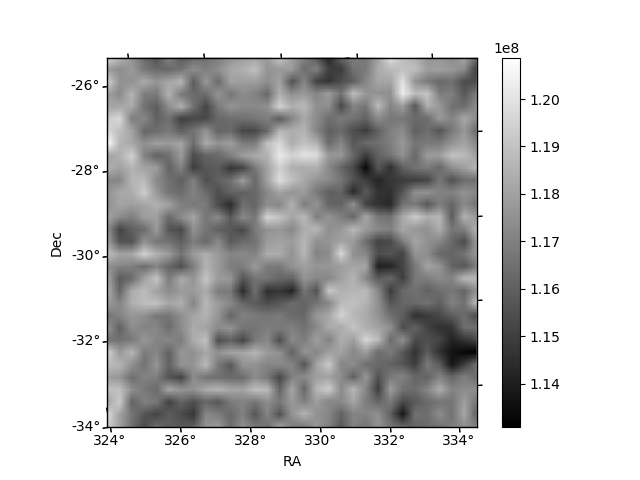
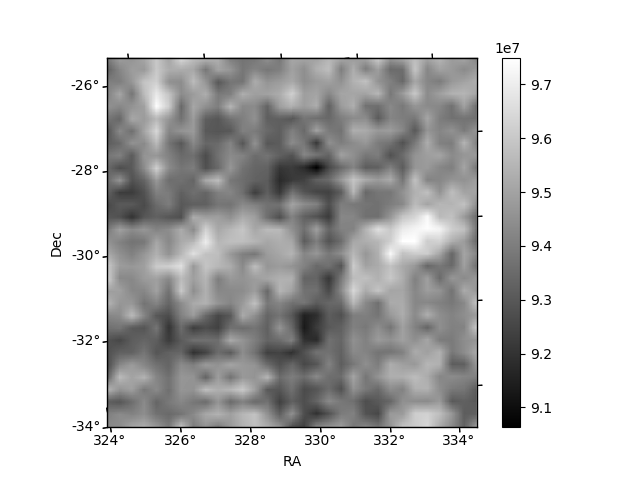
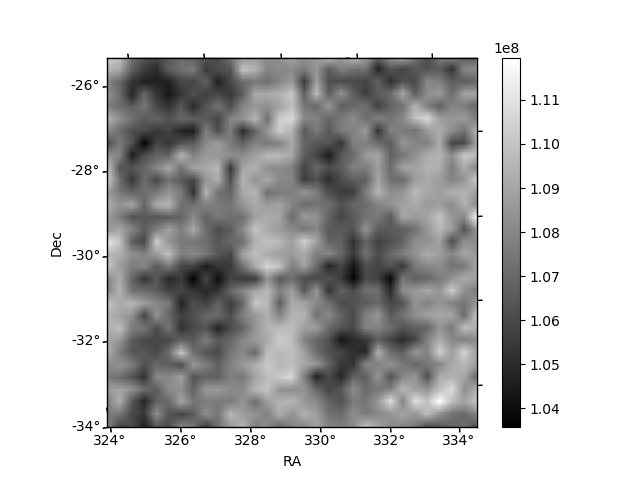
Histogram calculated using DETX and DETY for each event in the final _common_clean file
| Quadrant A | 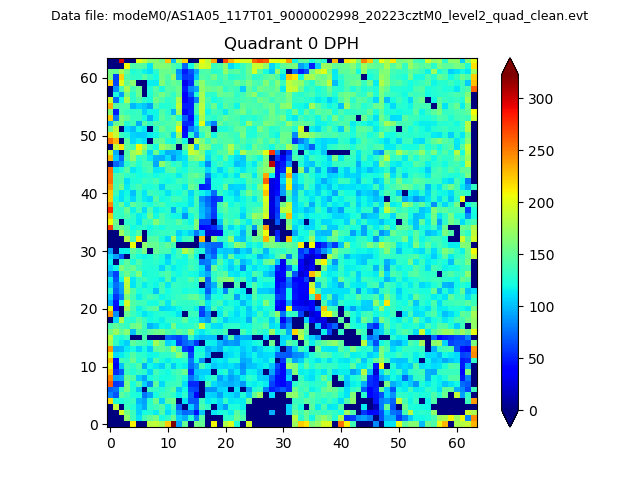 |
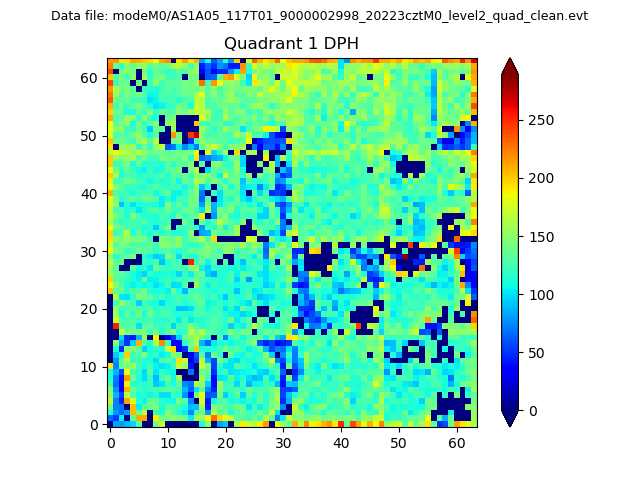 |
Quadrant B |
|---|---|---|---|
| Quadrant D | 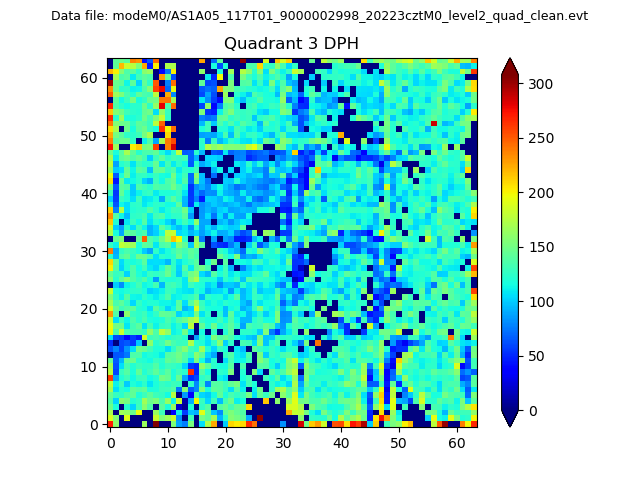 |
 |
Quadrant C |
| Plot type | Count rate plots | Images |
|---|---|---|
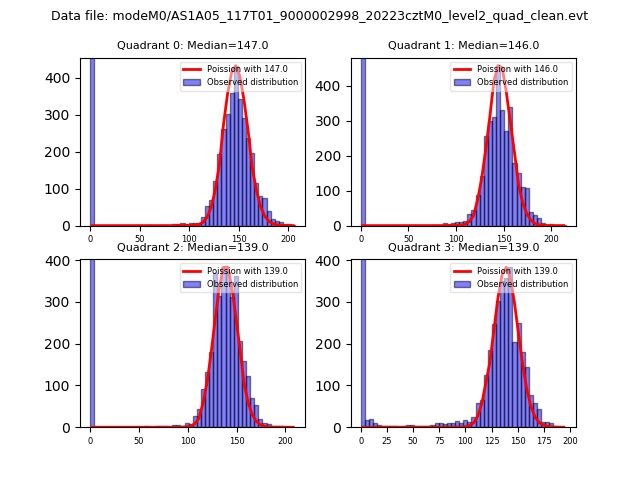
| Comparison with Poisson distribution Blue bars denote a histogram of data divided into 1 sec bins. Red curve is a Poisson curve with rate = median count rate of data. |
 |
 |
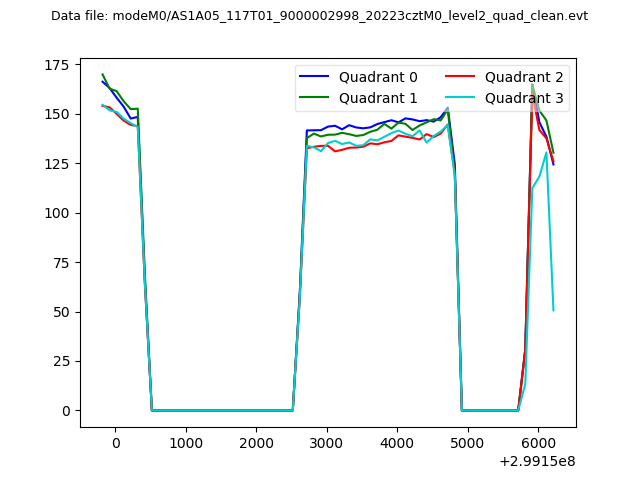
| Quadrant-wise count rates Data is divided into 100 sec bins |
 |
|
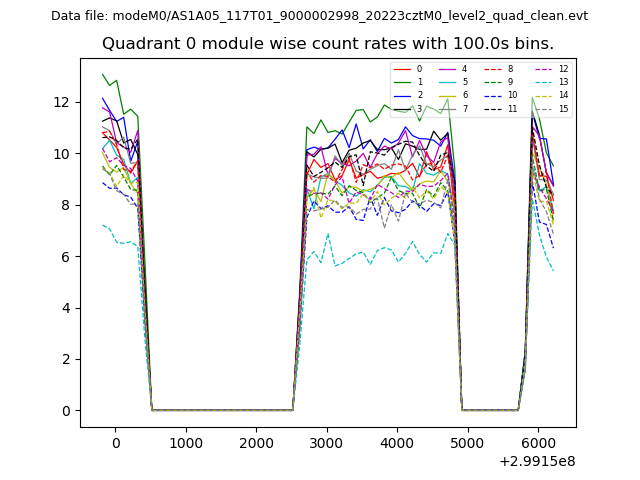
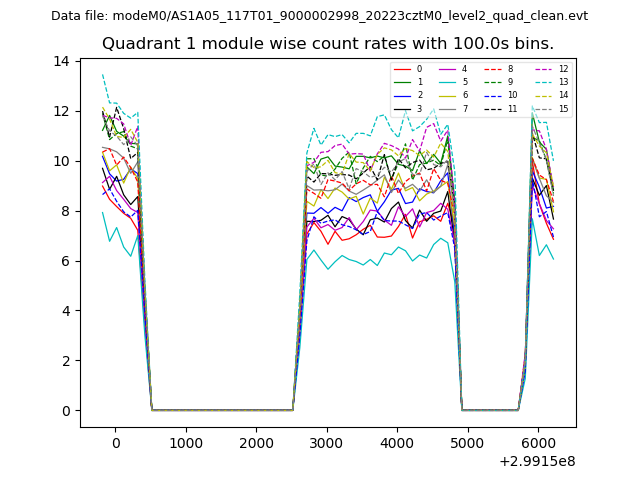
| Module-wise count rates for Quadrant A Data is divided into 100 sec bins |
 |
 |
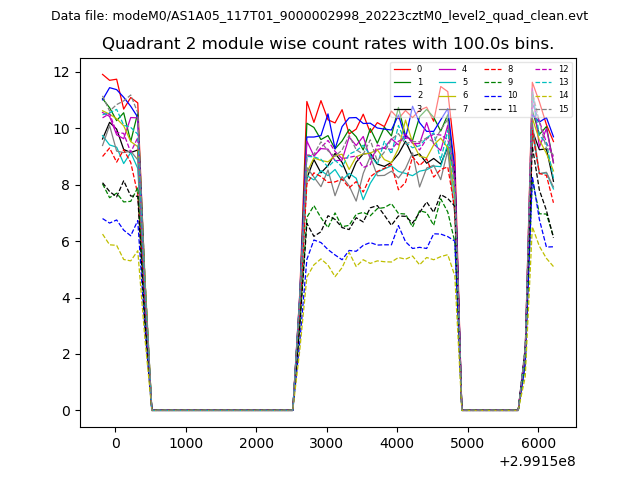
| Module-wise count rates for Quadrant B Data is divided into 100 sec bins |
 |
 |
| Module-wise count rates for Quadrant C Data is divided into 100 sec bins |
 |
 |
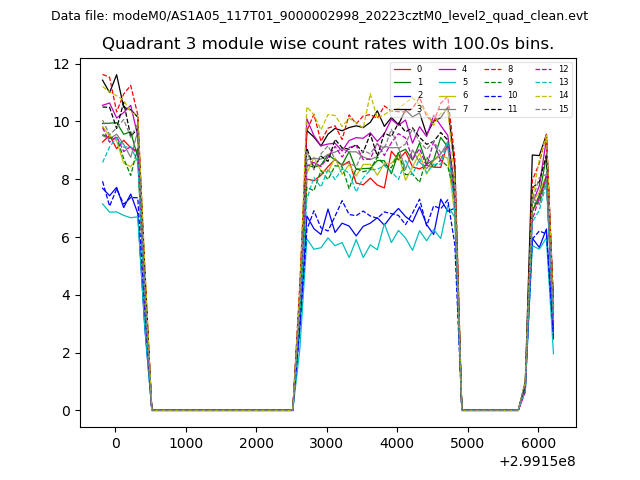
| Module-wise count rates for Quadrant D Data is divided into 100 sec bins |
 |
 |
| Parameter | Plot |
|---|---|
| CZT HV Monitor | 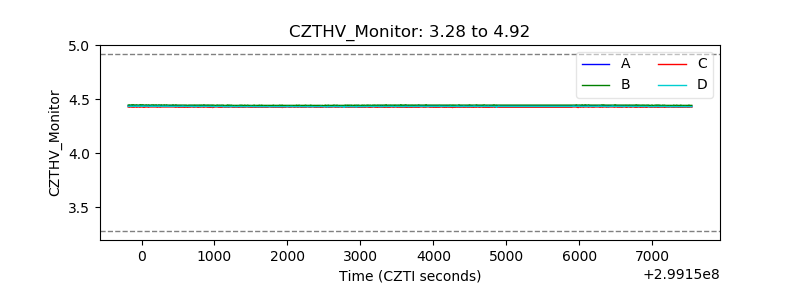 |
| D_VDD | 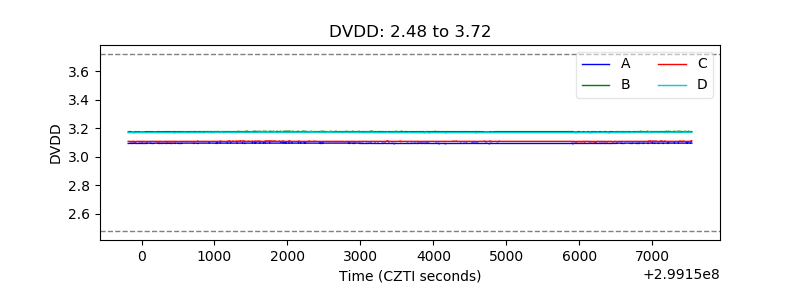 |
| Temperature 1 | 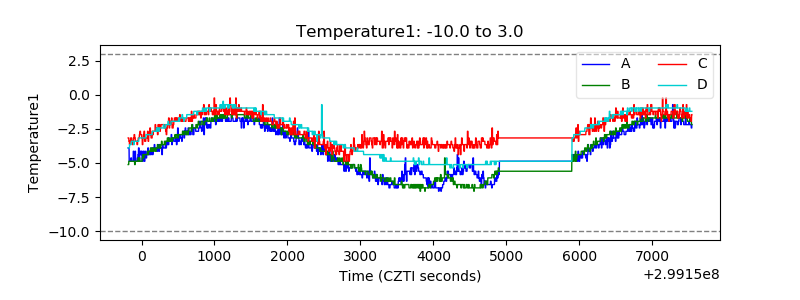 |
| Veto HV Monitor | 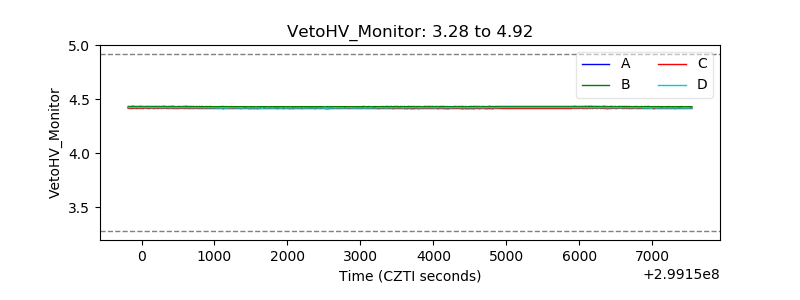 |
| Veto LLD | 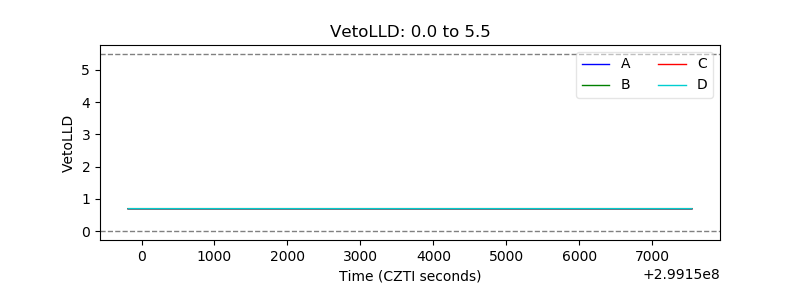 |
| Alpha Counter | 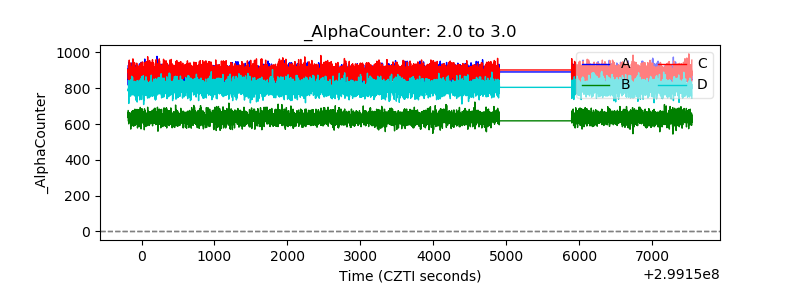 |
| _CPM_Rate | 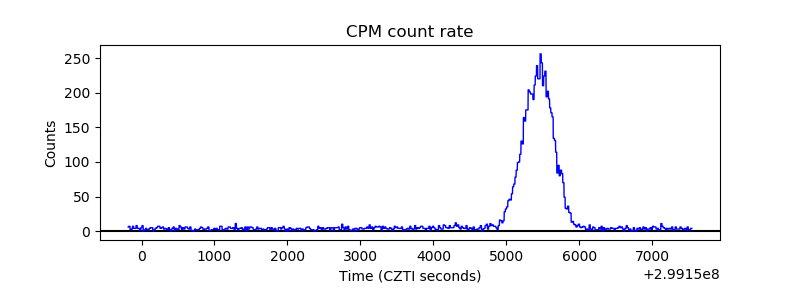 |
| CZT Counter | 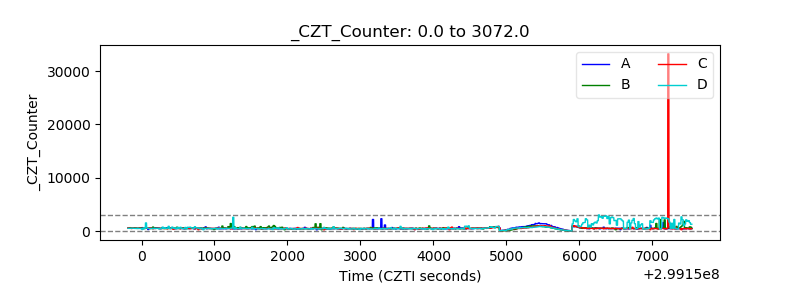 |
| +2.5 Volts monitor |  |
| +5 Volts monitor |  |
| _ROLL_ROT | 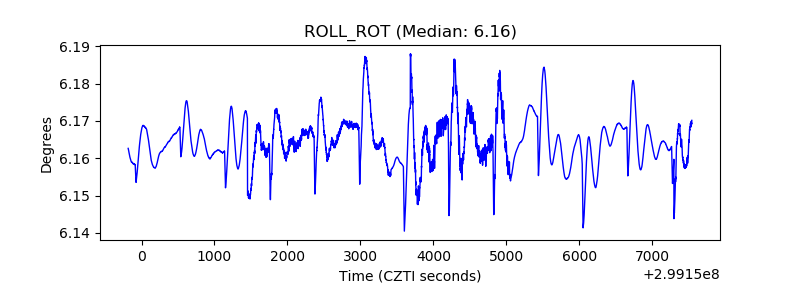 |
| _Roll_DEC | 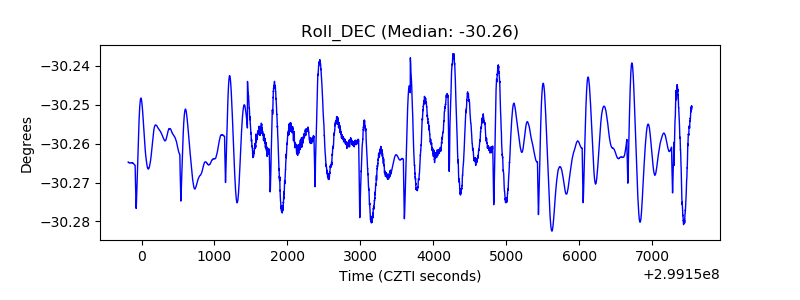 |
| _Roll_RA | 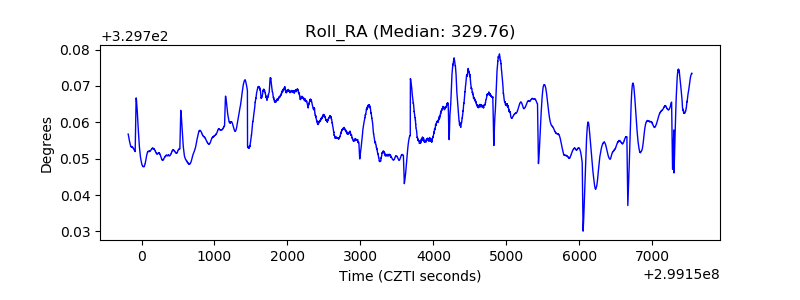 |
| Veto Counter | 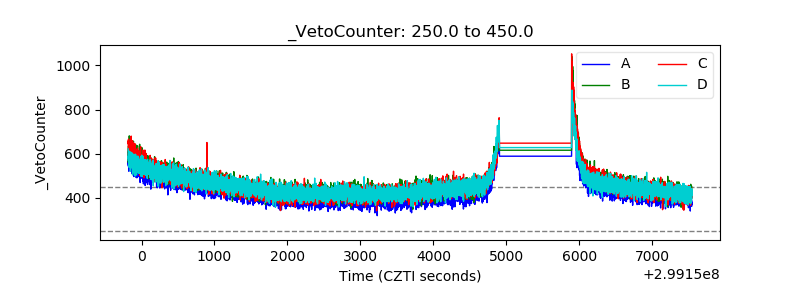 |