| Param | Original file | Final file |
|---|---|---|
| Filename | modeM0/AS1A05_117T01_9000002998_20224cztM0_level2.evt | modeM0/AS1A05_117T01_9000002998_20224cztM0_level2_quad_clean.evt |
| Size (bytes) | 563,693,760 | 70,070,400 |
| Size | 537.6 MB | 66.8 MB |
| Events in quadrant A | 3,487,326 | 424,451 |
| Events in quadrant B | 3,868,641 | 420,367 |
| Events in quadrant C | 3,435,853 | 401,095 |
| Events in quadrant D | 5,812,985 | 396,422 |
| Mode M0 | |||
|---|---|---|---|
| Quadrant | BADHDUFLAG | Total packets | Discarded packets |
| A | 0 | 14575 | 1 |
| B | 0 | 15715 | 1 |
| C | 0 | 14236 | 1 |
| D | 0 | 21791 | 1 |
| Mode SS | |||
|---|---|---|---|
| Quadrant | BADHDUFLAG | Total packets | Discarded packets |
| A | 0 | 140 | 0 |
| B | 0 | 140 | 0 |
| C | 0 | 140 | 0 |
| D | 0 | 140 | 0 |
| Mode M9 | |||
|---|---|---|---|
| Quadrant | BADHDUFLAG | Total packets | Discarded packets |
| A | 0 | 6 | 0 |
| B | 0 | 6 | 0 |
| C | 0 | 6 | 0 |
| D | 0 | 6 | 0 |
| Quadrant | Total seconds | Saturated seconds | Saturation percentage |
|---|---|---|---|
| A | 6875 | 135 | 1.963636% |
| B | 6876 | 194 | 2.821408% |
| C | 6876 | 114 | 1.657941% |
| D | 6876 | 885 | 12.870855% |
Noise dominated data is calculated using 1-second bins in cleaned event files. If a bin has >2000 counts, and if more than 50% of those come from <1% of pixels, then it is considered to be noise-dominated and hence unusable.
| Quadrant | # 1 sec bins | Bins with >0 counts | Bins with >2000 counts | High rate bins dominated by noise | Noise dominated (total time) | Noise dominated (detector-on time) | Marked lightcurve |
|---|---|---|---|---|---|---|---|
| A | 7535 | 6876 | 20 | 20 | 0.27% | 0.29% | 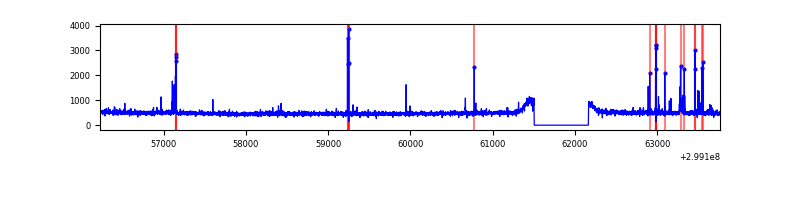 |
| B | 7536 | 6877 | 37 | 37 | 0.49% | 0.54% | 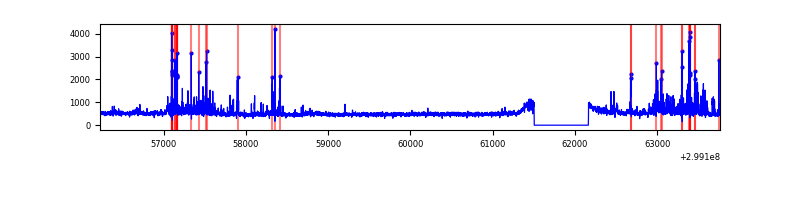 |
| C | 7536 | 6877 | 3 | 3 | 0.04% | 0.04% | 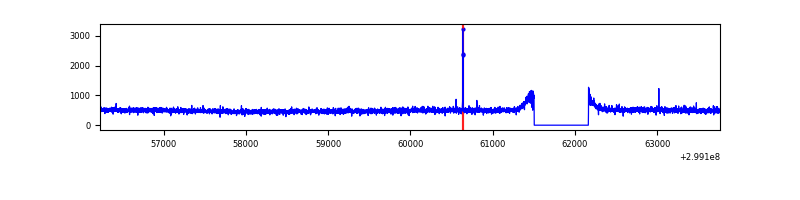 |
| D | 7536 | 6877 | 707 | 707 | 9.38% | 10.28% | 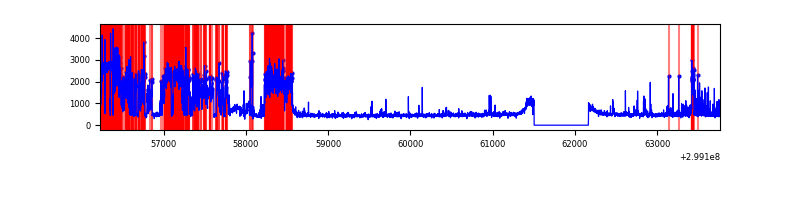 |
Top three noisy pixels from each quadrant. If the there are fewer than three noisy pixels in the level2.evt file, extra rows are filled as -1
| Pixel properties | Quadrant properties | ||||||
|---|---|---|---|---|---|---|---|
| Quadrant | DetID | PixID | Counts | Sigma | Mean | Median | Sigma |
| A | 14 | 238 | 123419 | 697.92 | 866 | 846 | 175.6 |
| A | 10 | 253 | 19209 | 104.56 | 866 | 846 | 175.6 |
| A | 4 | 2 | 12670 | 67.32 | 866 | 846 | 175.6 |
| B | 7 | 220 | 356590 | 2182.09 | 853 | 830 | 163.0 |
| B | 0 | 198 | 32476 | 194.1 | 853 | 830 | 163.0 |
| B | 0 | 197 | 30333 | 180.96 | 853 | 830 | 163.0 |
| C | 14 | 238 | 127995 | 655.09 | 825 | 831 | 194.1 |
| C | 3 | 233 | 67646 | 344.2 | 825 | 831 | 194.1 |
| C | 9 | 54 | 14793 | 71.93 | 825 | 831 | 194.1 |
| D | 1 | 52 | 1358910 | 6873.83 | 807 | 786 | 197.6 |
| D | 12 | 218 | 731276 | 3697.21 | 807 | 786 | 197.6 |
| D | 12 | 17 | 534551 | 2701.53 | 807 | 786 | 197.6 |
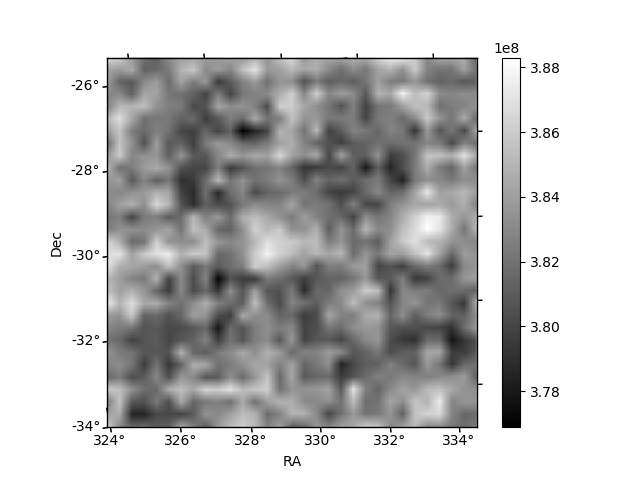
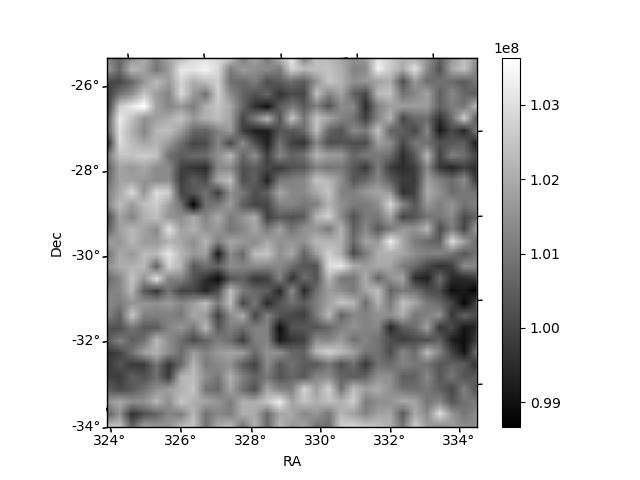
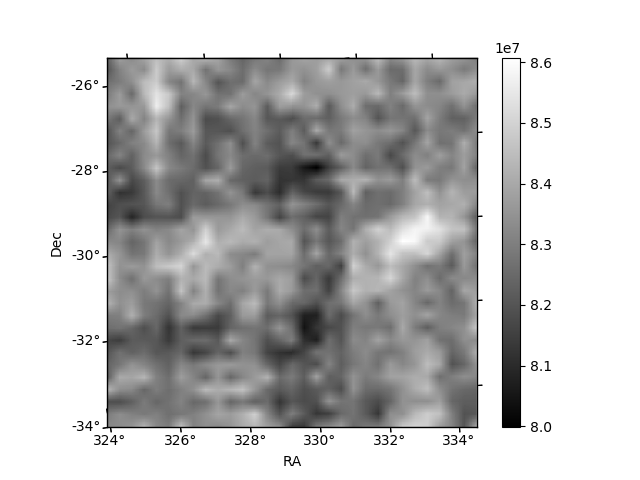
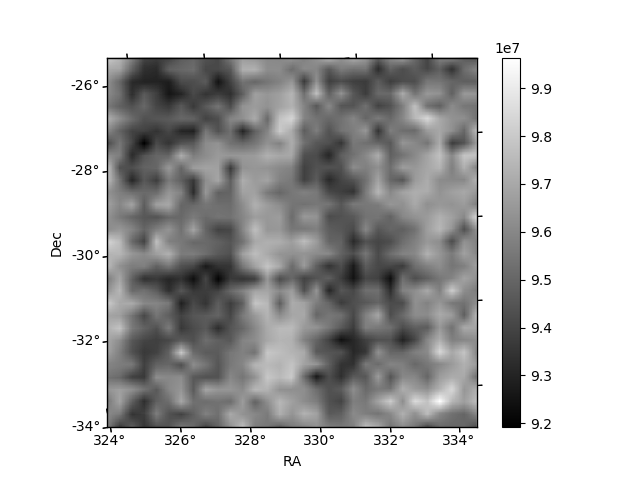
Histogram calculated using DETX and DETY for each event in the final _common_clean file
| Quadrant A | 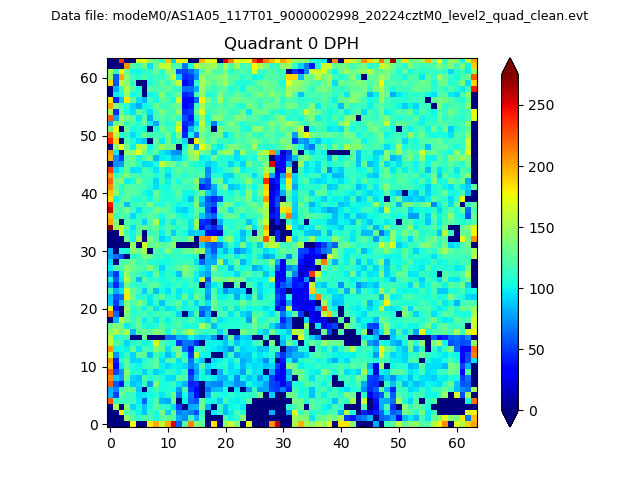 |
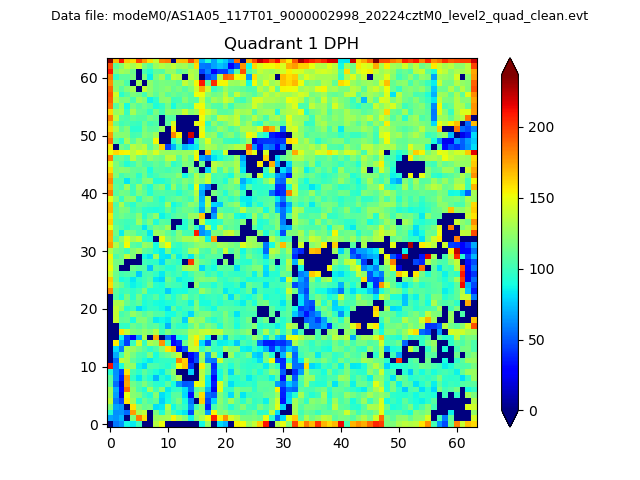 |
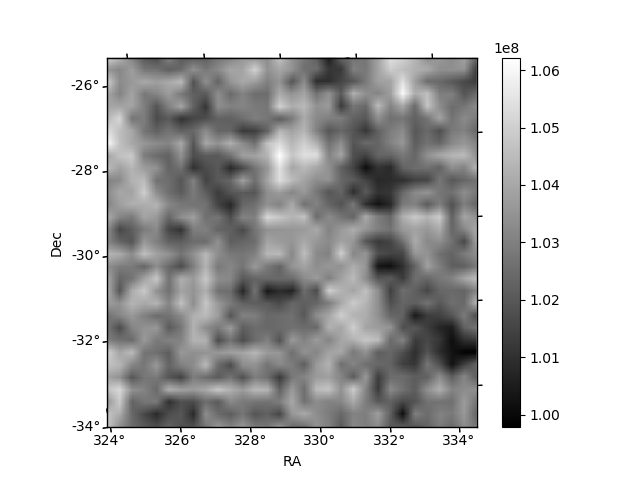
Quadrant B |
|---|---|---|---|
| Quadrant D | 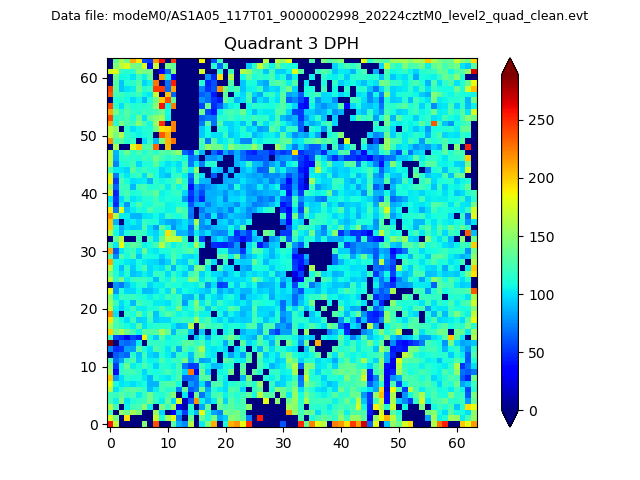 |
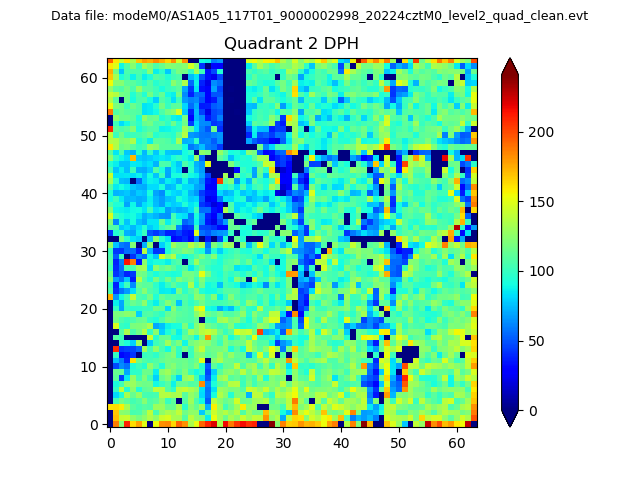 |
Quadrant C |
| Plot type | Count rate plots | Images |
|---|---|---|
| Comparison with Poisson distribution Blue bars denote a histogram of data divided into 1 sec bins. Red curve is a Poisson curve with rate = median count rate of data. |
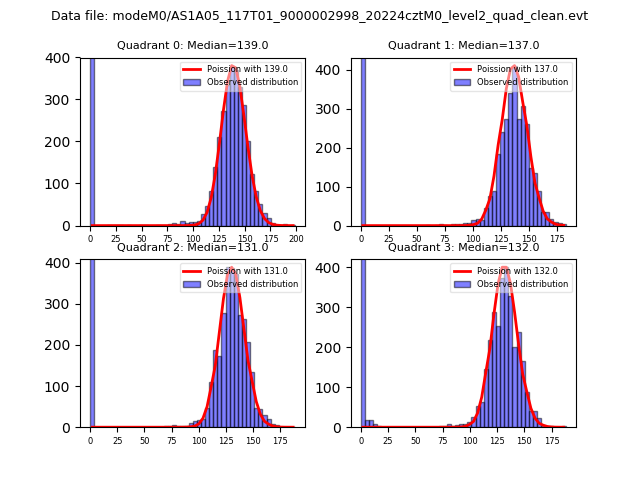 |
 |
| Quadrant-wise count rates Data is divided into 100 sec bins |
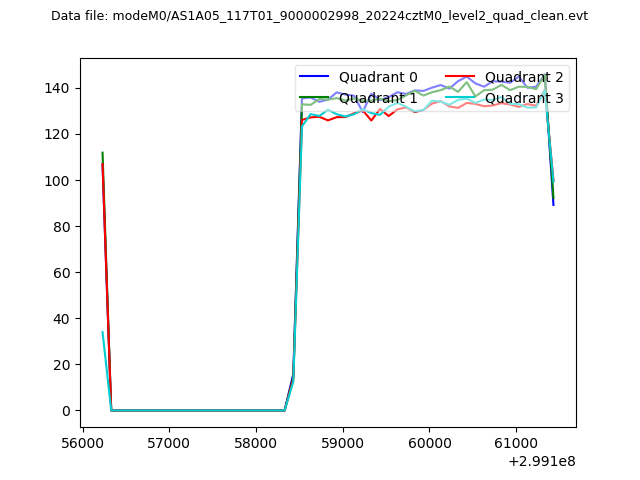 |
|
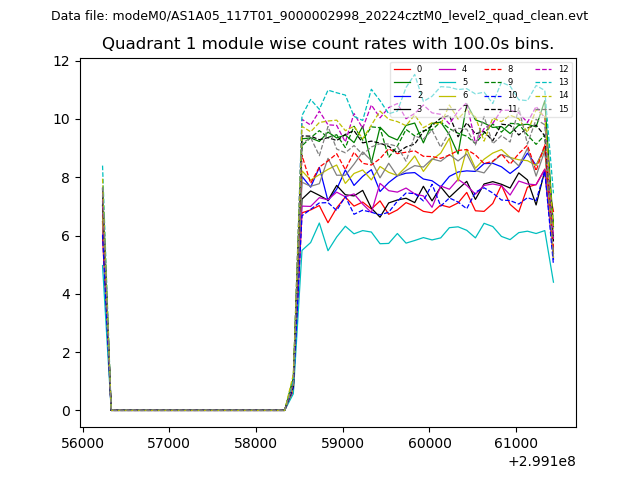
| Module-wise count rates for Quadrant A Data is divided into 100 sec bins |
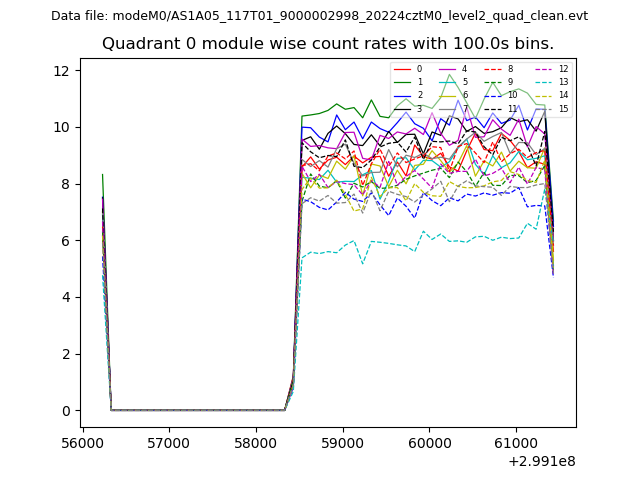 |
 |
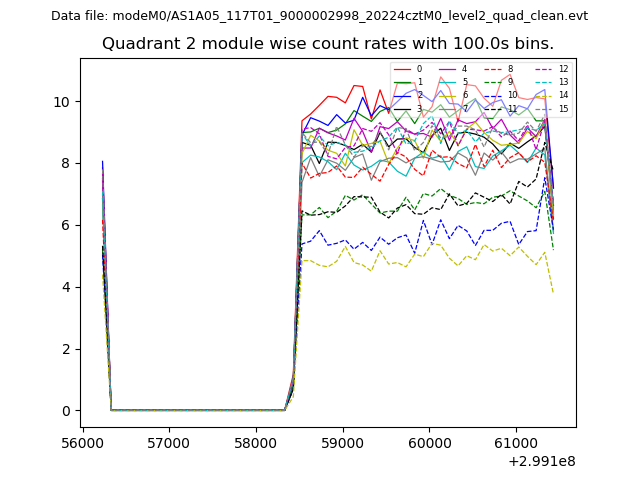
| Module-wise count rates for Quadrant B Data is divided into 100 sec bins |
 |
 |
| Module-wise count rates for Quadrant C Data is divided into 100 sec bins |
 |
 |
| Module-wise count rates for Quadrant D Data is divided into 100 sec bins |
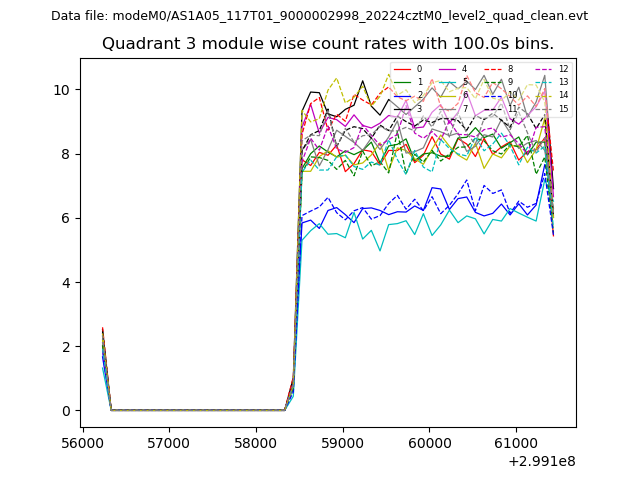 |
 |
| Parameter | Plot |
|---|---|
| CZT HV Monitor | 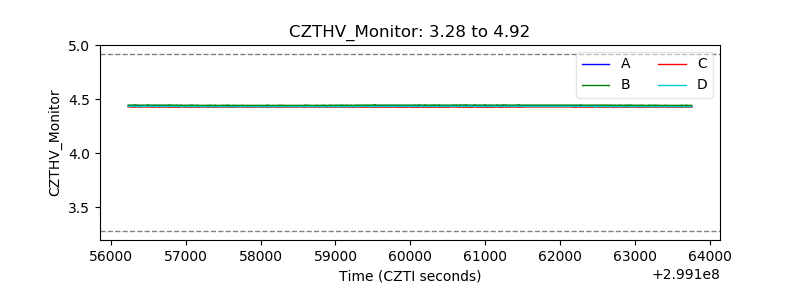 |
| D_VDD | 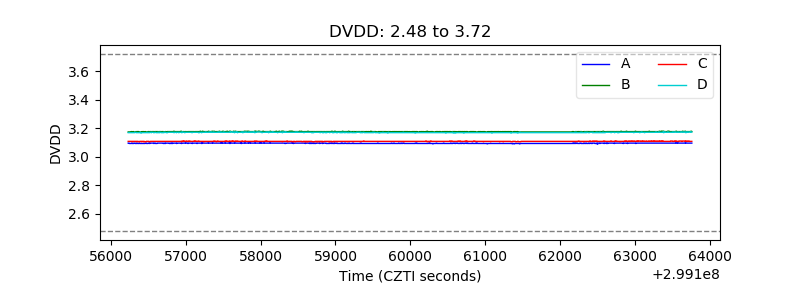 |
| Temperature 1 | 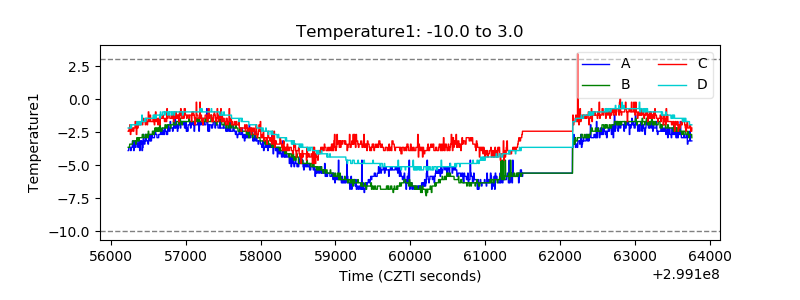 |
| Veto HV Monitor | 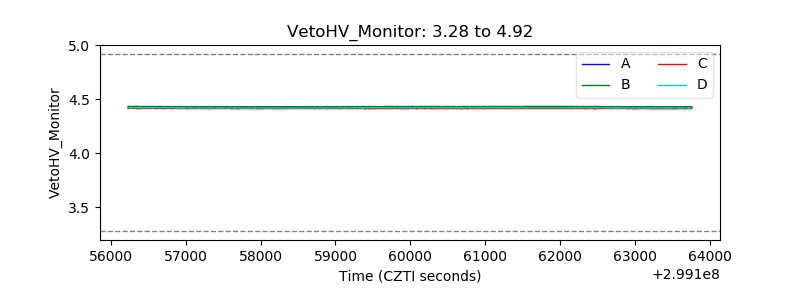 |
| Veto LLD | 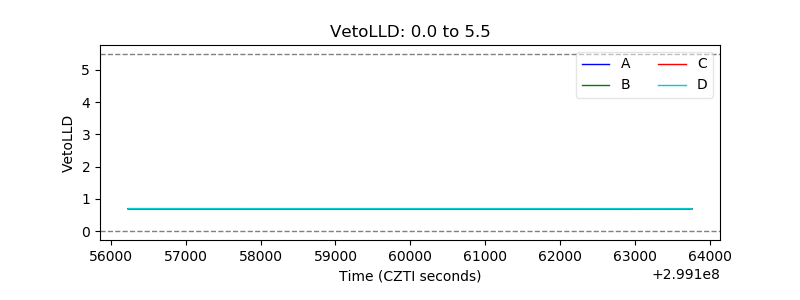 |
| Alpha Counter | 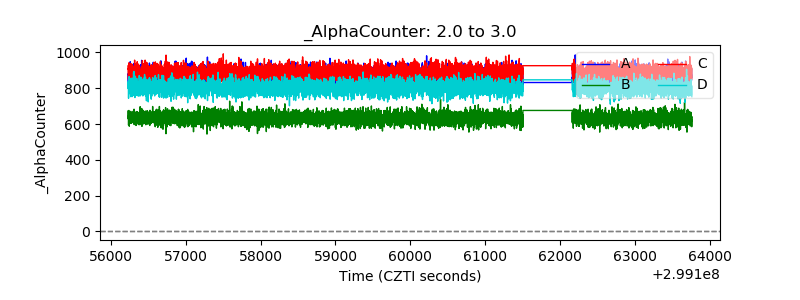 |
| _CPM_Rate | 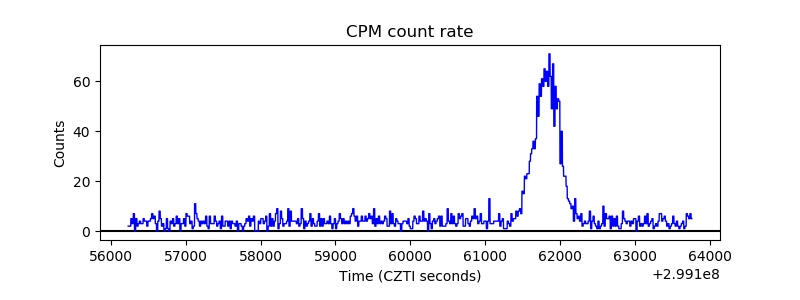 |
| CZT Counter | 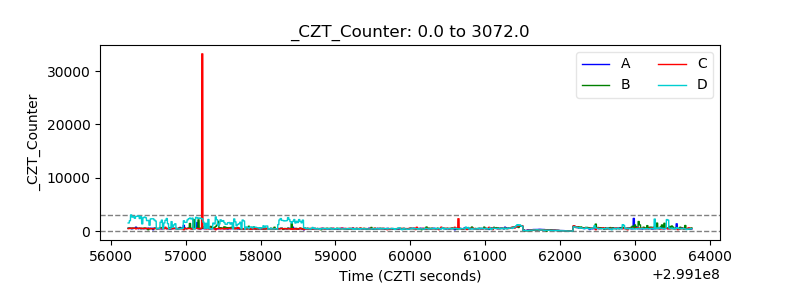 |
| +2.5 Volts monitor |  |
| +5 Volts monitor |  |
| _ROLL_ROT | 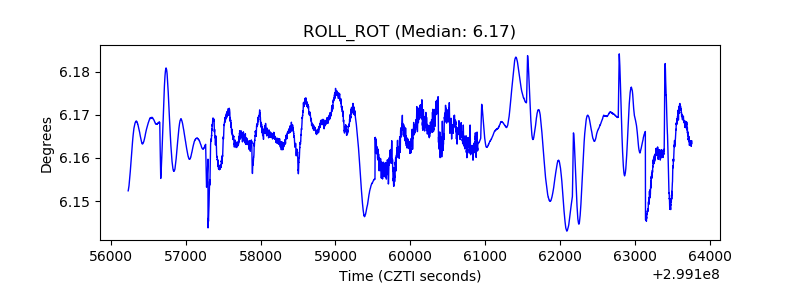 |
| _Roll_DEC | 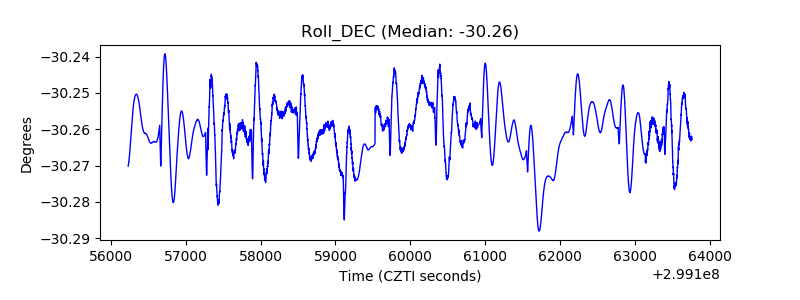 |
| _Roll_RA | 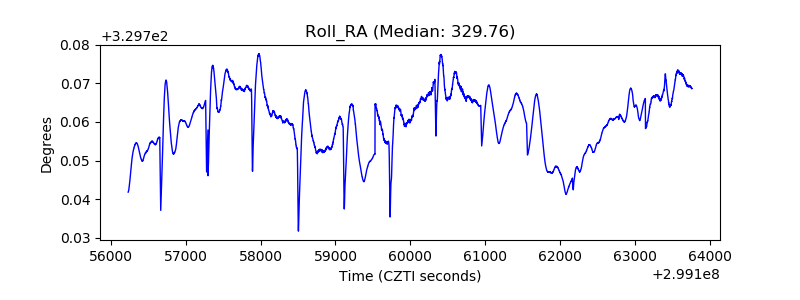 |
| Veto Counter | 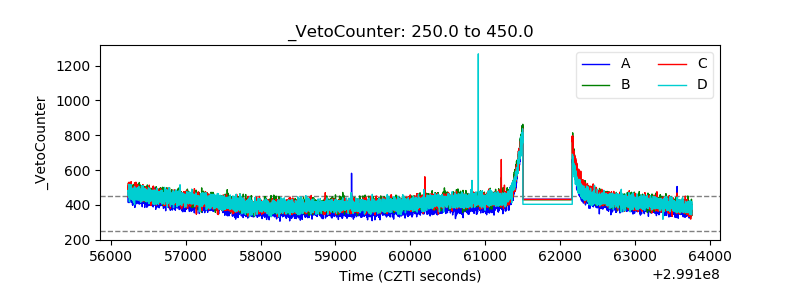 |