| Param | Original file | Final file |
|---|---|---|
| Filename | modeM0/AS1A05_117T01_9000002998_20225cztM0_level2.evt | modeM0/AS1A05_117T01_9000002998_20225cztM0_level2_quad_clean.evt |
| Size (bytes) | 554,984,640 | 79,174,080 |
| Size | 529.3 MB | 75.5 MB |
| Events in quadrant A | 3,886,974 | 480,048 |
| Events in quadrant B | 4,375,079 | 481,065 |
| Events in quadrant C | 3,671,356 | 462,033 |
| Events in quadrant D | 4,373,986 | 460,967 |
| Mode M0 | |||
|---|---|---|---|
| Quadrant | BADHDUFLAG | Total packets | Discarded packets |
| A | 0 | 16204 | 2 |
| B | 0 | 17768 | 2 |
| C | 0 | 15323 | 2 |
| D | 0 | 17630 | 2 |
| Mode SS | |||
|---|---|---|---|
| Quadrant | BADHDUFLAG | Total packets | Discarded packets |
| A | 0 | 152 | 0 |
| B | 0 | 152 | 0 |
| C | 0 | 152 | 0 |
| D | 0 | 152 | 0 |
| Mode M9 | |||
|---|---|---|---|
| Quadrant | BADHDUFLAG | Total packets | Discarded packets |
| A | 0 | 10 | 0 |
| B | 0 | 10 | 0 |
| C | 0 | 10 | 0 |
| D | 0 | 10 | 0 |
| Quadrant | Total seconds | Saturated seconds | Saturation percentage |
|---|---|---|---|
| A | 7372 | 194 | 2.631579% |
| B | 7372 | 236 | 3.201302% |
| C | 7372 | 112 | 1.519262% |
| D | 7373 | 248 | 3.363624% |
Noise dominated data is calculated using 1-second bins in cleaned event files. If a bin has >2000 counts, and if more than 50% of those come from <1% of pixels, then it is considered to be noise-dominated and hence unusable.
| Quadrant | # 1 sec bins | Bins with >0 counts | Bins with >2000 counts | High rate bins dominated by noise | Noise dominated (total time) | Noise dominated (detector-on time) | Marked lightcurve |
|---|---|---|---|---|---|---|---|
| A | 8442 | 7374 | 73 | 73 | 0.86% | 0.99% |  |
| B | 8442 | 7374 | 65 | 65 | 0.77% | 0.88% |  |
| C | 8442 | 7374 | 0 | 0 | 0.00% | 0.00% | 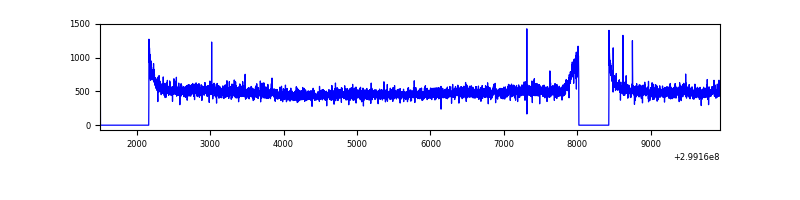 |
| D | 8443 | 7375 | 167 | 167 | 1.98% | 2.26% | 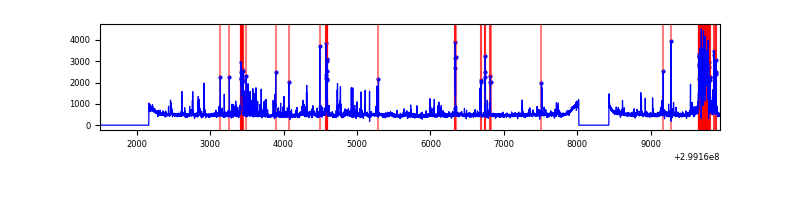 |
Top three noisy pixels from each quadrant. If the there are fewer than three noisy pixels in the level2.evt file, extra rows are filled as -1
| Pixel properties | Quadrant properties | ||||||
|---|---|---|---|---|---|---|---|
| Quadrant | DetID | PixID | Counts | Sigma | Mean | Median | Sigma |
| A | 14 | 238 | 323460 | 1726.89 | 917 | 897 | 186.8 |
| A | 4 | 2 | 13420 | 67.04 | 917 | 897 | 186.8 |
| A | 10 | 253 | 12774 | 63.59 | 917 | 897 | 186.8 |
| B | 7 | 220 | 501958 | 2863.34 | 907 | 884 | 175.0 |
| B | 6 | 36 | 116238 | 659.18 | 907 | 884 | 175.0 |
| B | 10 | 245 | 73554 | 415.27 | 907 | 884 | 175.0 |
| C | 14 | 238 | 135188 | 647.49 | 880 | 886 | 207.4 |
| C | 3 | 233 | 84815 | 404.64 | 880 | 886 | 207.4 |
| C | 1 | 16 | 14907 | 67.6 | 880 | 886 | 207.4 |
| D | 12 | 17 | 439409 | 2015.22 | 890 | 865 | 217.6 |
| D | 1 | 52 | 194791 | 891.14 | 890 | 865 | 217.6 |
| D | 12 | 218 | 85324 | 388.11 | 890 | 865 | 217.6 |
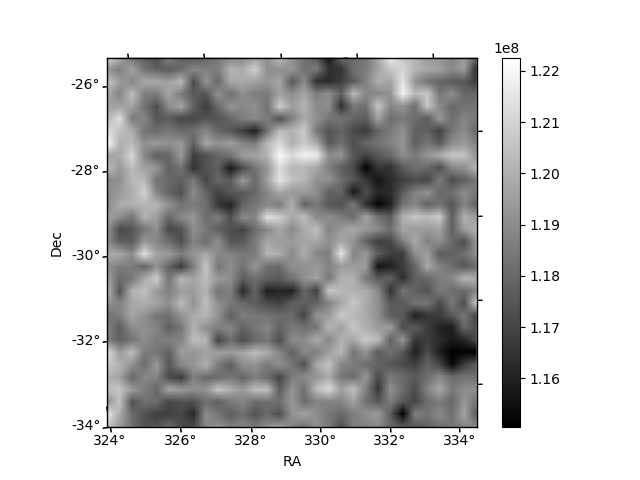
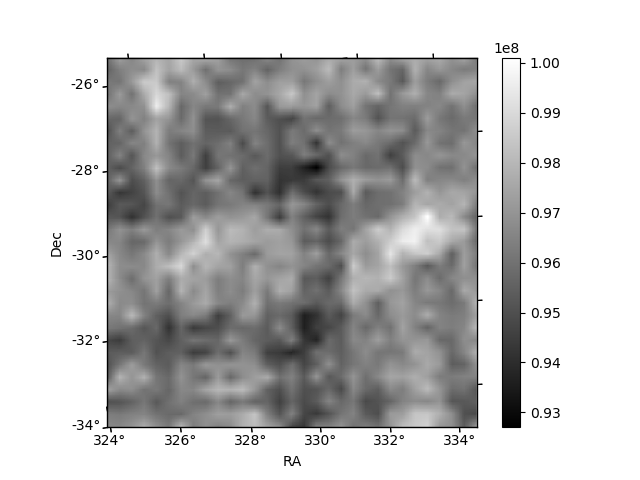
Histogram calculated using DETX and DETY for each event in the final _common_clean file
| Quadrant A | 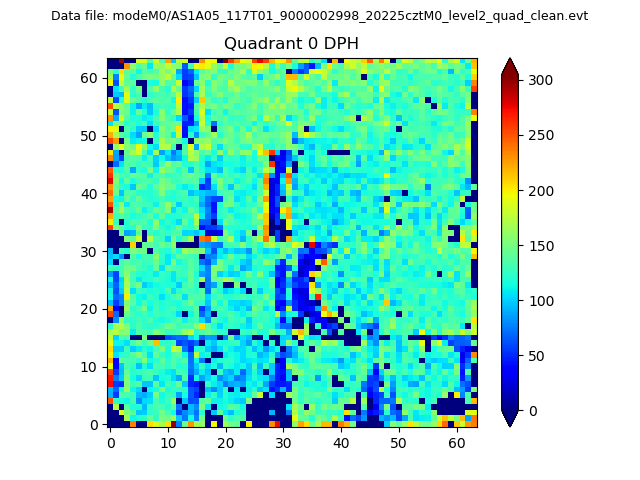 |
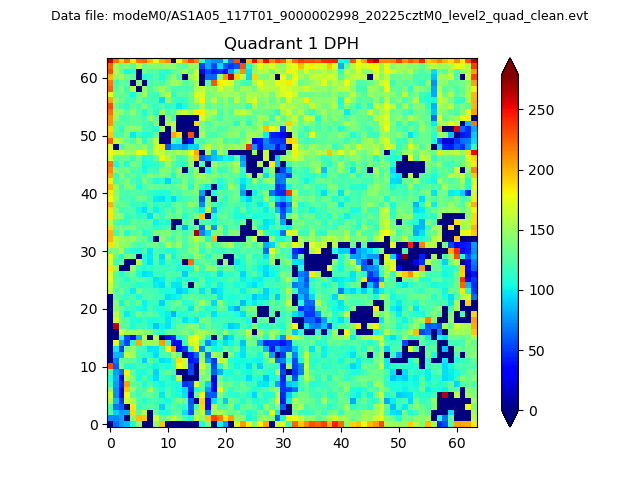 |
Quadrant B |
|---|---|---|---|
| Quadrant D |  |
 |
Quadrant C |
| Plot type | Count rate plots | Images |
|---|---|---|
| Comparison with Poisson distribution Blue bars denote a histogram of data divided into 1 sec bins. Red curve is a Poisson curve with rate = median count rate of data. |
 |
 |
| Quadrant-wise count rates Data is divided into 100 sec bins |
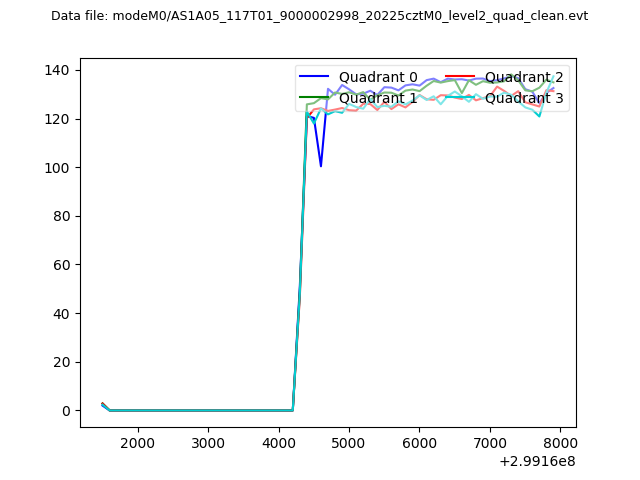 |
|
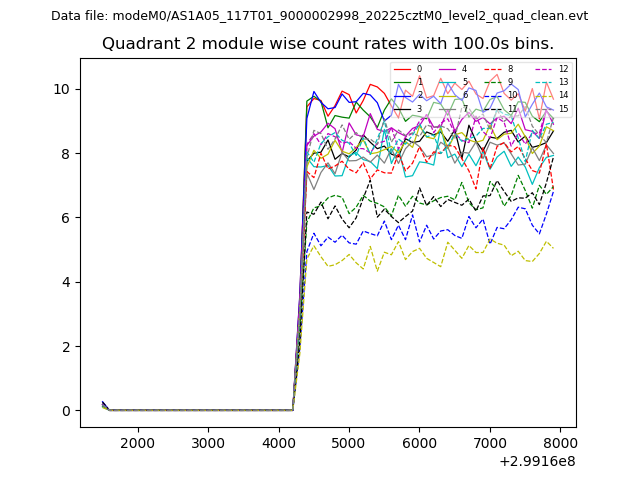
| Module-wise count rates for Quadrant A Data is divided into 100 sec bins |
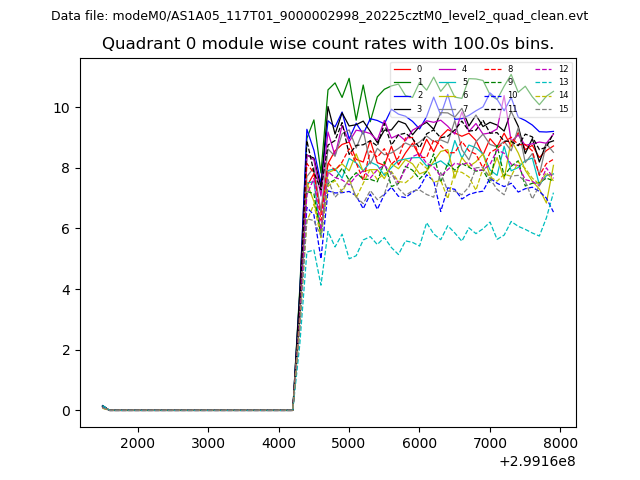 |
 |
| Module-wise count rates for Quadrant B Data is divided into 100 sec bins |
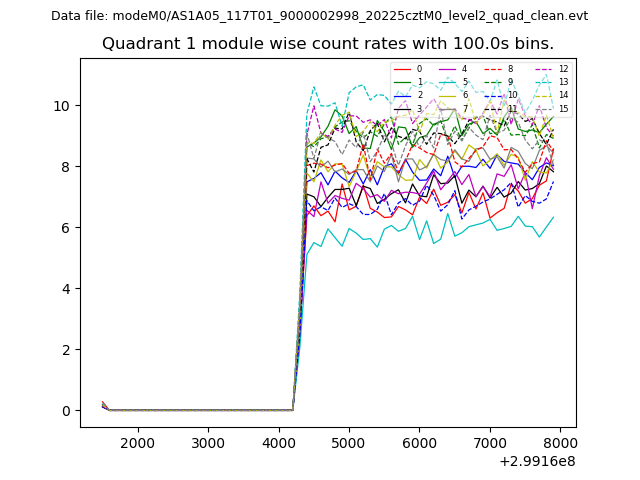 |
 |
| Module-wise count rates for Quadrant C Data is divided into 100 sec bins |
 |
 |
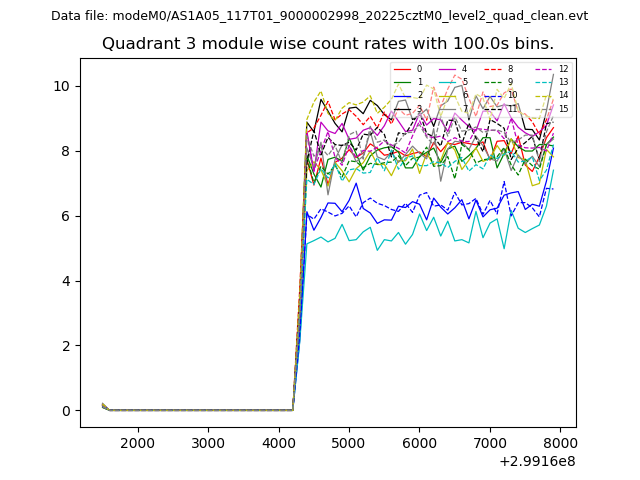
| Module-wise count rates for Quadrant D Data is divided into 100 sec bins |
 |
 |
| Parameter | Plot |
|---|---|
| CZT HV Monitor | 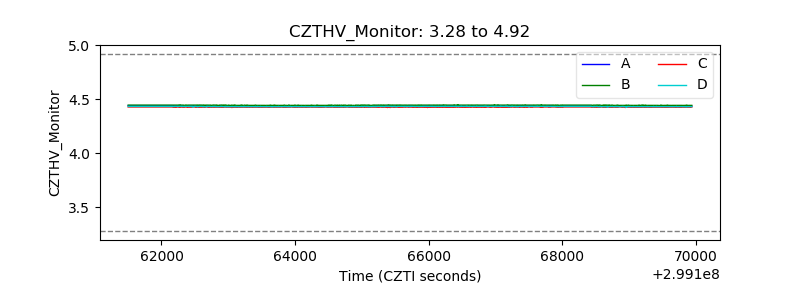 |
| D_VDD |  |
| Temperature 1 | 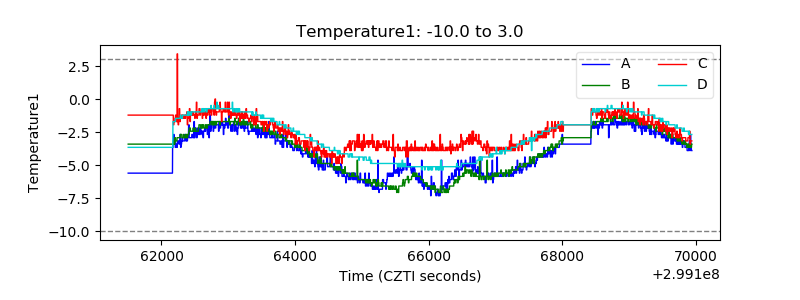 |
| Veto HV Monitor |  |
| Veto LLD | 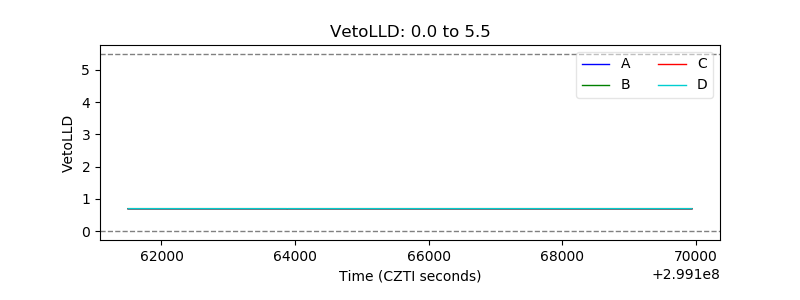 |
| Alpha Counter | 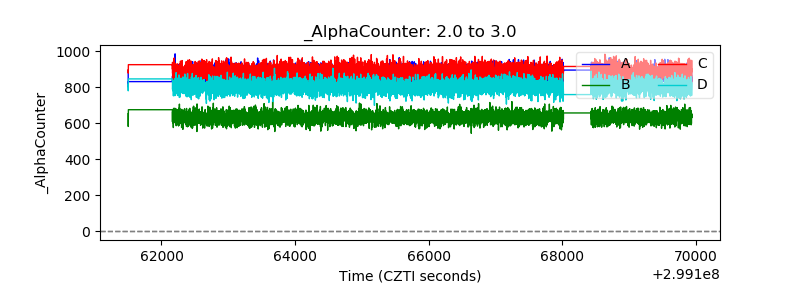 |
| _CPM_Rate | 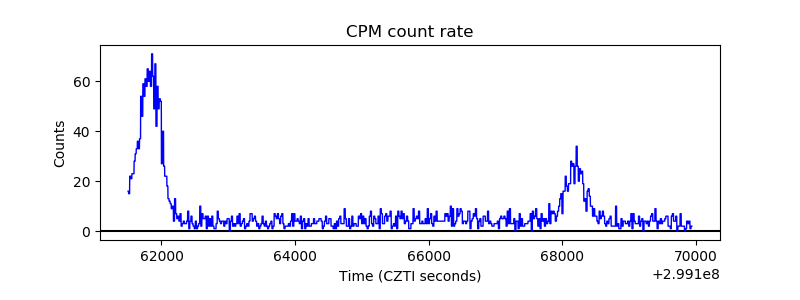 |
| CZT Counter | 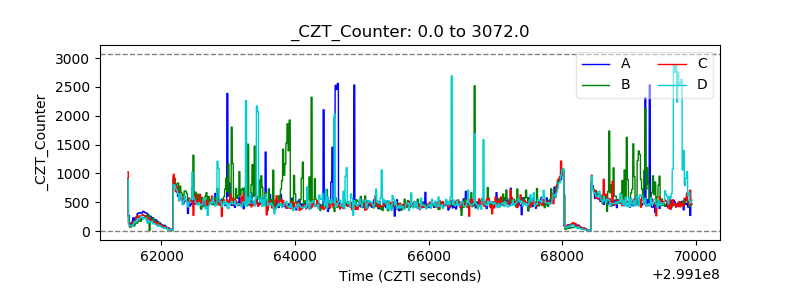 |
| +2.5 Volts monitor |  |
| +5 Volts monitor |  |
| _ROLL_ROT | 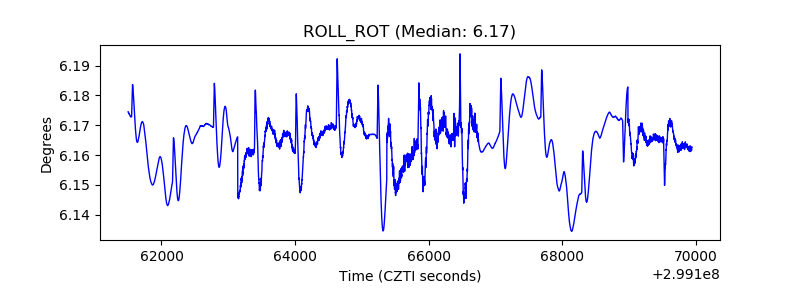 |
| _Roll_DEC | 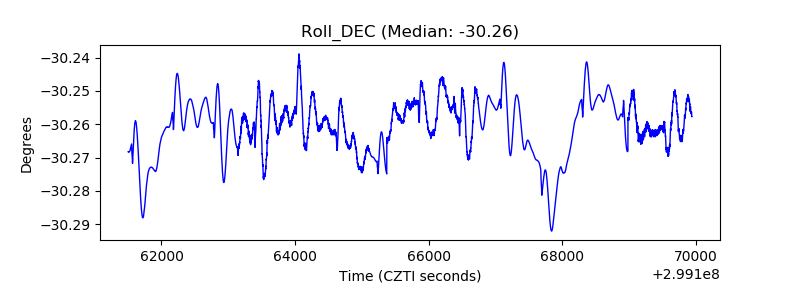 |
| _Roll_RA | 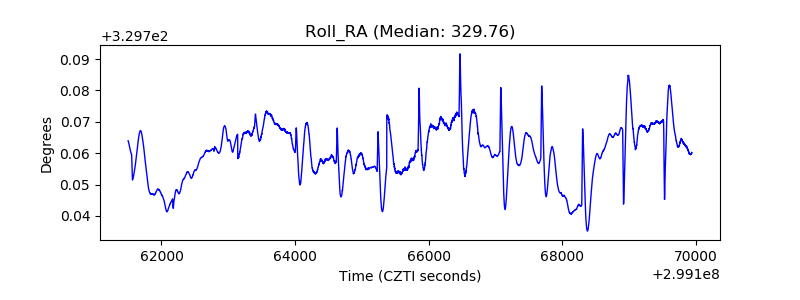 |
| Veto Counter | 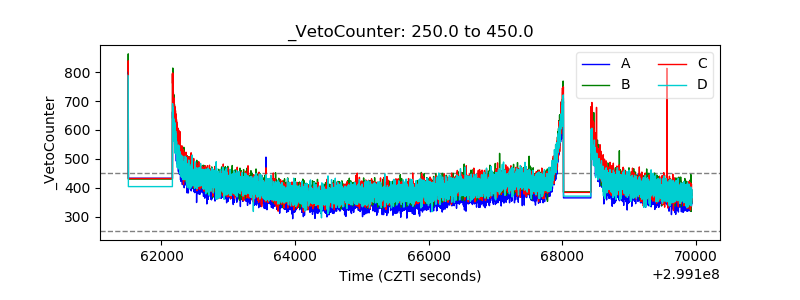 |