| Param | Original file | Final file |
|---|---|---|
| Filename | modeM0/AS1A05_117T01_9000002998_20226cztM0_level2.evt | modeM0/AS1A05_117T01_9000002998_20226cztM0_level2_quad_clean.evt |
| Size (bytes) | 563,019,840 | 84,813,120 |
| Size | 536.9 MB | 80.9 MB |
| Events in quadrant A | 3,805,358 | 521,358 |
| Events in quadrant B | 4,401,931 | 518,445 |
| Events in quadrant C | 3,858,272 | 496,502 |
| Events in quadrant D | 4,466,245 | 499,562 |
| Mode M0 | |||
|---|---|---|---|
| Quadrant | BADHDUFLAG | Total packets | Discarded packets |
| A | 0 | 16202 | 2 |
| B | 0 | 18120 | 2 |
| C | 0 | 16097 | 2 |
| D | 0 | 18339 | 2 |
| Mode SS | |||
|---|---|---|---|
| Quadrant | BADHDUFLAG | Total packets | Discarded packets |
| A | 0 | 156 | 0 |
| B | 0 | 156 | 0 |
| C | 0 | 156 | 0 |
| D | 0 | 156 | 0 |
| Mode M9 | |||
|---|---|---|---|
| Quadrant | BADHDUFLAG | Total packets | Discarded packets |
| A | 0 | 8 | 0 |
| B | 0 | 8 | 0 |
| C | 0 | 8 | 0 |
| D | 0 | 8 | 0 |
| Quadrant | Total seconds | Saturated seconds | Saturation percentage |
|---|---|---|---|
| A | 7656 | 160 | 2.089864% |
| B | 7656 | 259 | 3.382968% |
| C | 7656 | 187 | 2.442529% |
| D | 7656 | 277 | 3.618077% |
Noise dominated data is calculated using 1-second bins in cleaned event files. If a bin has >2000 counts, and if more than 50% of those come from <1% of pixels, then it is considered to be noise-dominated and hence unusable.
| Quadrant | # 1 sec bins | Bins with >0 counts | Bins with >2000 counts | High rate bins dominated by noise | Noise dominated (total time) | Noise dominated (detector-on time) | Marked lightcurve |
|---|---|---|---|---|---|---|---|
| A | 8421 | 7659 | 22 | 22 | 0.26% | 0.29% | 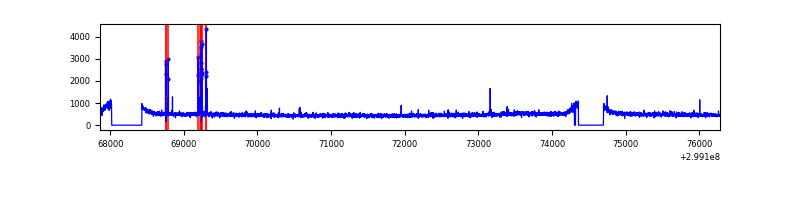 |
| B | 8421 | 7659 | 36 | 36 | 0.43% | 0.47% | 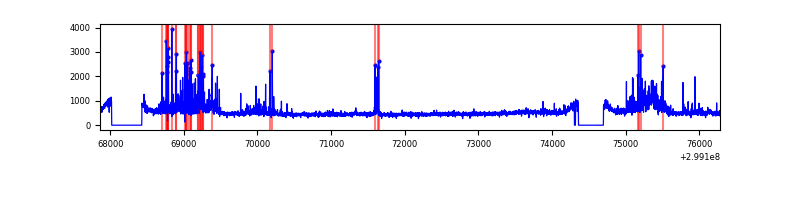 |
| C | 8421 | 7659 | 0 | 0 | 0.00% | 0.00% | 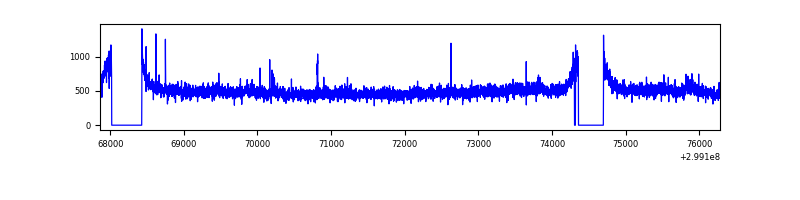 |
| D | 8421 | 7659 | 171 | 171 | 2.03% | 2.23% | 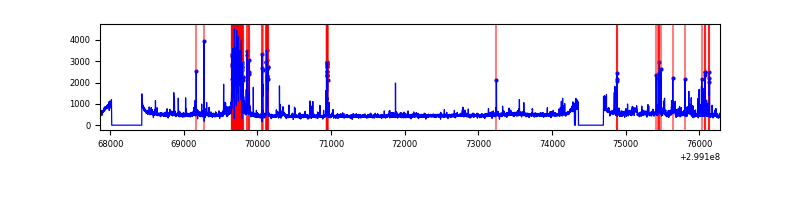 |
Top three noisy pixels from each quadrant. If the there are fewer than three noisy pixels in the level2.evt file, extra rows are filled as -1
| Pixel properties | Quadrant properties | ||||||
|---|---|---|---|---|---|---|---|
| Quadrant | DetID | PixID | Counts | Sigma | Mean | Median | Sigma |
| A | 14 | 238 | 97367 | 491.86 | 961 | 939 | 196.0 |
| A | 0 | 226 | 8124 | 36.65 | 961 | 939 | 196.0 |
| A | 3 | 137 | 7850 | 35.25 | 961 | 939 | 196.0 |
| B | 0 | 197 | 203594 | 1109.97 | 946 | 922 | 182.6 |
| B | 6 | 36 | 185286 | 1009.7 | 946 | 922 | 182.6 |
| B | 7 | 220 | 173615 | 945.78 | 946 | 922 | 182.6 |
| C | 14 | 238 | 141642 | 650.05 | 914 | 920 | 216.5 |
| C | 3 | 233 | 137224 | 629.64 | 914 | 920 | 216.5 |
| C | 1 | 16 | 14514 | 62.79 | 914 | 920 | 216.5 |
| D | 12 | 17 | 428249 | 1894.7 | 929 | 903 | 225.5 |
| D | 7 | 238 | 113486 | 499.15 | 929 | 903 | 225.5 |
| D | 13 | 249 | 92826 | 407.55 | 929 | 903 | 225.5 |
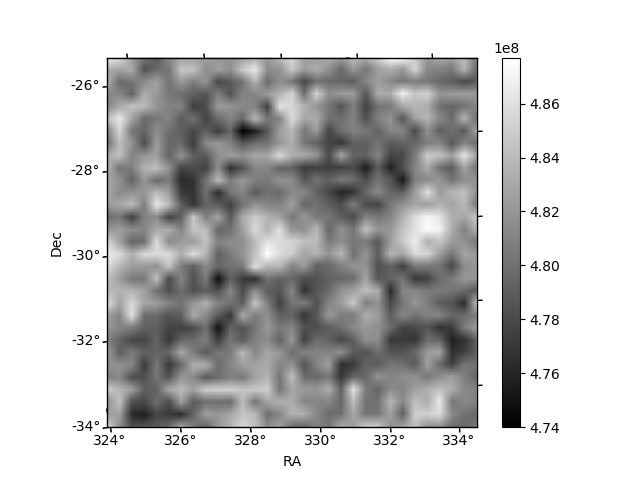
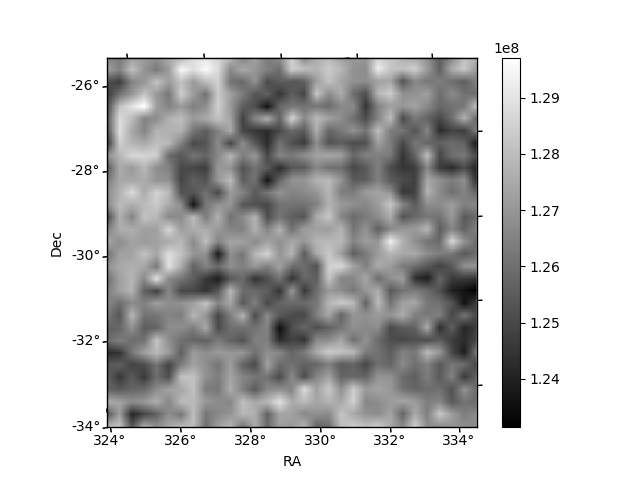
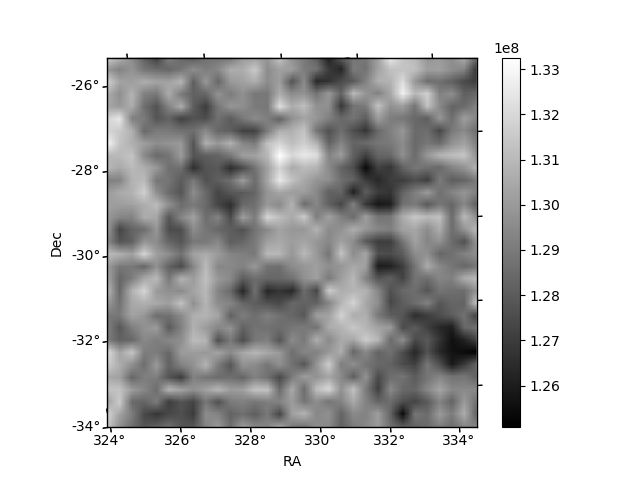
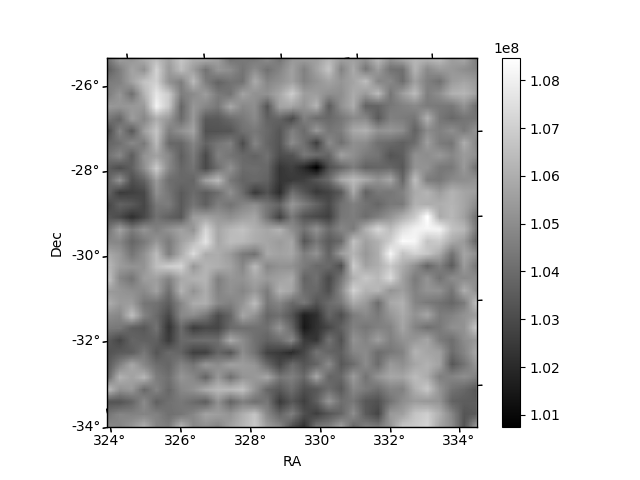
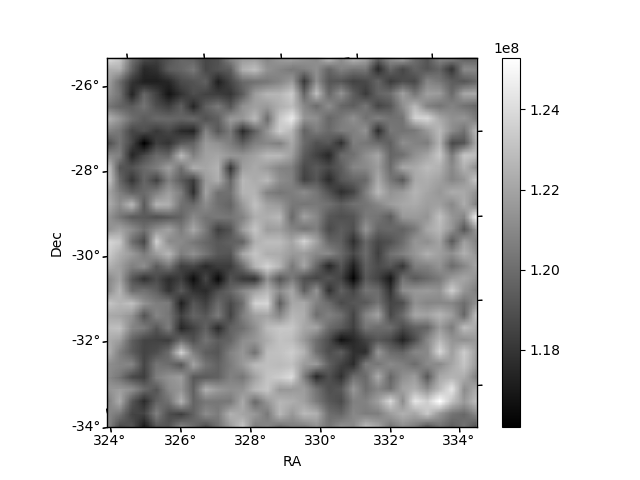
Histogram calculated using DETX and DETY for each event in the final _common_clean file
| Quadrant A | 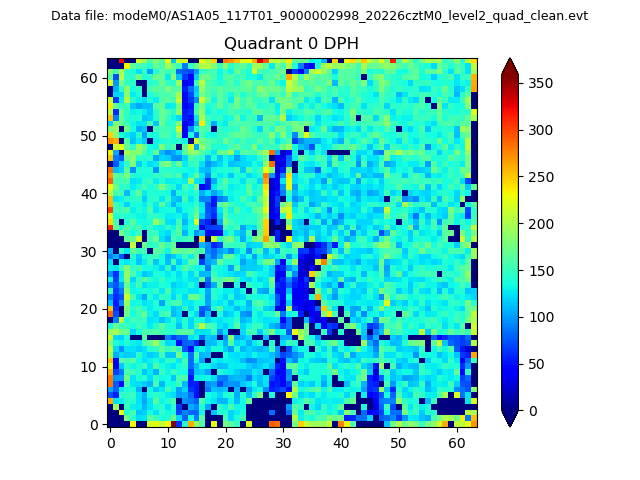 |
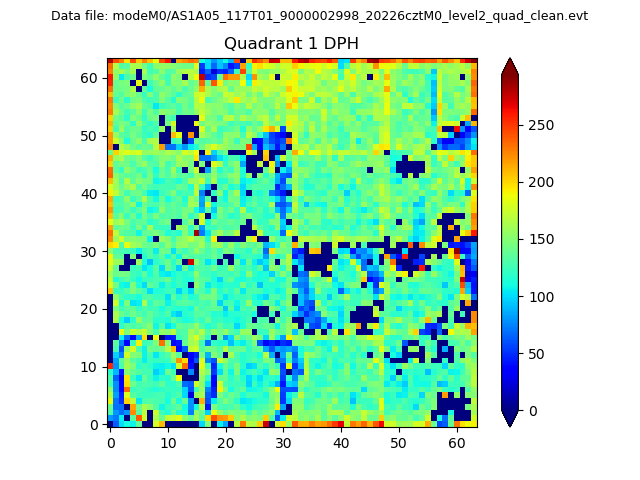 |
Quadrant B |
|---|---|---|---|
| Quadrant D | 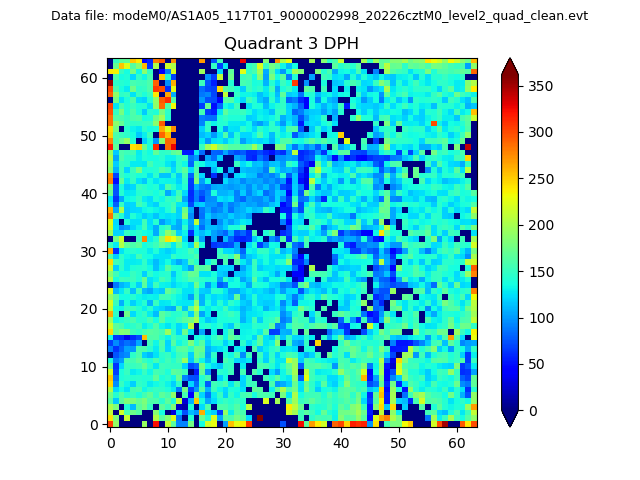 |
 |
Quadrant C |
| Plot type | Count rate plots | Images |
|---|---|---|
| Comparison with Poisson distribution Blue bars denote a histogram of data divided into 1 sec bins. Red curve is a Poisson curve with rate = median count rate of data. |
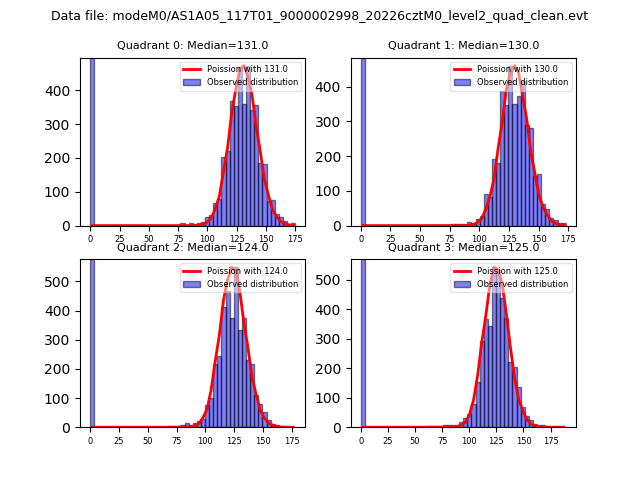 |
 |
| Quadrant-wise count rates Data is divided into 100 sec bins |
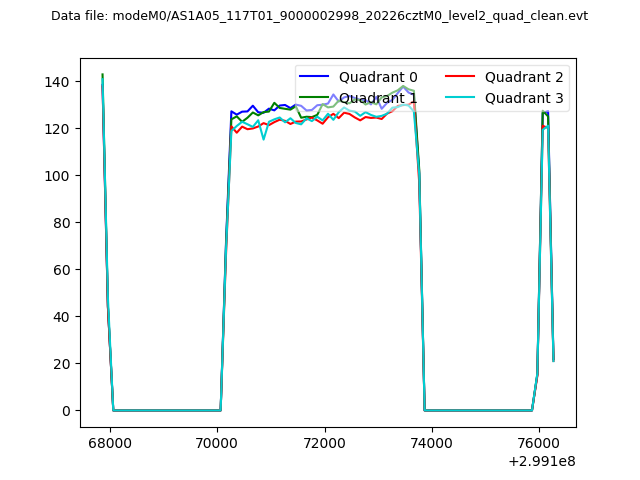 |
|
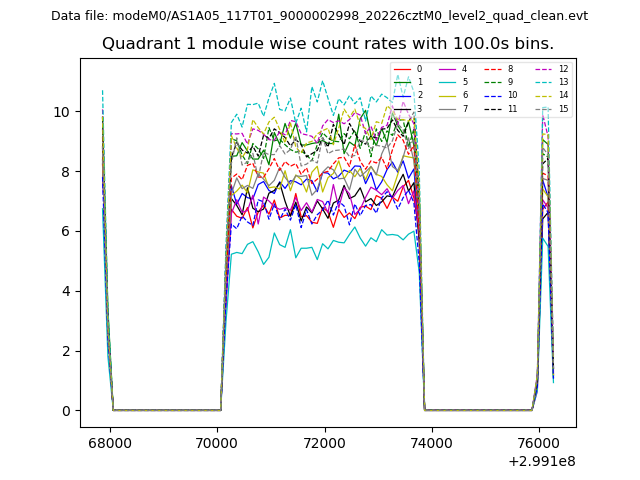
| Module-wise count rates for Quadrant A Data is divided into 100 sec bins |
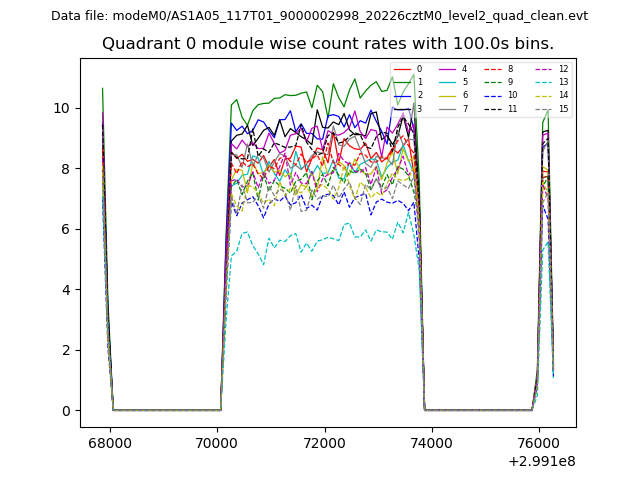 |
 |
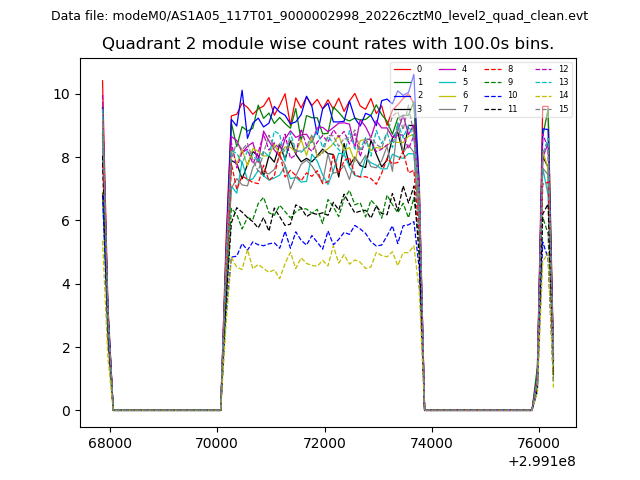
| Module-wise count rates for Quadrant B Data is divided into 100 sec bins |
 |
 |
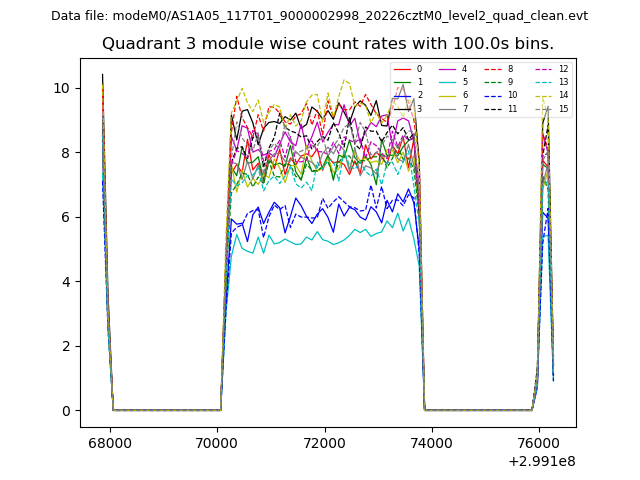
| Module-wise count rates for Quadrant C Data is divided into 100 sec bins |
 |
 |
| Module-wise count rates for Quadrant D Data is divided into 100 sec bins |
 |
 |
| Parameter | Plot |
|---|---|
| CZT HV Monitor | 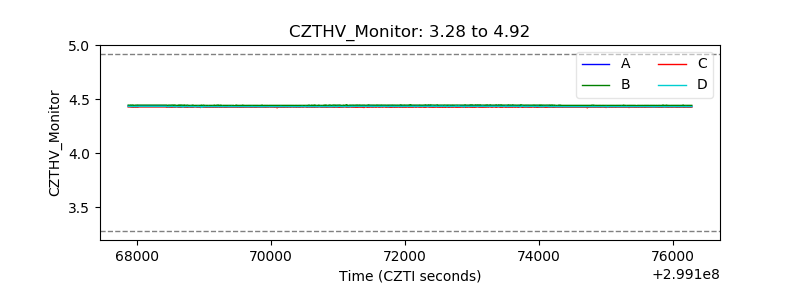 |
| D_VDD | 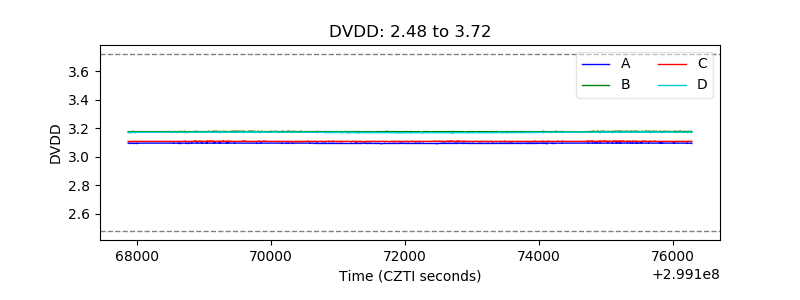 |
| Temperature 1 | 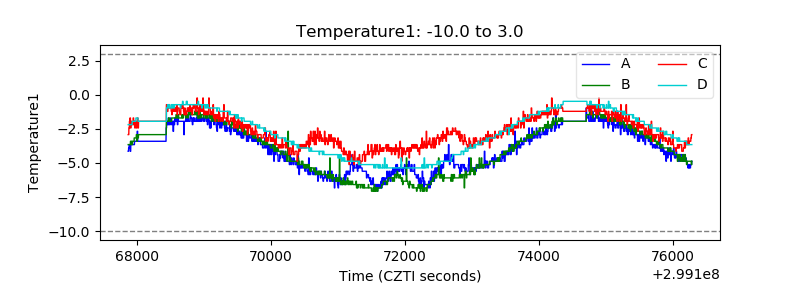 |
| Veto HV Monitor | 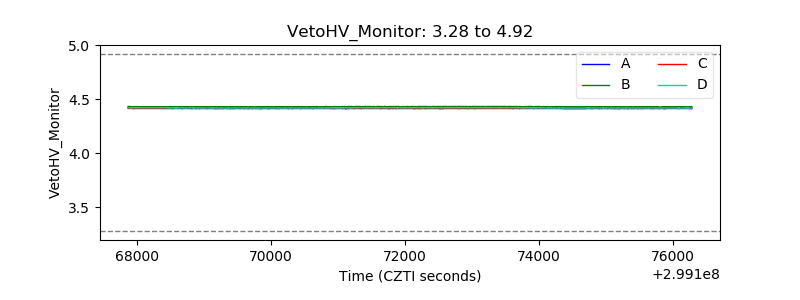 |
| Veto LLD | 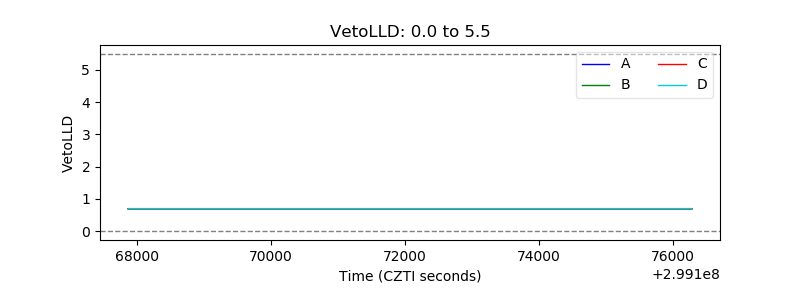 |
| Alpha Counter | 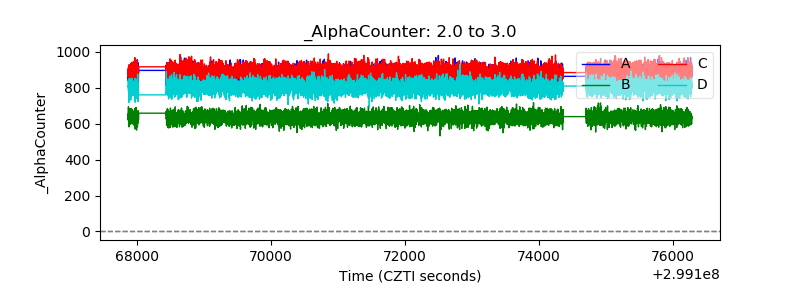 |
| _CPM_Rate | 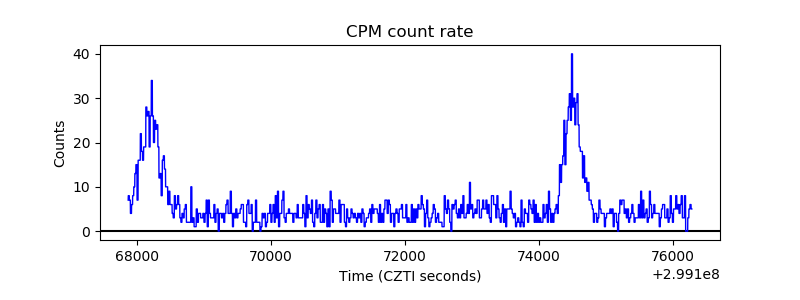 |
| CZT Counter | 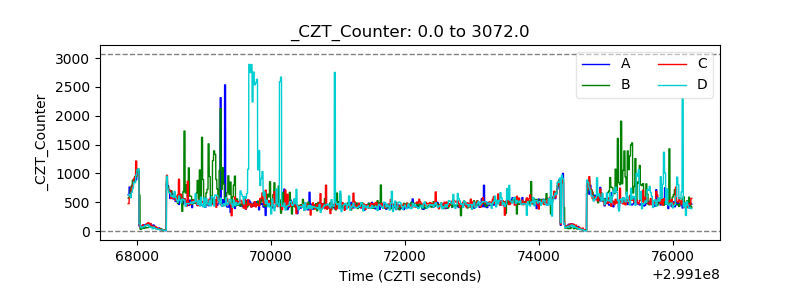 |
| +2.5 Volts monitor |  |
| +5 Volts monitor |  |
| _ROLL_ROT | 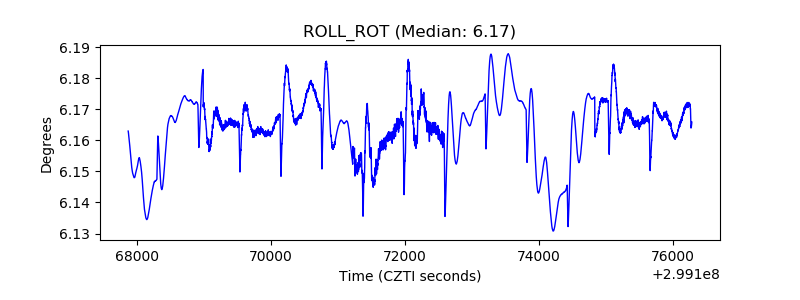 |
| _Roll_DEC | 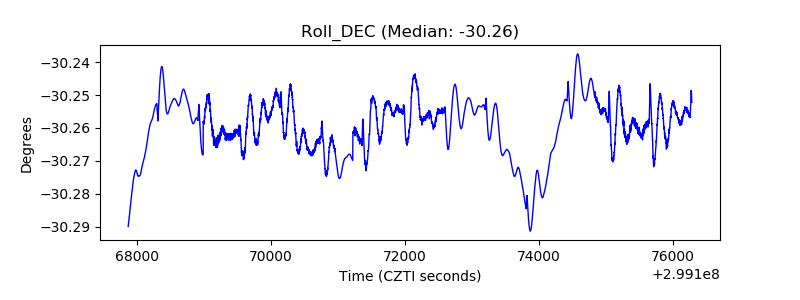 |
| _Roll_RA | 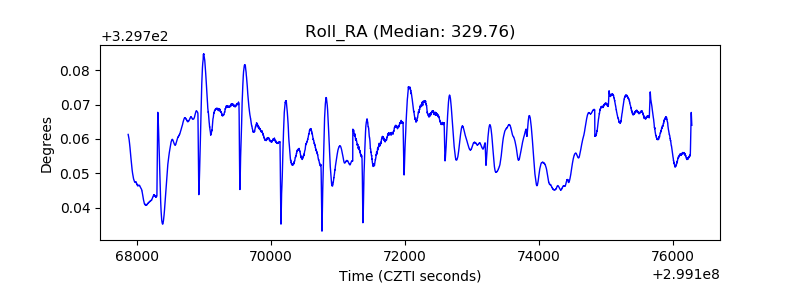 |
| Veto Counter | 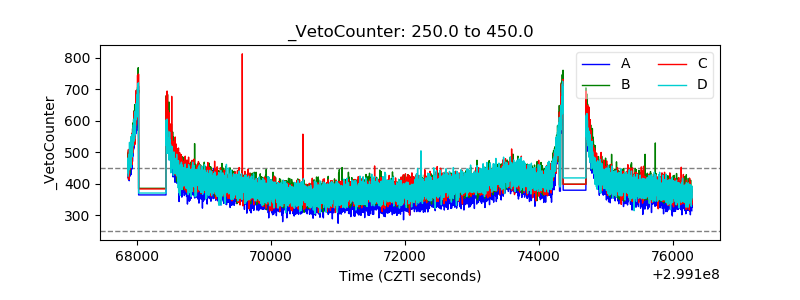 |