| Param | Original file | Final file |
|---|---|---|
| Filename | modeM0/AS1A05_117T01_9000002998_20229cztM0_level2.evt | modeM0/AS1A05_117T01_9000002998_20229cztM0_level2_quad_clean.evt |
| Size (bytes) | 1,459,872,000 | 239,774,400 |
| Size | 1.4 GB | 228.7 MB |
| Events in quadrant A | 8,796,395 | 1,567,026 |
| Events in quadrant B | 9,666,792 | 1,560,555 |
| Events in quadrant C | 8,992,863 | 1,502,621 |
| Events in quadrant D | 15,520,887 | 1,370,615 |
| Mode M0 | |||
|---|---|---|---|
| Quadrant | BADHDUFLAG | Total packets | Discarded packets |
| A | 0 | 37926 | 4 |
| B | 0 | 40752 | 4 |
| C | 0 | 37854 | 4 |
| D | 0 | 58290 | 4 |
| Mode SS | |||
|---|---|---|---|
| Quadrant | BADHDUFLAG | Total packets | Discarded packets |
| A | 0 | 374 | 0 |
| B | 0 | 374 | 0 |
| C | 0 | 374 | 0 |
| D | 0 | 374 | 0 |
| Mode M9 | |||
|---|---|---|---|
| Quadrant | BADHDUFLAG | Total packets | Discarded packets |
| A | 0 | 22 | 0 |
| B | 0 | 23 | 0 |
| C | 0 | 23 | 0 |
| D | 0 | 23 | 0 |
| Quadrant | Total seconds | Saturated seconds | Saturation percentage |
|---|---|---|---|
| A | 18298 | 125 | 0.683135% |
| B | 18298 | 278 | 1.519292% |
| C | 18298 | 188 | 1.027435% |
| D | 18298 | 2024 | 11.061318% |
Noise dominated data is calculated using 1-second bins in cleaned event files. If a bin has >2000 counts, and if more than 50% of those come from <1% of pixels, then it is considered to be noise-dominated and hence unusable.
| Quadrant | # 1 sec bins | Bins with >0 counts | Bins with >2000 counts | High rate bins dominated by noise | Noise dominated (total time) | Noise dominated (detector-on time) | Marked lightcurve |
|---|---|---|---|---|---|---|---|
| A | 20283 | 18301 | 25 | 25 | 0.12% | 0.14% | 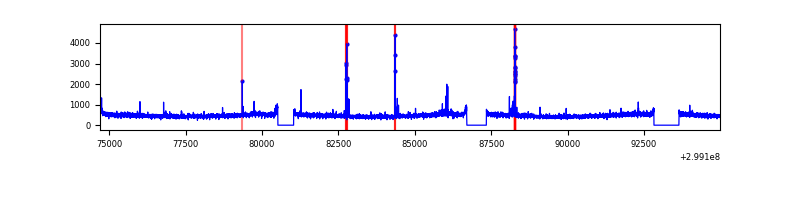 |
| B | 20283 | 18301 | 45 | 45 | 0.22% | 0.25% | 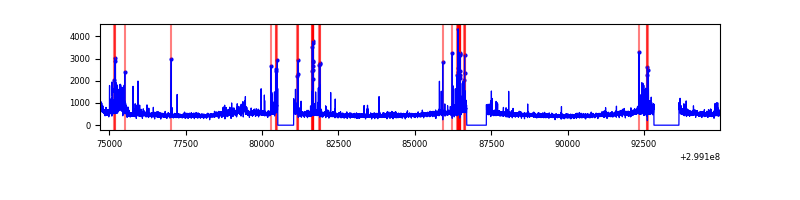 |
| C | 20283 | 18301 | 1 | 1 | 0.00% | 0.01% | 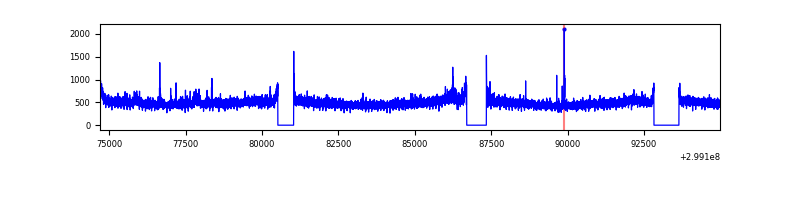 |
| D | 20283 | 18301 | 1852 | 1852 | 9.13% | 10.12% | 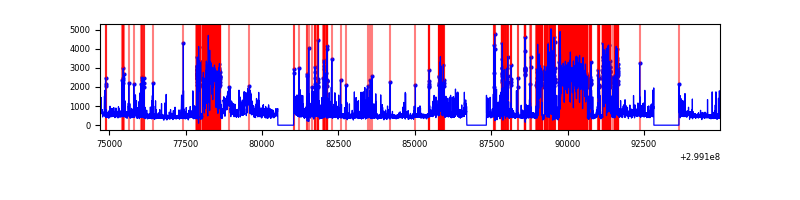 |
Top three noisy pixels from each quadrant. If the there are fewer than three noisy pixels in the level2.evt file, extra rows are filled as -1
| Pixel properties | Quadrant properties | ||||||
|---|---|---|---|---|---|---|---|
| Quadrant | DetID | PixID | Counts | Sigma | Mean | Median | Sigma |
| A | 14 | 238 | 109442 | 239.87 | 2220 | 2175 | 447.2 |
| A | 10 | 253 | 76295 | 165.75 | 2220 | 2175 | 447.2 |
| A | 4 | 2 | 68141 | 147.51 | 2220 | 2175 | 447.2 |
| B | 7 | 220 | 285874 | 682.99 | 2196 | 2140 | 415.4 |
| B | 0 | 197 | 225650 | 538.02 | 2196 | 2140 | 415.4 |
| B | 0 | 198 | 176637 | 420.04 | 2196 | 2140 | 415.4 |
| C | 3 | 233 | 342171 | 682.94 | 2127 | 2142 | 497.9 |
| C | 14 | 238 | 332147 | 662.81 | 2127 | 2142 | 497.9 |
| C | 13 | 61 | 15031 | 25.89 | 2127 | 2142 | 497.9 |
| D | 7 | 238 | 4945316 | 9783.78 | 2079 | 2020 | 505.3 |
| D | 1 | 52 | 1549903 | 3063.57 | 2079 | 2020 | 505.3 |
| D | 12 | 218 | 284305 | 558.7 | 2079 | 2020 | 505.3 |
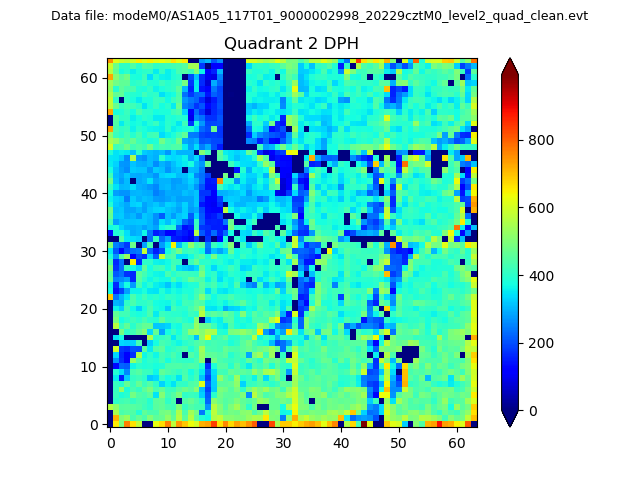
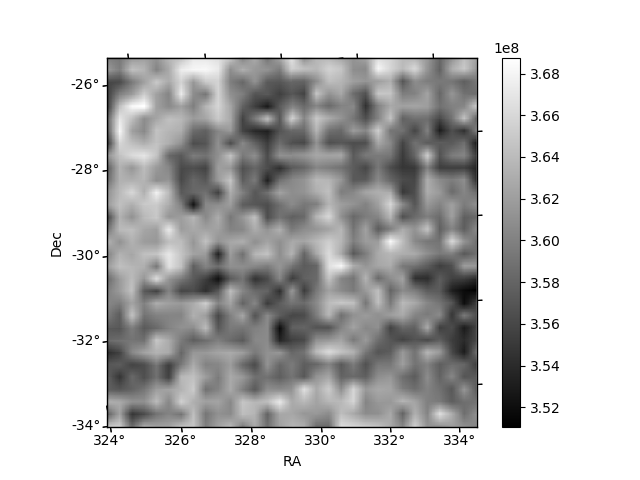
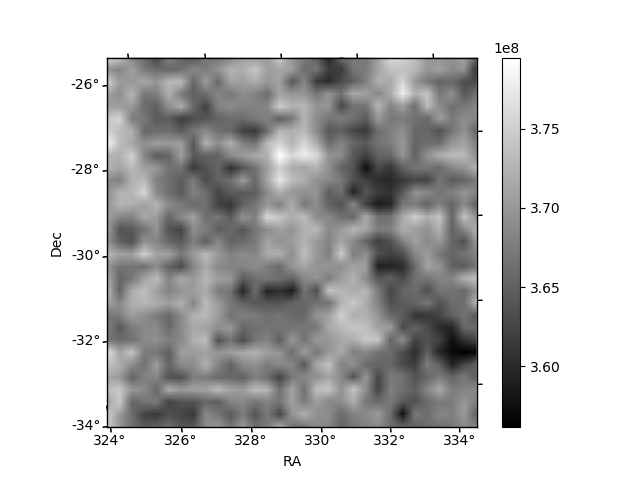
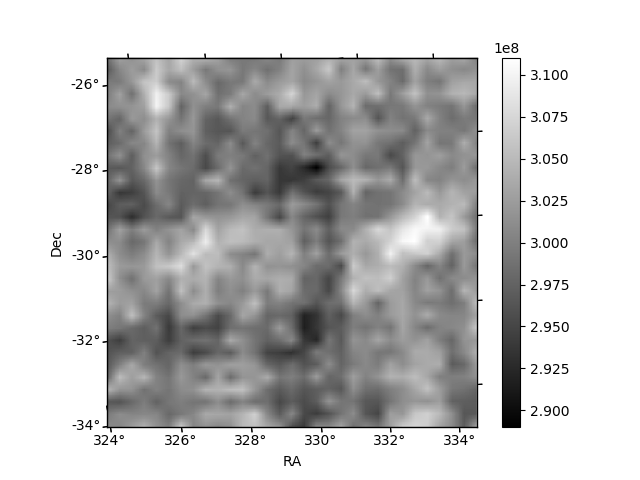
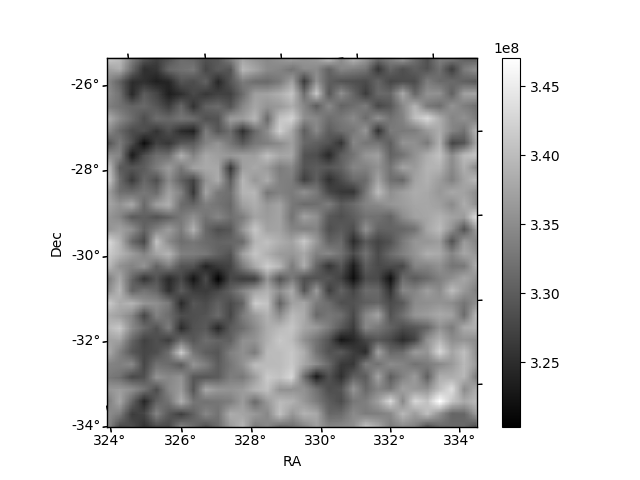
Histogram calculated using DETX and DETY for each event in the final _common_clean file
| Quadrant A | 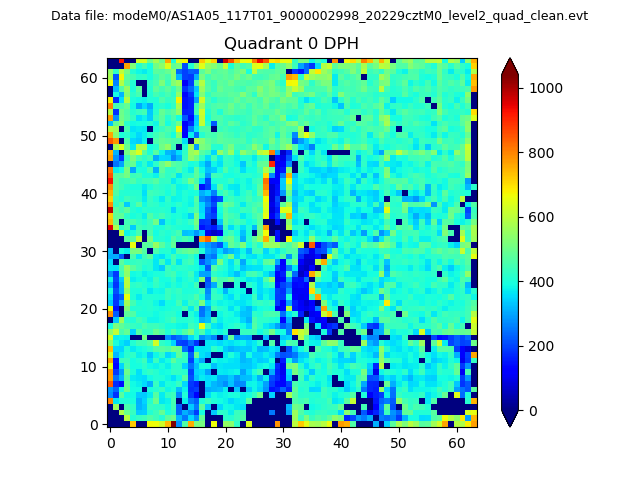 |
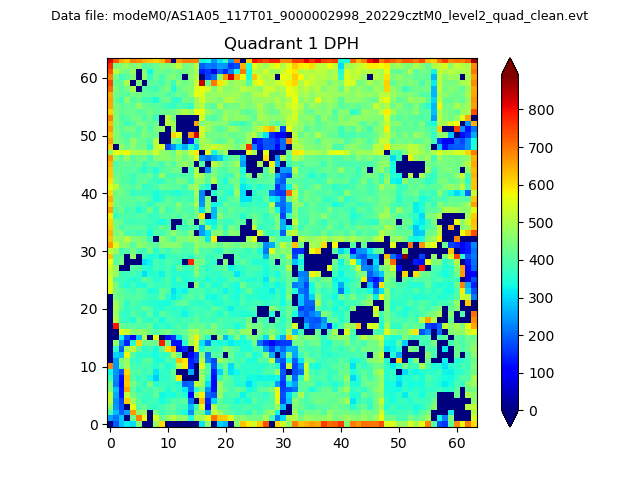 |
Quadrant B |
|---|---|---|---|
| Quadrant D | 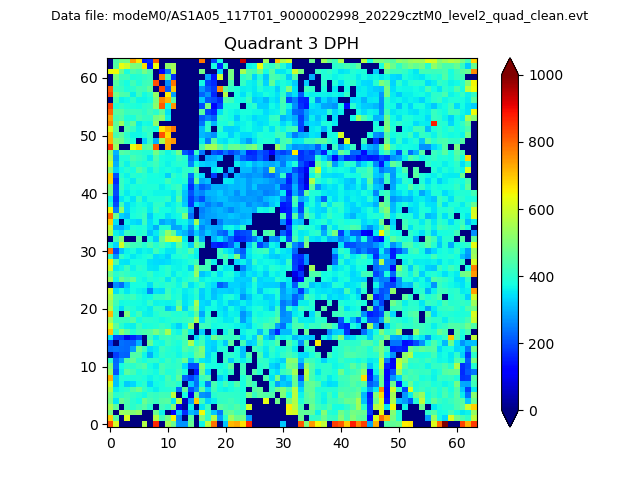 |
 |
Quadrant C |
| Plot type | Count rate plots | Images |
|---|---|---|
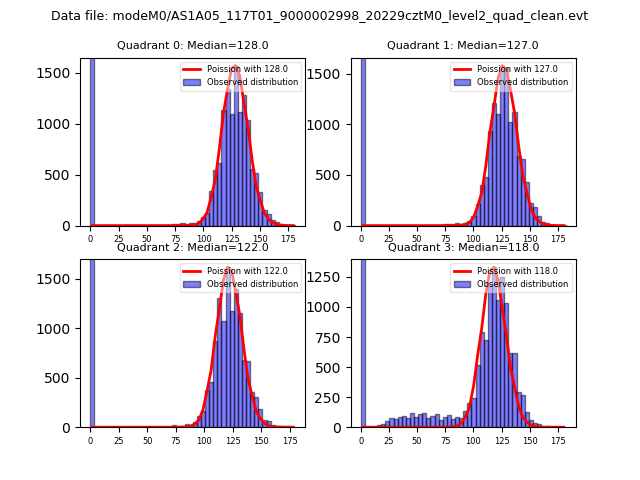
| Comparison with Poisson distribution Blue bars denote a histogram of data divided into 1 sec bins. Red curve is a Poisson curve with rate = median count rate of data. |
 |
 |
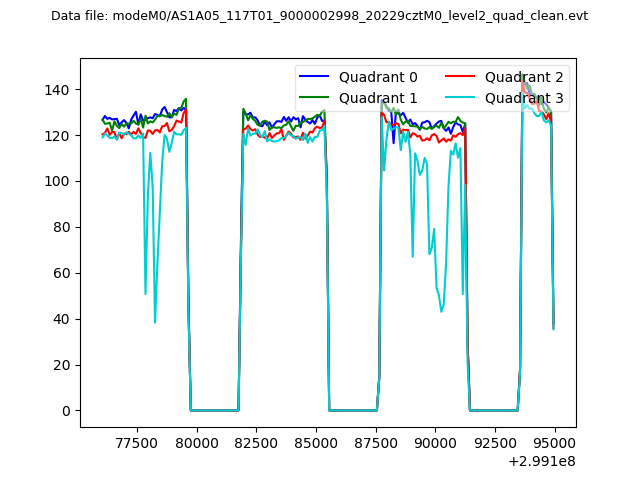
| Quadrant-wise count rates Data is divided into 100 sec bins |
 |
|
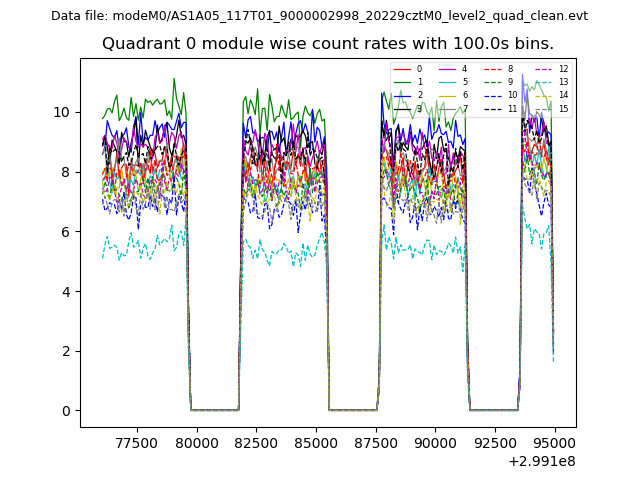
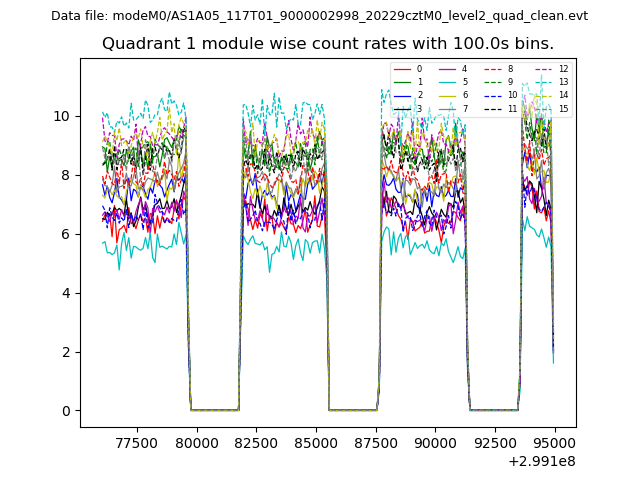
| Module-wise count rates for Quadrant A Data is divided into 100 sec bins |
 |
 |
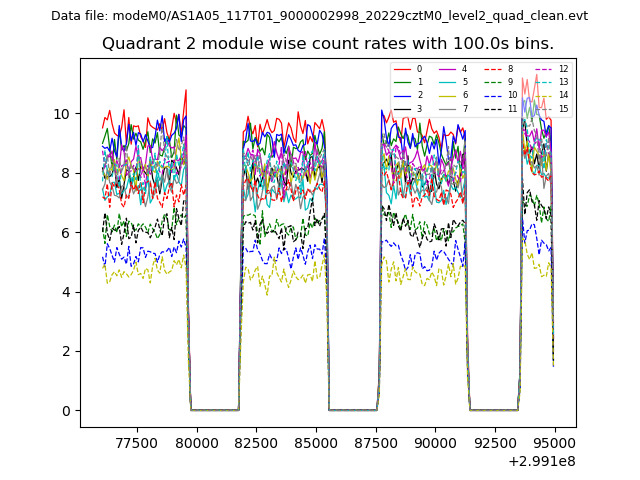
| Module-wise count rates for Quadrant B Data is divided into 100 sec bins |
 |
 |
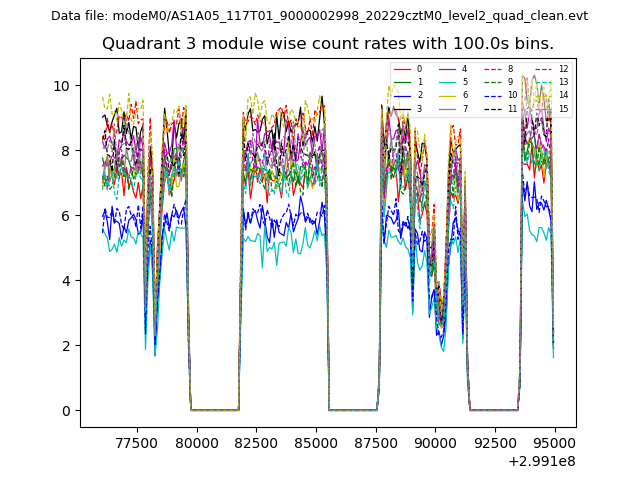
| Module-wise count rates for Quadrant C Data is divided into 100 sec bins |
 |
 |
| Module-wise count rates for Quadrant D Data is divided into 100 sec bins |
 |
 |
| Parameter | Plot |
|---|---|
| CZT HV Monitor | 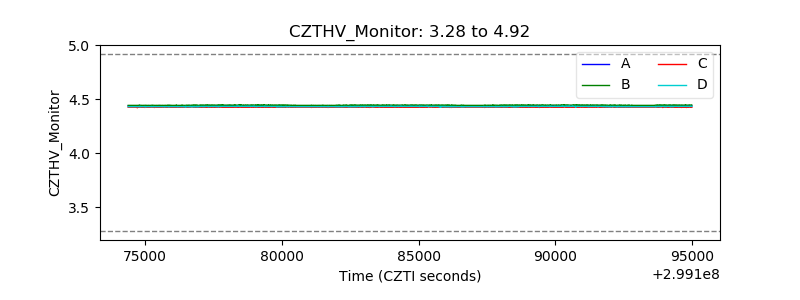 |
| D_VDD | 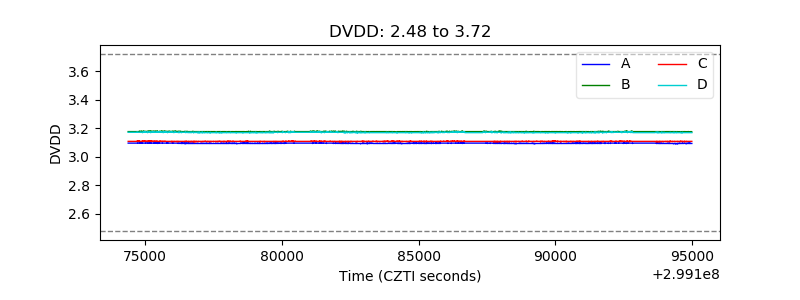 |
| Temperature 1 | 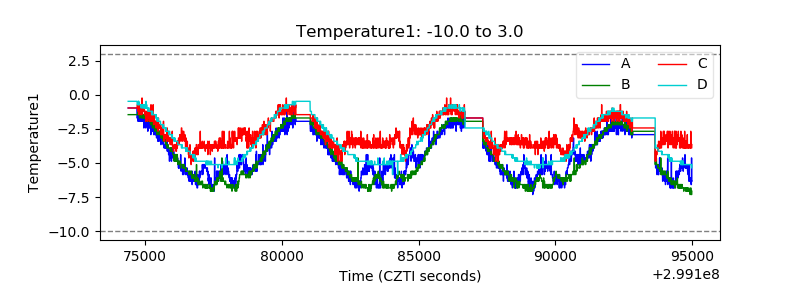 |
| Veto HV Monitor | 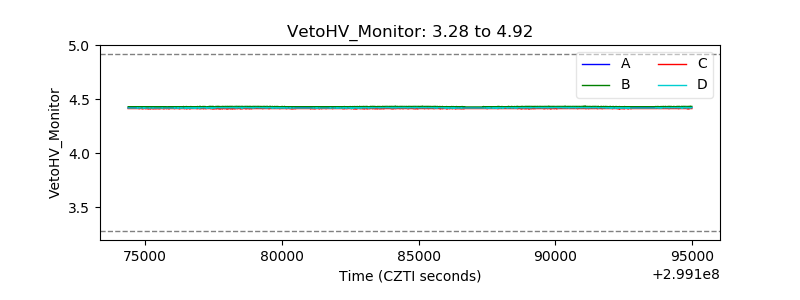 |
| Veto LLD | 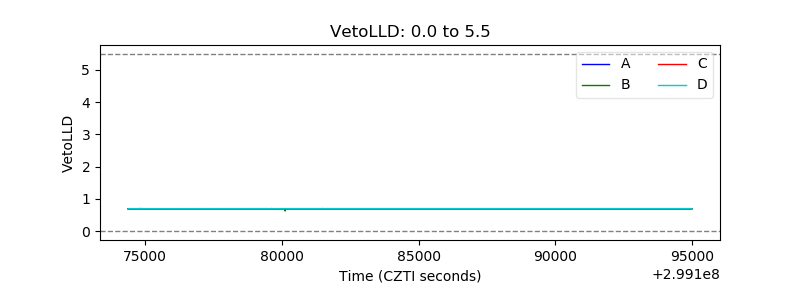 |
| Alpha Counter | 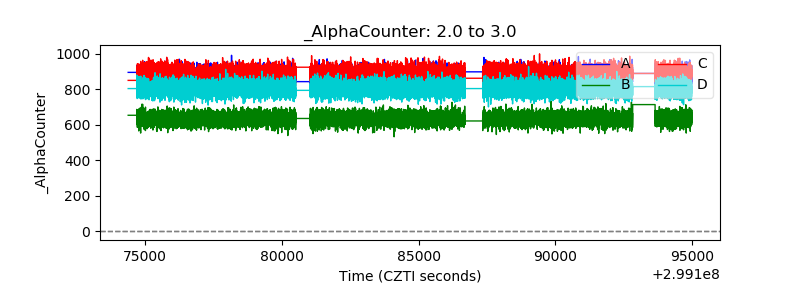 |
| _CPM_Rate | 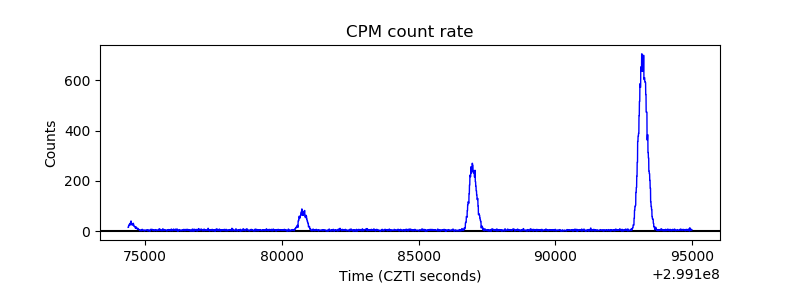 |
| CZT Counter | 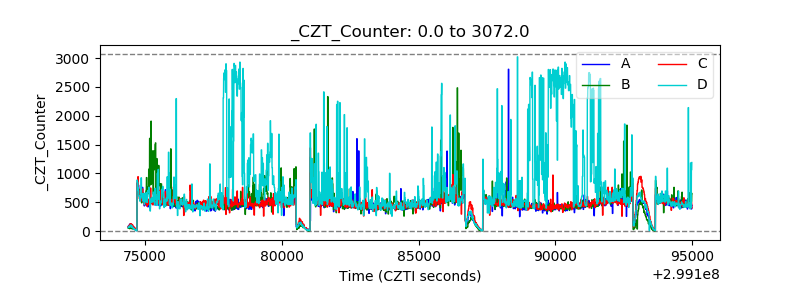 |
| +2.5 Volts monitor |  |
| +5 Volts monitor |  |
| _ROLL_ROT | 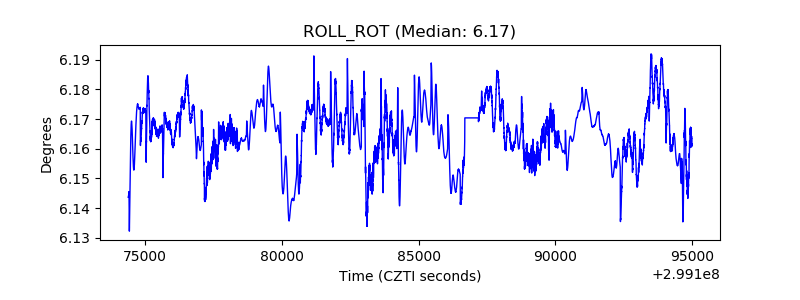 |
| _Roll_DEC | 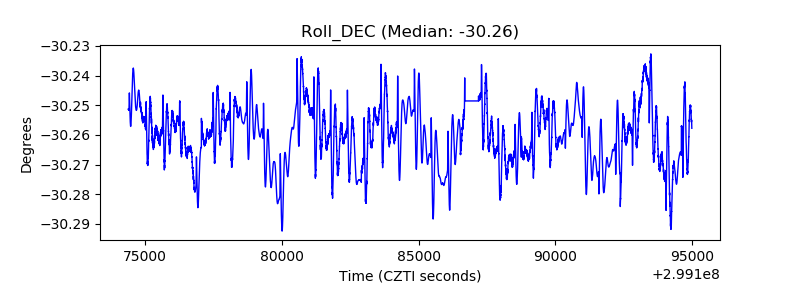 |
| _Roll_RA | 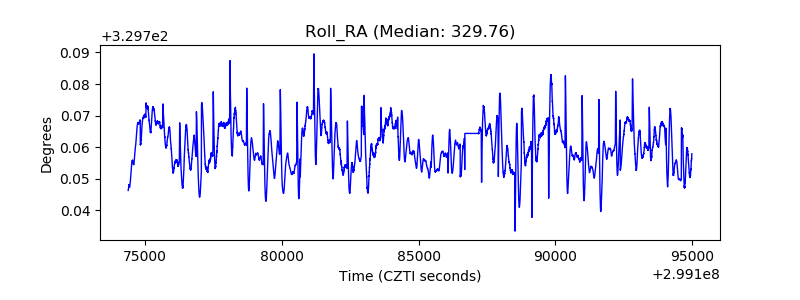 |
| Veto Counter | 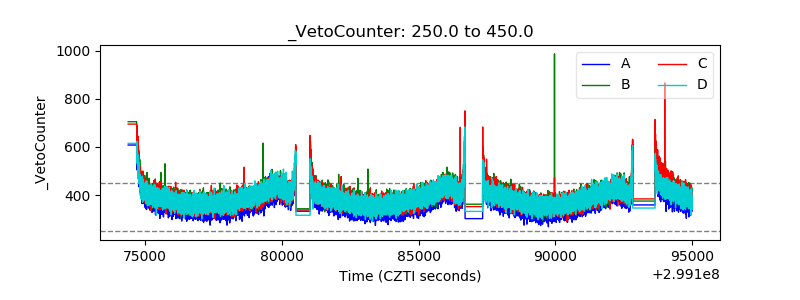 |