| Param | Original file | Final file |
|---|---|---|
| Filename | modeM0/AS1A05_117T01_9000002998_20232cztM0_level2.evt | modeM0/AS1A05_117T01_9000002998_20232cztM0_level2_quad_clean.evt |
| Size (bytes) | 579,700,800 | 94,812,480 |
| Size | 552.8 MB | 90.4 MB |
| Events in quadrant A | 3,231,297 | 619,649 |
| Events in quadrant B | 4,385,365 | 615,974 |
| Events in quadrant C | 3,216,706 | 607,415 |
| Events in quadrant D | 6,284,451 | 576,015 |
| Mode M0 | |||
|---|---|---|---|
| Quadrant | BADHDUFLAG | Total packets | Discarded packets |
| A | 0 | 13630 | 2 |
| B | 0 | 17045 | 2 |
| C | 0 | 13528 | 2 |
| D | 0 | 23242 | 2 |
| Mode SS | |||
|---|---|---|---|
| Quadrant | BADHDUFLAG | Total packets | Discarded packets |
| A | 0 | 134 | 0 |
| B | 0 | 134 | 0 |
| C | 0 | 134 | 0 |
| D | 0 | 134 | 0 |
| Mode M9 | |||
|---|---|---|---|
| Quadrant | BADHDUFLAG | Total packets | Discarded packets |
| A | 0 | 20 | 0 |
| B | 0 | 21 | 0 |
| C | 0 | 21 | 0 |
| D | 0 | 21 | 0 |
| Quadrant | Total seconds | Saturated seconds | Saturation percentage |
|---|---|---|---|
| A | 6481 | 44 | 0.678908% |
| B | 6480 | 166 | 2.561728% |
| C | 6480 | 58 | 0.895062% |
| D | 6480 | 150 | 2.314815% |
Noise dominated data is calculated using 1-second bins in cleaned event files. If a bin has >2000 counts, and if more than 50% of those come from <1% of pixels, then it is considered to be noise-dominated and hence unusable.
| Quadrant | # 1 sec bins | Bins with >0 counts | Bins with >2000 counts | High rate bins dominated by noise | Noise dominated (total time) | Noise dominated (detector-on time) | Marked lightcurve |
|---|---|---|---|---|---|---|---|
| A | 7561 | 6482 | 18 | 18 | 0.24% | 0.28% | 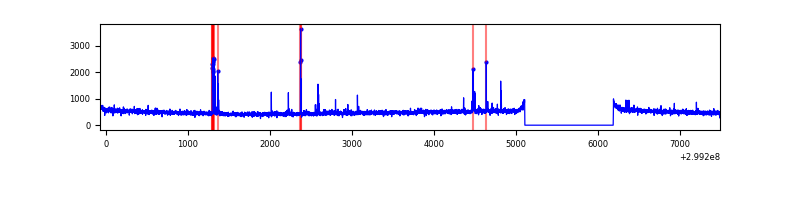 |
| B | 7560 | 6481 | 65 | 65 | 0.86% | 1.00% | 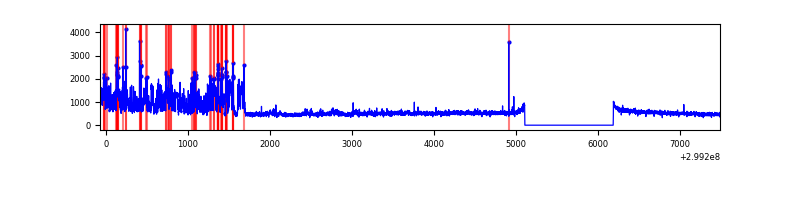 |
| C | 7560 | 6481 | 0 | 0 | 0.00% | 0.00% | 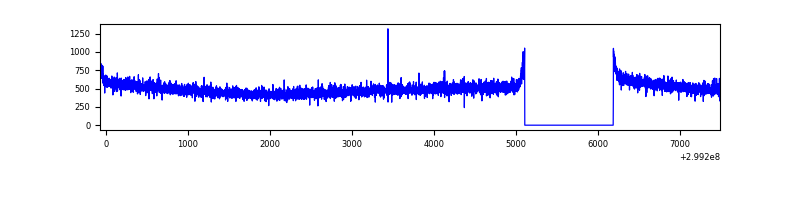 |
| D | 7560 | 6481 | 137 | 137 | 1.81% | 2.11% | 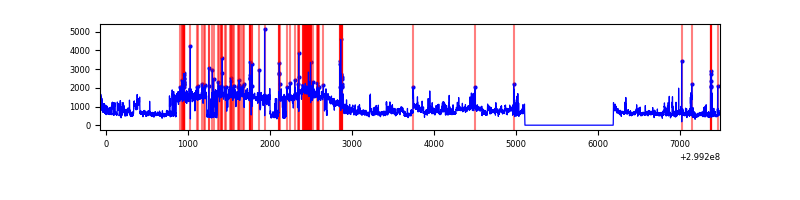 |
Top three noisy pixels from each quadrant. If the there are fewer than three noisy pixels in the level2.evt file, extra rows are filled as -1
| Pixel properties | Quadrant properties | ||||||
|---|---|---|---|---|---|---|---|
| Quadrant | DetID | PixID | Counts | Sigma | Mean | Median | Sigma |
| A | 14 | 238 | 99334 | 605.29 | 809 | 791 | 162.8 |
| A | 4 | 2 | 15936 | 93.03 | 809 | 791 | 162.8 |
| A | 0 | 226 | 7065 | 38.54 | 809 | 791 | 162.8 |
| B | 10 | 245 | 1146085 | 7408.42 | 805 | 785 | 154.6 |
| B | 0 | 85 | 29781 | 187.56 | 805 | 785 | 154.6 |
| B | 0 | 198 | 24587 | 153.96 | 805 | 785 | 154.6 |
| C | 14 | 238 | 123408 | 658.97 | 789 | 796 | 186.1 |
| C | 3 | 233 | 16664 | 85.28 | 789 | 796 | 186.1 |
| C | 13 | 61 | 5558 | 25.59 | 789 | 796 | 186.1 |
| D | 7 | 238 | 2122424 | 11093.75 | 791 | 770 | 191.2 |
| D | 2 | 184 | 663311 | 3464.31 | 791 | 770 | 191.2 |
| D | 1 | 52 | 400215 | 2088.63 | 791 | 770 | 191.2 |
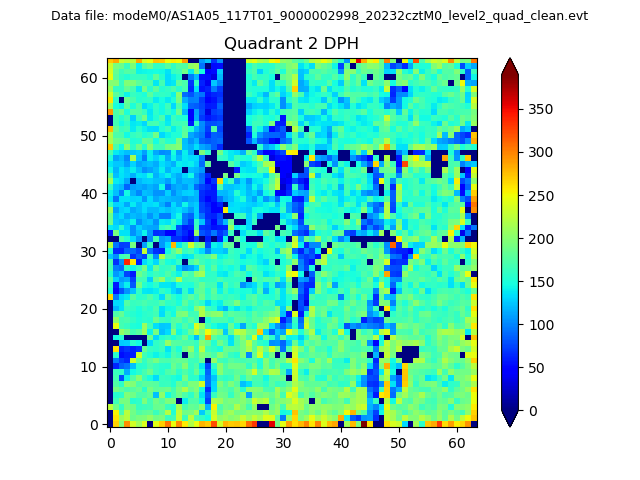
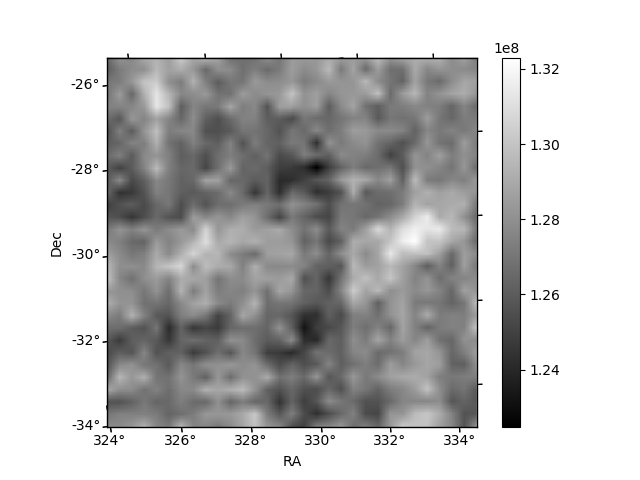
Histogram calculated using DETX and DETY for each event in the final _common_clean file
| Quadrant A |  |
 |
Quadrant B |
|---|---|---|---|
| Quadrant D | 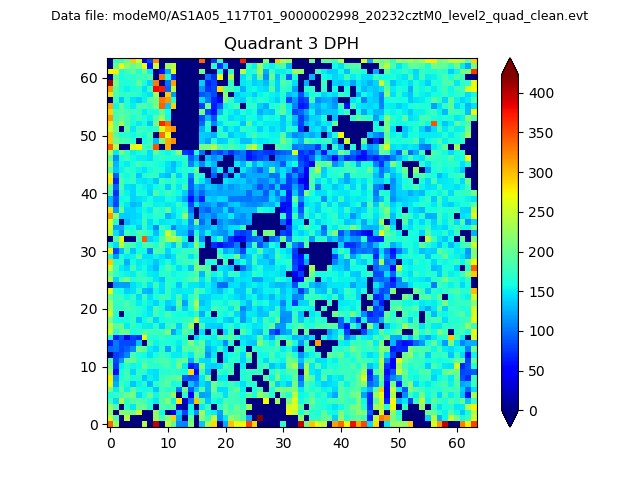 |
 |
Quadrant C |
| Plot type | Count rate plots | Images |
|---|---|---|
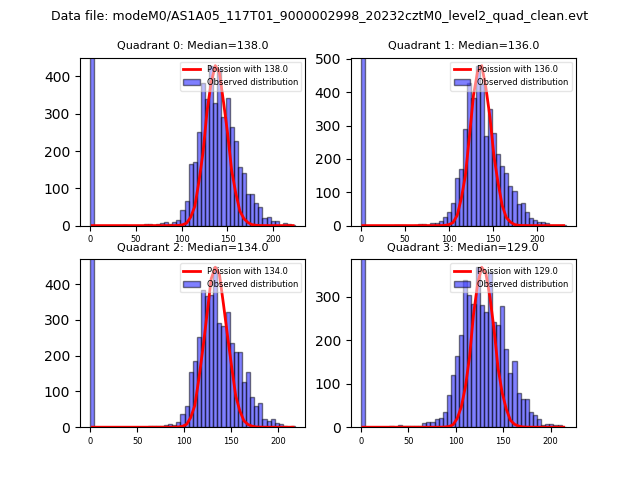
| Comparison with Poisson distribution Blue bars denote a histogram of data divided into 1 sec bins. Red curve is a Poisson curve with rate = median count rate of data. |
 |
 |
| Quadrant-wise count rates Data is divided into 100 sec bins |
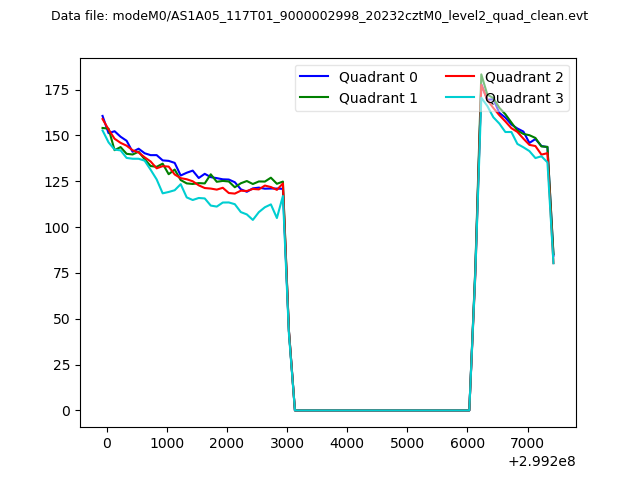 |
|
| Module-wise count rates for Quadrant A Data is divided into 100 sec bins |
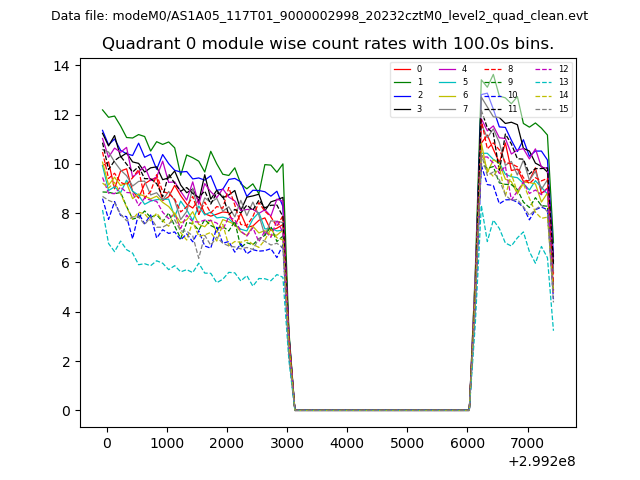 |
 |
| Module-wise count rates for Quadrant B Data is divided into 100 sec bins |
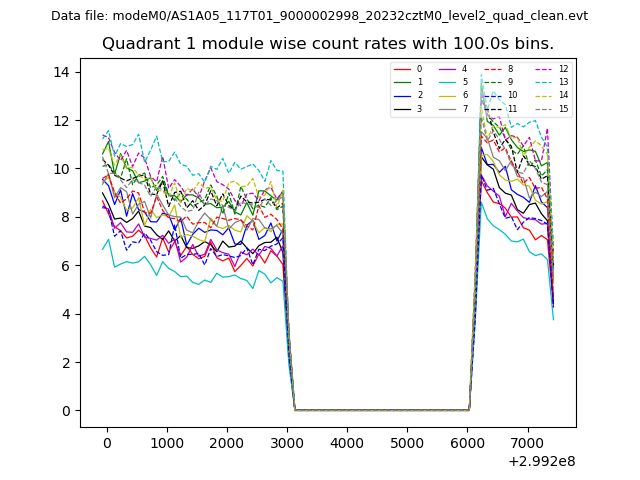 |
 |
| Module-wise count rates for Quadrant C Data is divided into 100 sec bins |
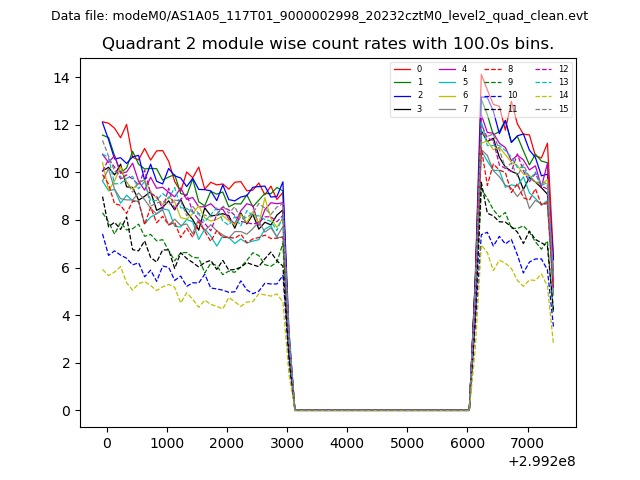 |
 |
| Module-wise count rates for Quadrant D Data is divided into 100 sec bins |
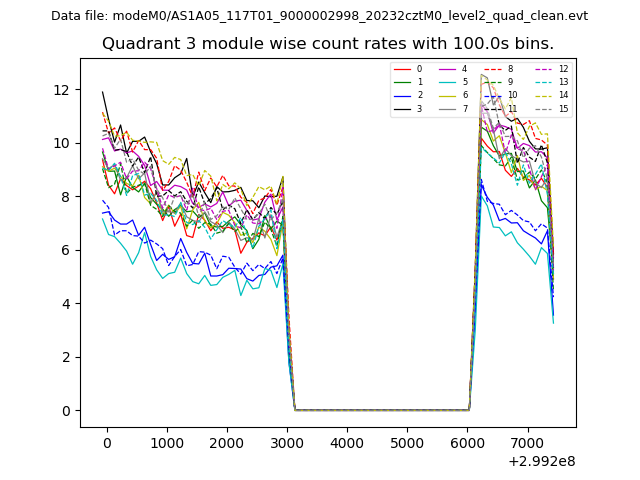 |
 |
| Parameter | Plot |
|---|---|
| CZT HV Monitor | 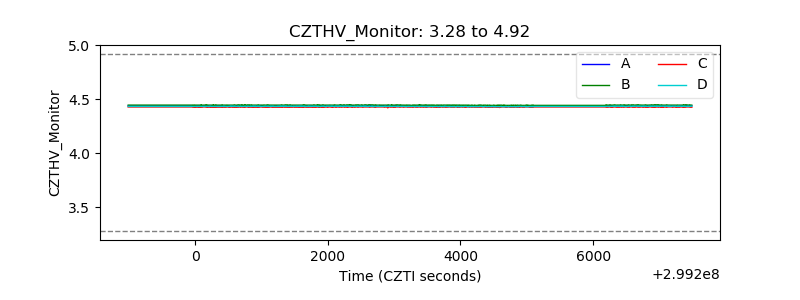 |
| D_VDD | 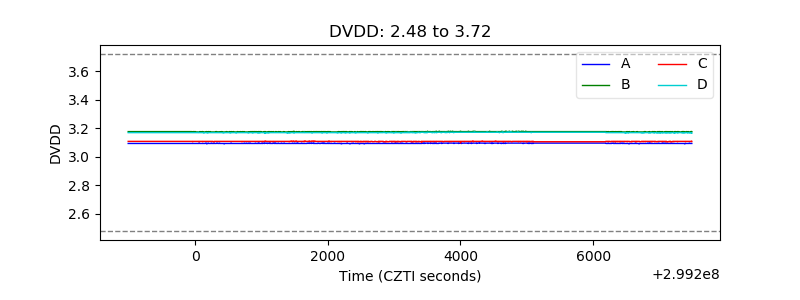 |
| Temperature 1 | 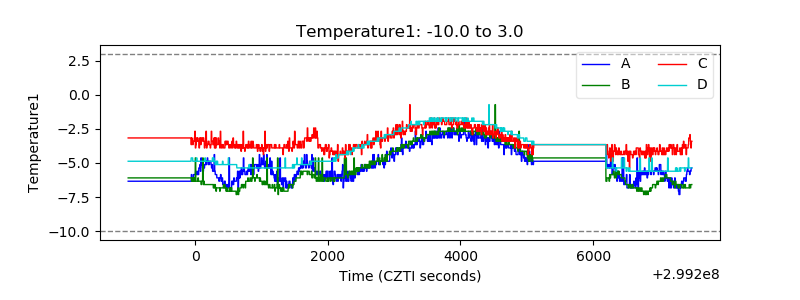 |
| Veto HV Monitor | 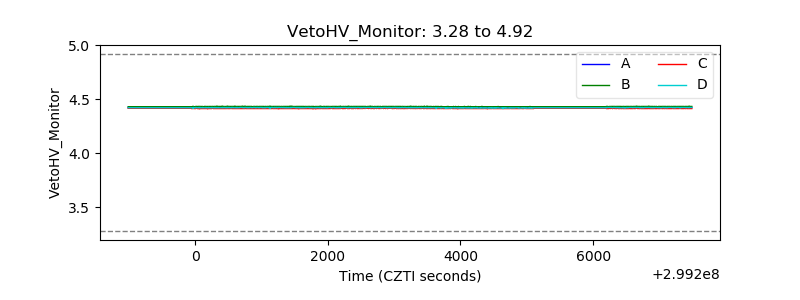 |
| Veto LLD | 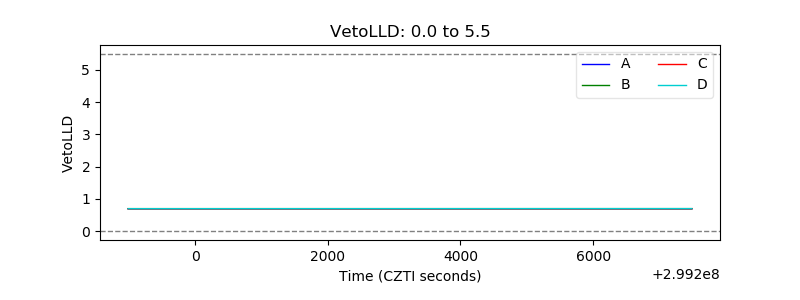 |
| Alpha Counter | 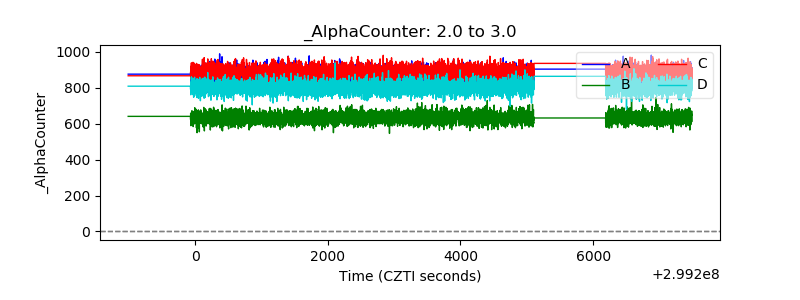 |
| _CPM_Rate | 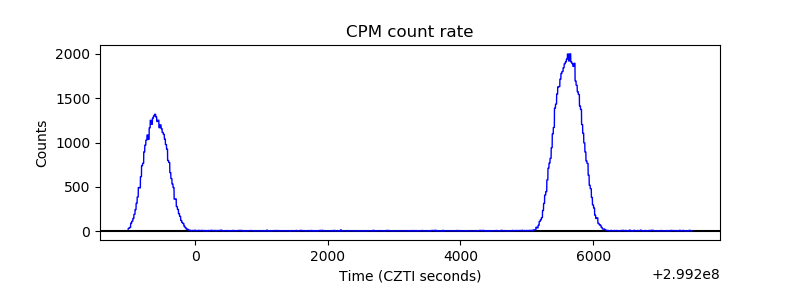 |
| CZT Counter | 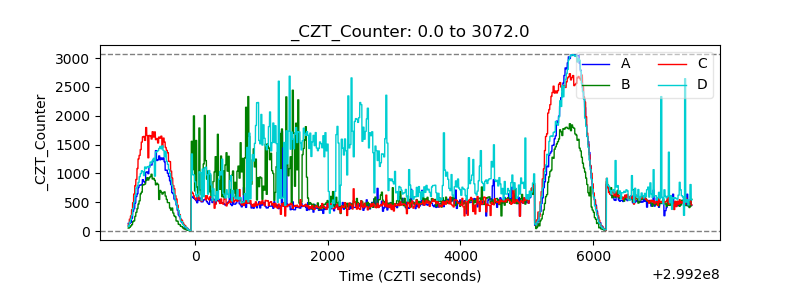 |
| +2.5 Volts monitor |  |
| +5 Volts monitor | 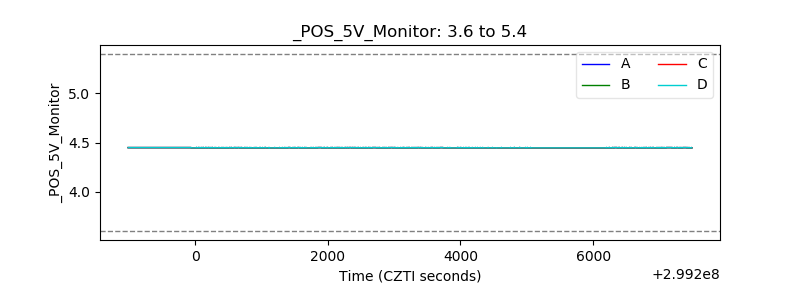 |
| _ROLL_ROT | 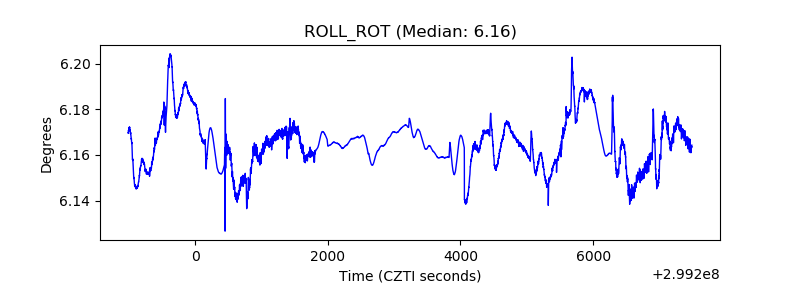 |
| _Roll_DEC | 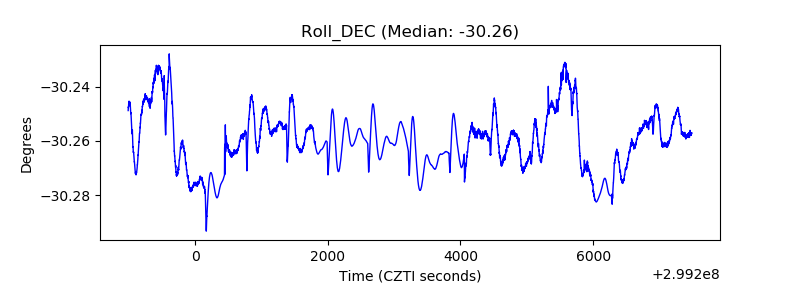 |
| _Roll_RA | 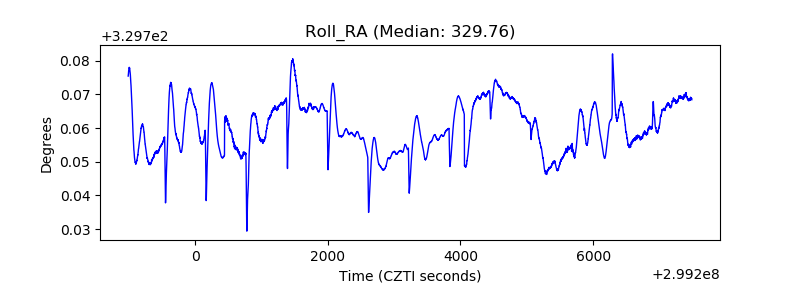 |
| Veto Counter |  |