| Param | Original file | Final file |
|---|---|---|
| Filename | modeM0/AS1A05_117T01_9000002998_20233cztM0_level2.evt | modeM0/AS1A05_117T01_9000002998_20233cztM0_level2_quad_clean.evt |
| Size (bytes) | 239,808,960 | 58,415,040 |
| Size | 228.7 MB | 55.7 MB |
| Events in quadrant A | 1,570,809 | 389,240 |
| Events in quadrant B | 1,713,741 | 393,995 |
| Events in quadrant C | 1,635,322 | 382,331 |
| Events in quadrant D | 2,119,642 | 371,695 |
| Mode M0 | |||
|---|---|---|---|
| Quadrant | BADHDUFLAG | Total packets | Discarded packets |
| A | 0 | 6787 | 1 |
| B | 0 | 7226 | 1 |
| C | 0 | 6923 | 1 |
| D | 0 | 8550 | 1 |
| Mode SS | |||
|---|---|---|---|
| Quadrant | BADHDUFLAG | Total packets | Discarded packets |
| A | 0 | 66 | 0 |
| B | 0 | 66 | 0 |
| C | 0 | 66 | 0 |
| D | 0 | 66 | 0 |
| Mode M9 | |||
|---|---|---|---|
| Quadrant | BADHDUFLAG | Total packets | Discarded packets |
| A | 0 | 11 | 0 |
| B | 0 | 11 | 0 |
| C | 0 | 11 | 0 |
| D | 0 | 11 | 0 |
| Quadrant | Total seconds | Saturated seconds | Saturation percentage |
|---|---|---|---|
| A | 3262 | 18 | 0.551809% |
| B | 3263 | 19 | 0.582286% |
| C | 3263 | 34 | 1.041986% |
| D | 3263 | 53 | 1.624272% |
Noise dominated data is calculated using 1-second bins in cleaned event files. If a bin has >2000 counts, and if more than 50% of those come from <1% of pixels, then it is considered to be noise-dominated and hence unusable.
| Quadrant | # 1 sec bins | Bins with >0 counts | Bins with >2000 counts | High rate bins dominated by noise | Noise dominated (total time) | Noise dominated (detector-on time) | Marked lightcurve |
|---|---|---|---|---|---|---|---|
| A | 4342 | 3263 | 0 | 0 | 0.00% | 0.00% | 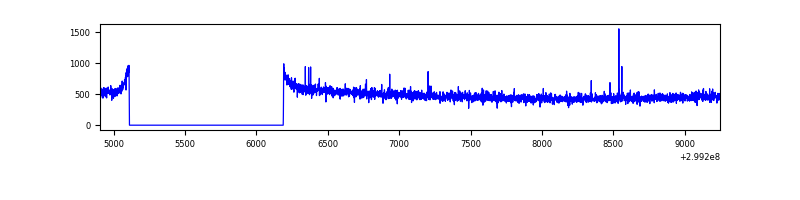 |
| B | 4343 | 3264 | 3 | 3 | 0.07% | 0.09% | 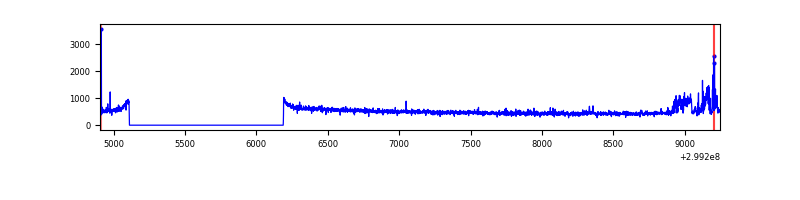 |
| C | 4343 | 3264 | 0 | 0 | 0.00% | 0.00% | 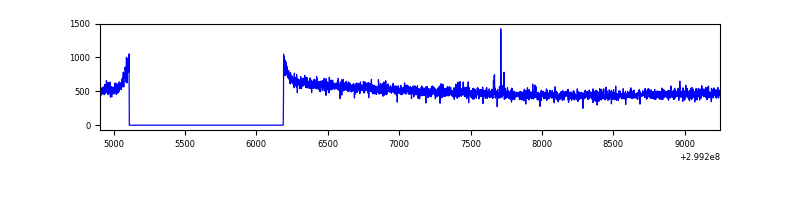 |
| D | 4343 | 3264 | 26 | 26 | 0.60% | 0.80% | 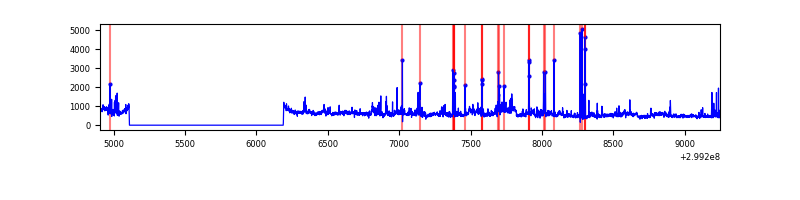 |
Top three noisy pixels from each quadrant. If the there are fewer than three noisy pixels in the level2.evt file, extra rows are filled as -1
| Pixel properties | Quadrant properties | ||||||
|---|---|---|---|---|---|---|---|
| Quadrant | DetID | PixID | Counts | Sigma | Mean | Median | Sigma |
| A | 4 | 2 | 3870 | 42.18 | 406 | 399 | 82.3 |
| A | 0 | 226 | 3578 | 38.63 | 406 | 399 | 82.3 |
| A | 14 | 238 | 3385 | 36.29 | 406 | 399 | 82.3 |
| B | 10 | 245 | 113023 | 1438.68 | 404 | 394 | 78.3 |
| B | 12 | 111 | 9008 | 110.03 | 404 | 394 | 78.3 |
| B | 0 | 198 | 8604 | 104.87 | 404 | 394 | 78.3 |
| C | 14 | 238 | 62414 | 650.8 | 400 | 404 | 95.3 |
| C | 3 | 233 | 7143 | 70.73 | 400 | 404 | 95.3 |
| C | 9 | 54 | 4767 | 45.79 | 400 | 404 | 95.3 |
| D | 1 | 52 | 335064 | 3381.84 | 401 | 389 | 99.0 |
| D | 2 | 184 | 107792 | 1085.29 | 401 | 389 | 99.0 |
| D | 11 | 176 | 104834 | 1055.4 | 401 | 389 | 99.0 |
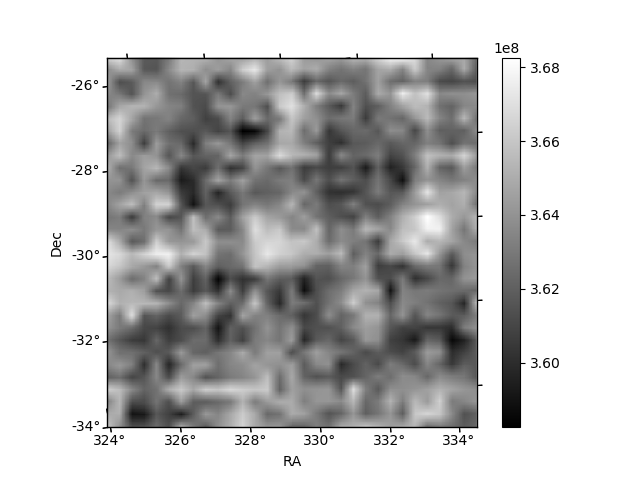
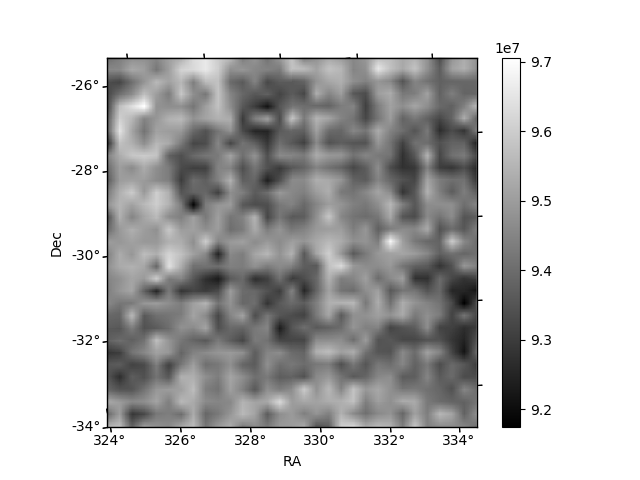
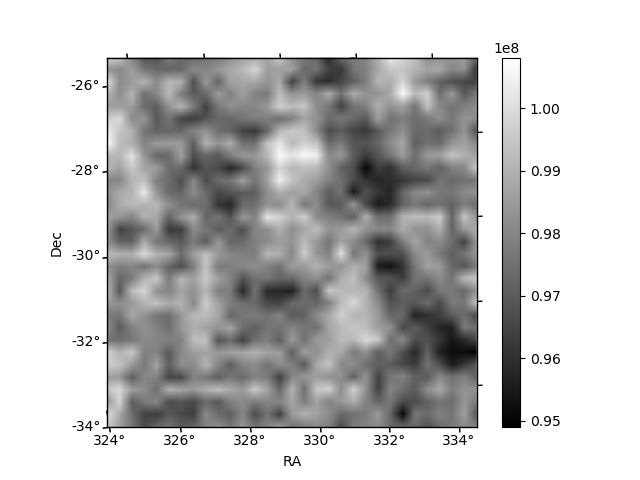
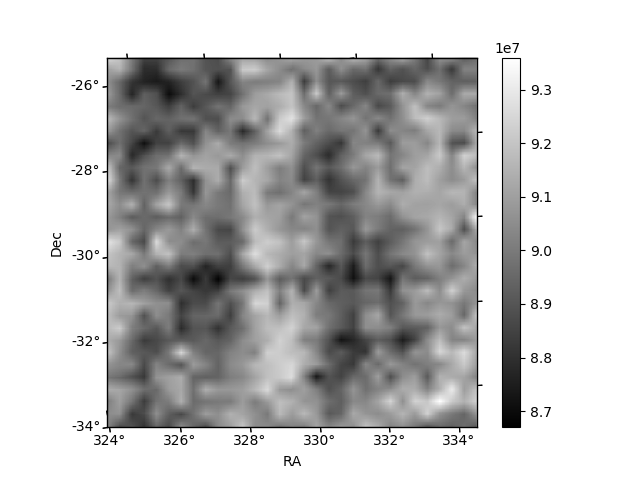
Histogram calculated using DETX and DETY for each event in the final _common_clean file
| Quadrant A | 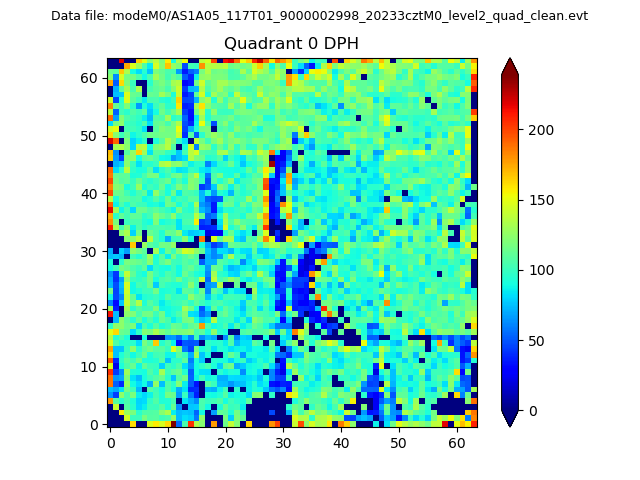 |
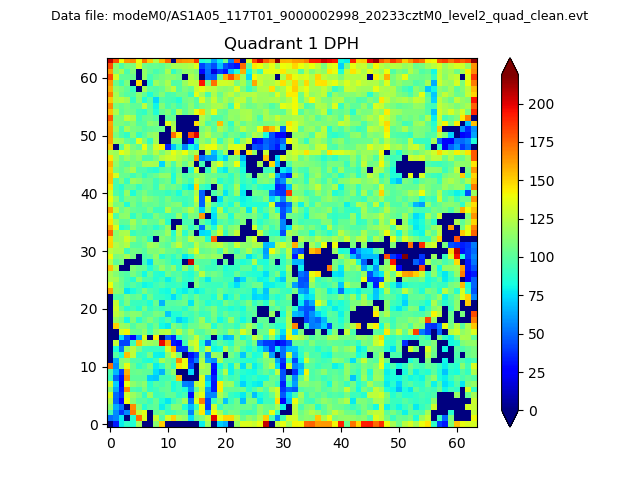 |
Quadrant B |
|---|---|---|---|
| Quadrant D | 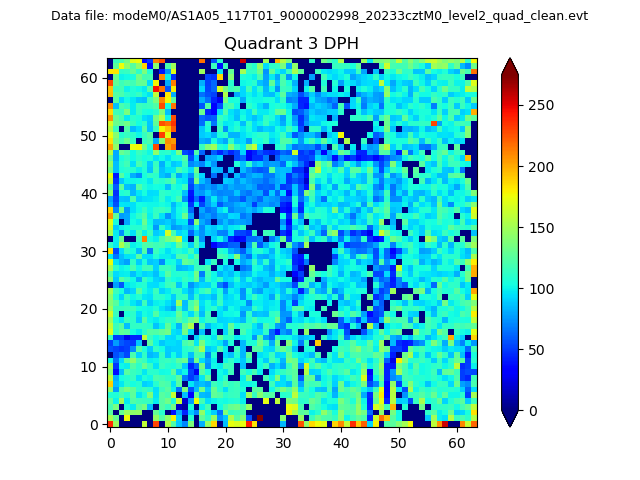 |
 |
Quadrant C |
| Plot type | Count rate plots | Images |
|---|---|---|
| Comparison with Poisson distribution Blue bars denote a histogram of data divided into 1 sec bins. Red curve is a Poisson curve with rate = median count rate of data. |
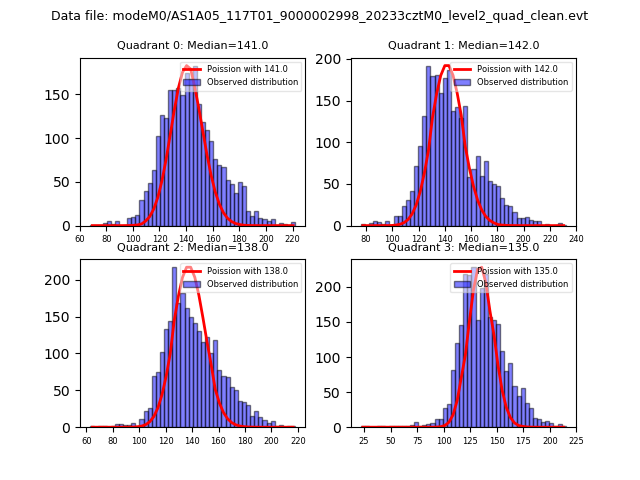 |
 |
| Quadrant-wise count rates Data is divided into 100 sec bins |
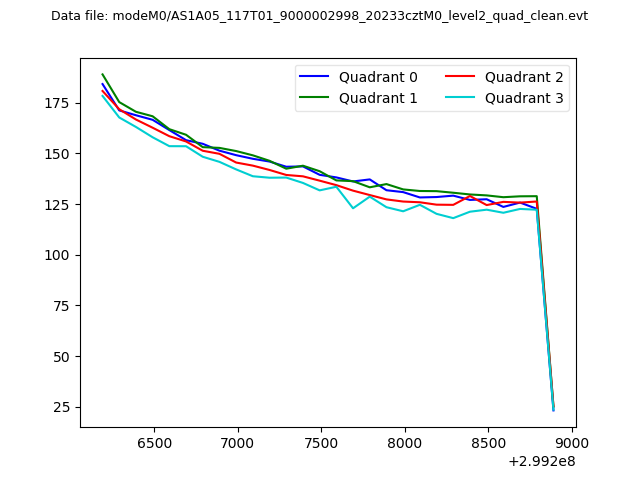 |
|
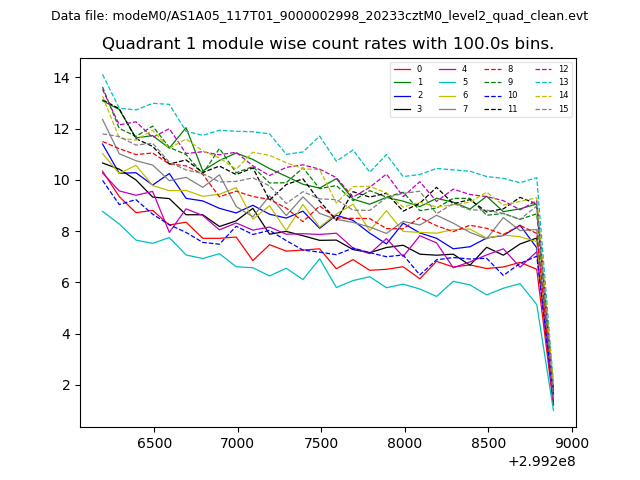
| Module-wise count rates for Quadrant A Data is divided into 100 sec bins |
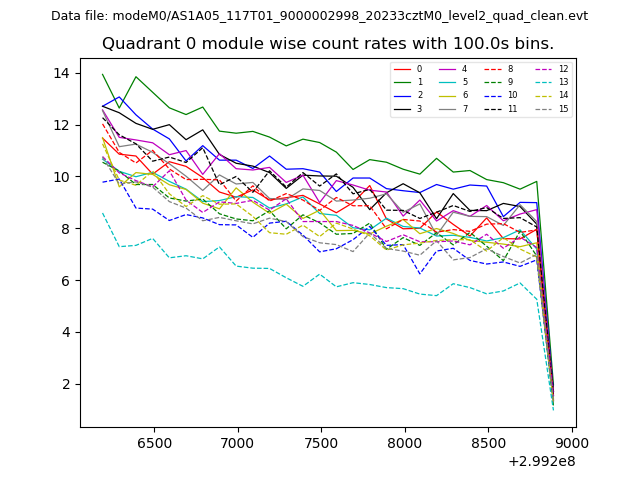 |
 |
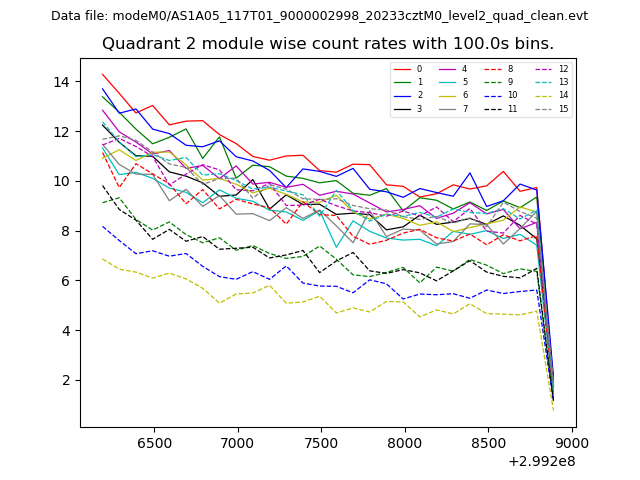
| Module-wise count rates for Quadrant B Data is divided into 100 sec bins |
 |
 |
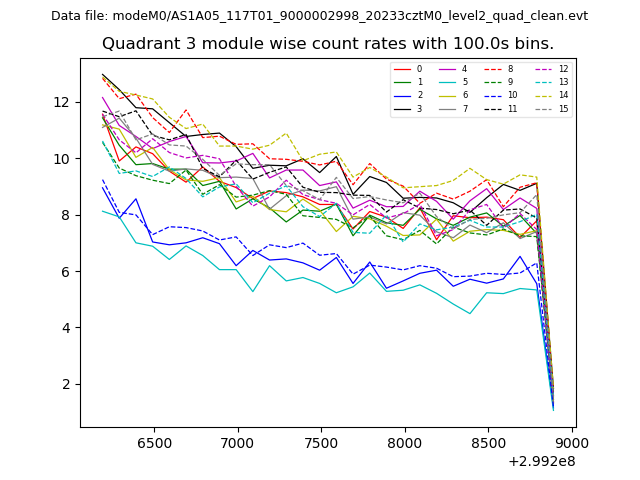
| Module-wise count rates for Quadrant C Data is divided into 100 sec bins |
 |
 |
| Module-wise count rates for Quadrant D Data is divided into 100 sec bins |
 |
 |
| Parameter | Plot |
|---|---|
| CZT HV Monitor | 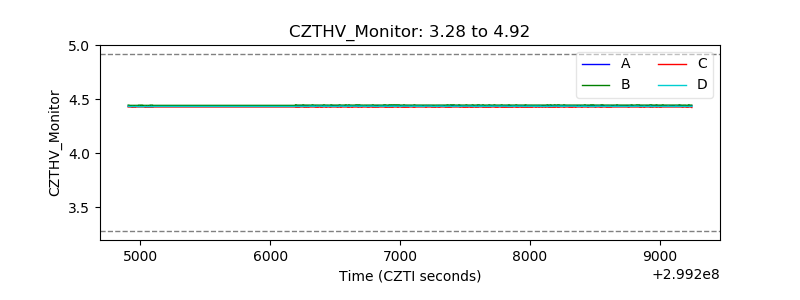 |
| D_VDD |  |
| Temperature 1 | 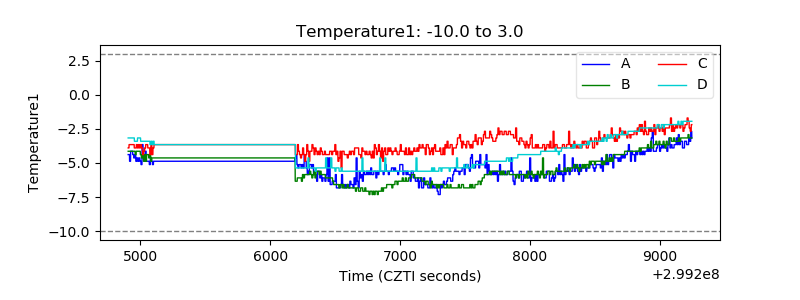 |
| Veto HV Monitor | 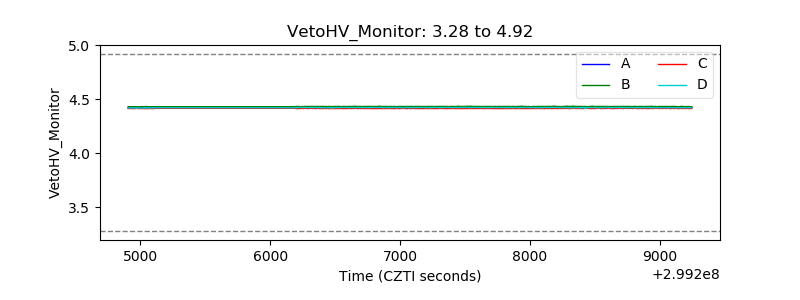 |
| Veto LLD | 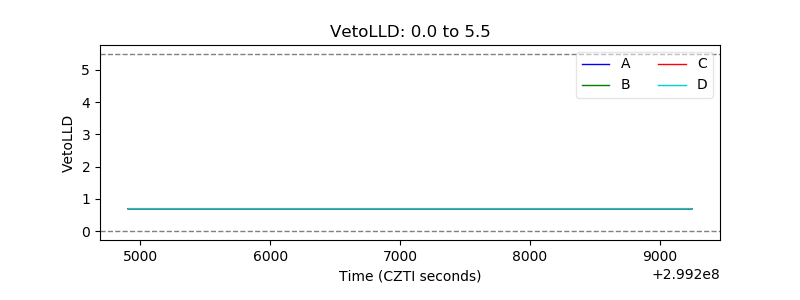 |
| Alpha Counter | 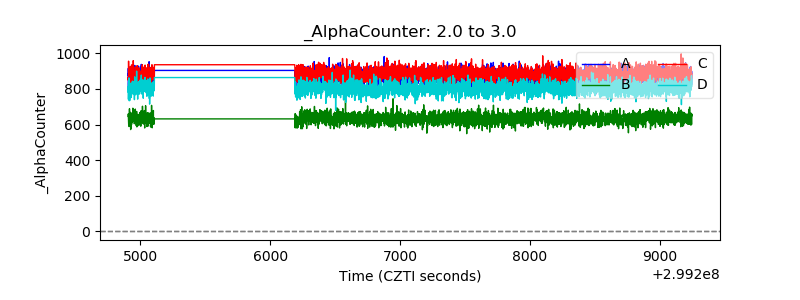 |
| _CPM_Rate | 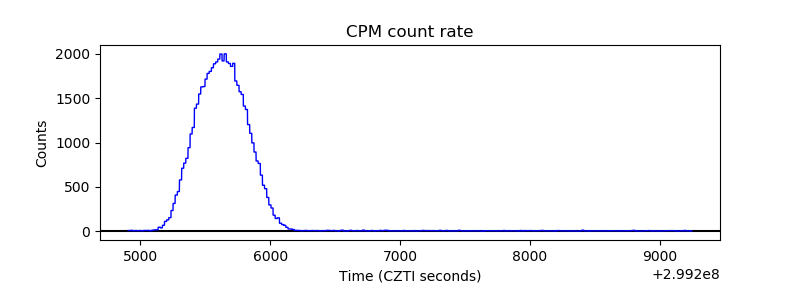 |
| CZT Counter |  |
| +2.5 Volts monitor |  |
| +5 Volts monitor |  |
| _ROLL_ROT | 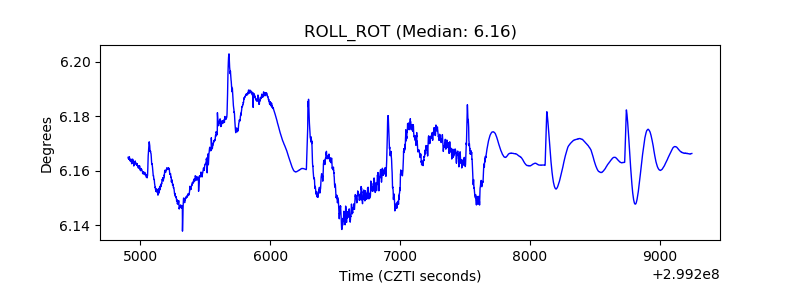 |
| _Roll_DEC | 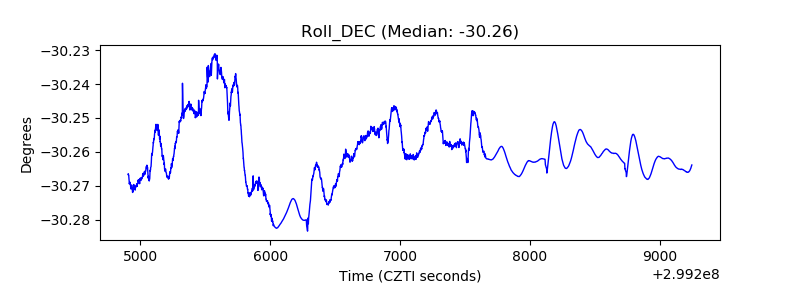 |
| _Roll_RA | 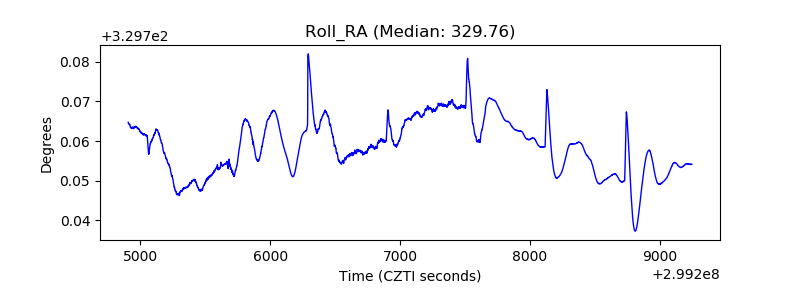 |
| Veto Counter | 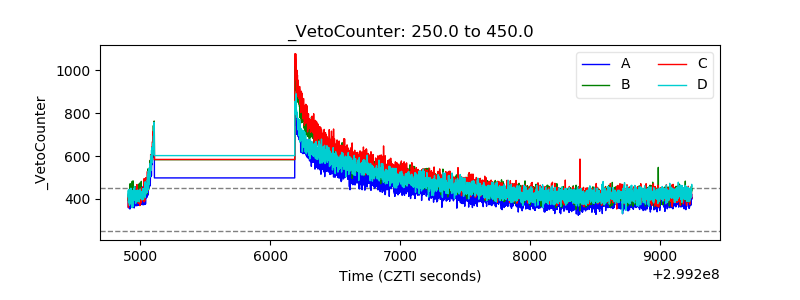 |