| Param | Original file | Final file |
|---|---|---|
| Filename | modeM0/AS1A05_117T01_9000002998_20397cztM0_level2.evt | modeM0/AS1A05_117T01_9000002998_20397cztM0_level2_quad_clean.evt |
| Size (bytes) | 16,464,960 | 5,201,280 |
| Size | 15.7 MB | 5.0 MB |
| Events in quadrant A | 112,986 | 31,238 |
| Events in quadrant B | 123,713 | 34,428 |
| Events in quadrant C | 119,073 | 32,525 |
| Events in quadrant D | 120,508 | 31,341 |
| Mode M0 | |||
|---|---|---|---|
| Quadrant | BADHDUFLAG | Total packets | Discarded packets |
| A | 0 | 804 | 278 |
| B | 0 | 805 | 249 |
| C | 0 | 809 | 265 |
| D | 0 | 841 | 290 |
| Mode SS | |||
|---|---|---|---|
| Quadrant | BADHDUFLAG | Total packets | Discarded packets |
| A | 0 | 8 | 0 |
| B | 0 | 8 | 2 |
| C | 0 | 8 | 2 |
| D | 0 | 8 | 2 |
| Quadrant | Total seconds | Saturated seconds | Saturation percentage |
|---|---|---|---|
| A | 263 | 0 | 0.000000% |
| B | 278 | 0 | 0.000000% |
| C | 272 | 1 | 0.367647% |
| D | 266 | 0 | 0.000000% |
Noise dominated data is calculated using 1-second bins in cleaned event files. If a bin has >2000 counts, and if more than 50% of those come from <1% of pixels, then it is considered to be noise-dominated and hence unusable.
| Quadrant | # 1 sec bins | Bins with >0 counts | Bins with >2000 counts | High rate bins dominated by noise | Noise dominated (total time) | Noise dominated (detector-on time) | Marked lightcurve |
|---|---|---|---|---|---|---|---|
| A | 310 | 299 | 0 | 0 | 0.00% | 0.00% | 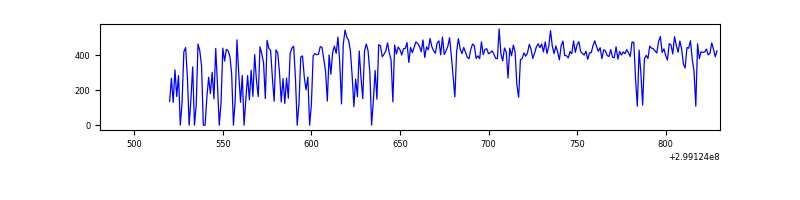 |
| B | 321 | 304 | 0 | 0 | 0.00% | 0.00% | 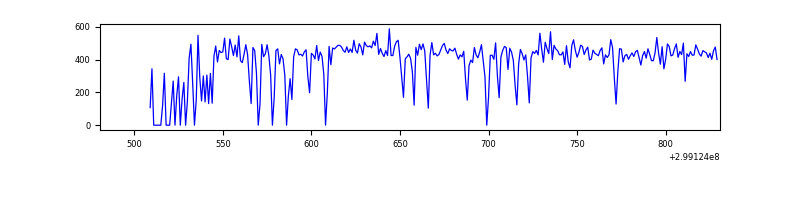 |
| C | 350 | 304 | 0 | 0 | 0.00% | 0.00% | 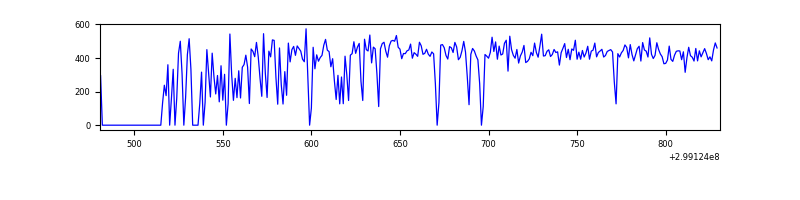 |
| D | 320 | 298 | 0 | 0 | 0.00% | 0.00% | 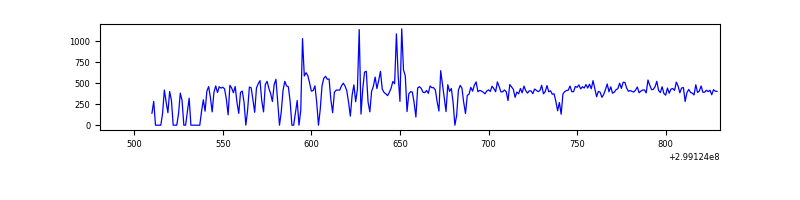 |
Top three noisy pixels from each quadrant. If the there are fewer than three noisy pixels in the level2.evt file, extra rows are filled as -1
| Pixel properties | Quadrant properties | ||||||
|---|---|---|---|---|---|---|---|
| Quadrant | DetID | PixID | Counts | Sigma | Mean | Median | Sigma |
| A | 11 | 29 | 450 | 53.39 | 29 | 28 | 7.9 |
| A | 3 | 137 | 250 | 28.08 | 29 | 28 | 7.9 |
| A | 0 | 226 | 244 | 27.33 | 29 | 28 | 7.9 |
| B | 0 | 214 | 1186 | 141.29 | 30 | 30 | 8.2 |
| B | 0 | 229 | 771 | 90.57 | 30 | 30 | 8.2 |
| B | 12 | 111 | 743 | 87.14 | 30 | 30 | 8.2 |
| C | 14 | 238 | 4984 | 559.64 | 29 | 28 | 8.9 |
| C | 13 | 61 | 202 | 19.65 | 29 | 28 | 8.9 |
| C | 9 | 221 | 198 | 19.2 | 29 | 28 | 8.9 |
| D | 1 | 52 | 10801 | 1216.97 | 29 | 28 | 8.9 |
| D | 2 | 234 | 1093 | 120.31 | 29 | 28 | 8.9 |
| D | 14 | 226 | 259 | 26.09 | 29 | 28 | 8.9 |
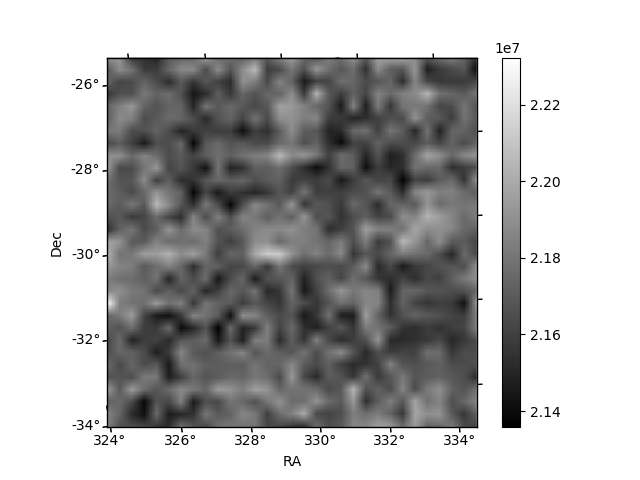
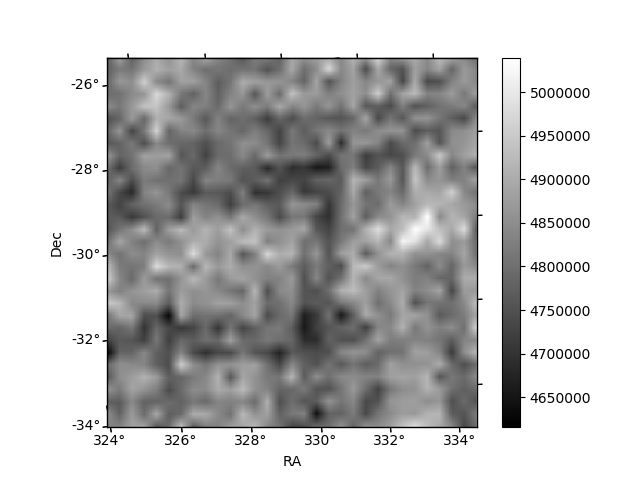
Histogram calculated using DETX and DETY for each event in the final _common_clean file
| Quadrant A | 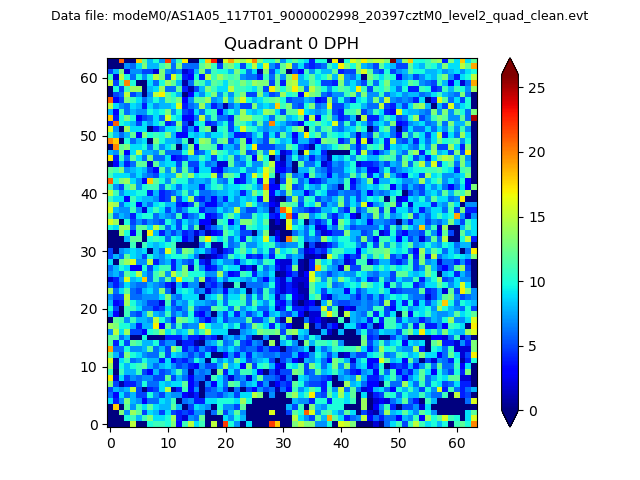 |
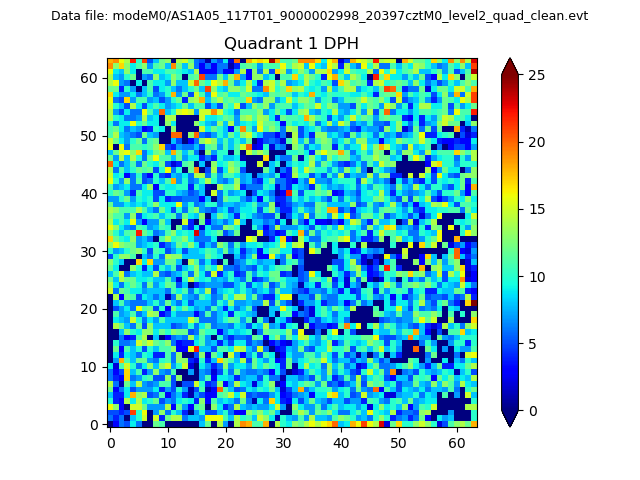 |
Quadrant B |
|---|---|---|---|
| Quadrant D |  |
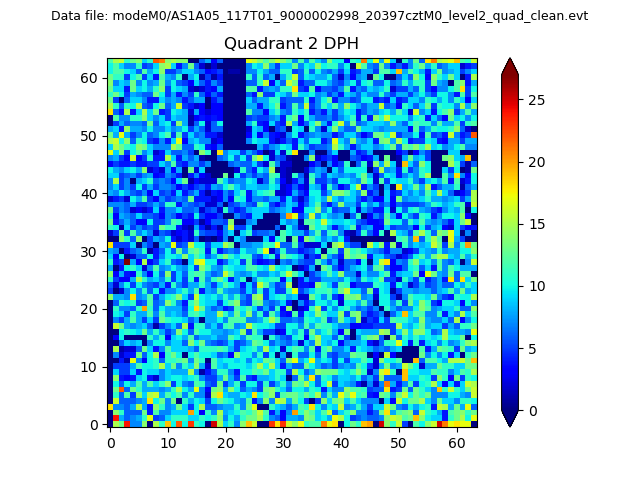 |
Quadrant C |
| Plot type | Count rate plots | Images |
|---|---|---|
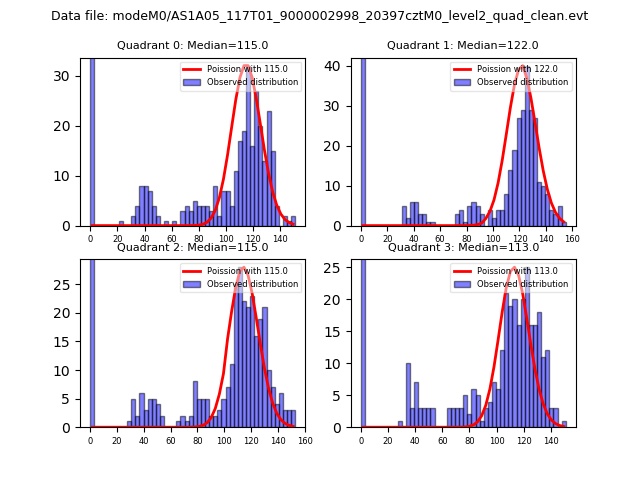
| Comparison with Poisson distribution Blue bars denote a histogram of data divided into 1 sec bins. Red curve is a Poisson curve with rate = median count rate of data. |
 |
 |
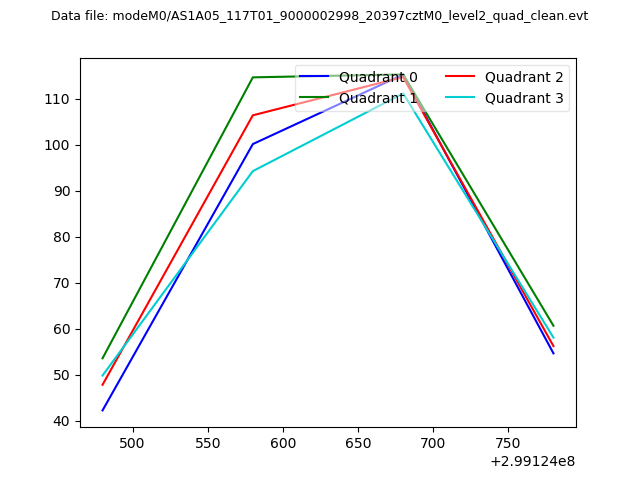
| Quadrant-wise count rates Data is divided into 100 sec bins |
 |
|
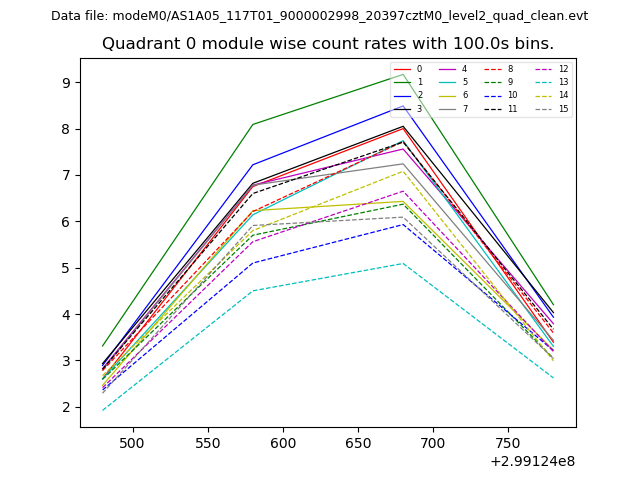
| Module-wise count rates for Quadrant A Data is divided into 100 sec bins |
 |
 |
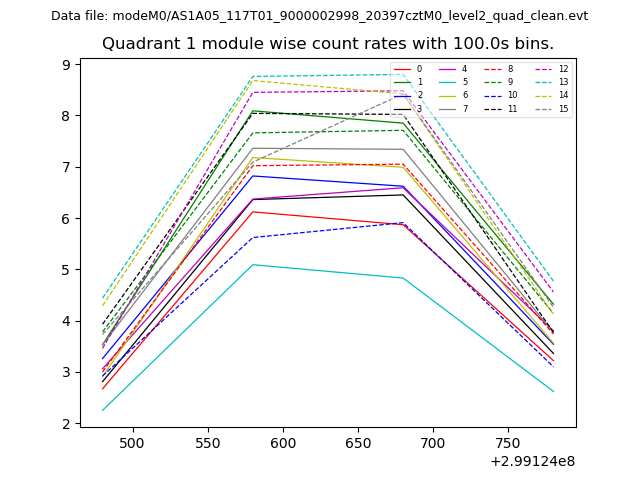
| Module-wise count rates for Quadrant B Data is divided into 100 sec bins |
 |
 |
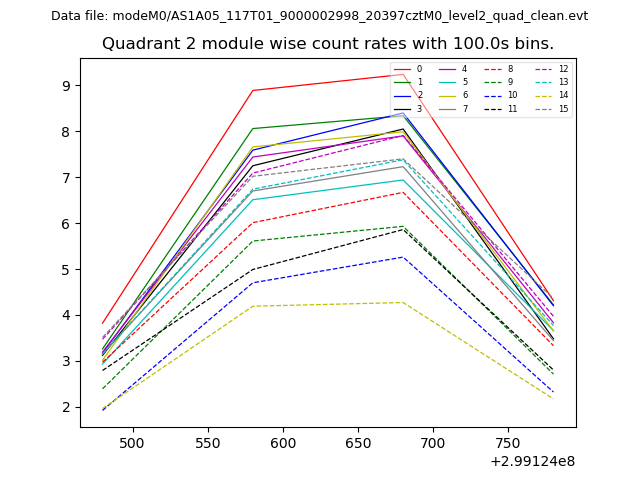
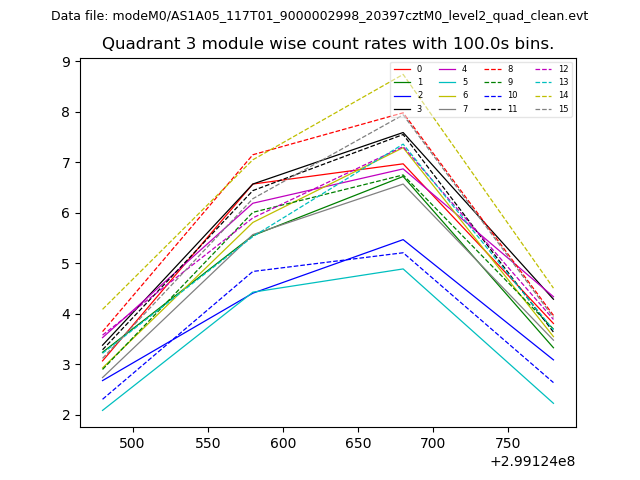
| Module-wise count rates for Quadrant C Data is divided into 100 sec bins |
 |
 |
| Module-wise count rates for Quadrant D Data is divided into 100 sec bins |
 |
 |
| Parameter | Plot |
|---|---|
| CZT HV Monitor | 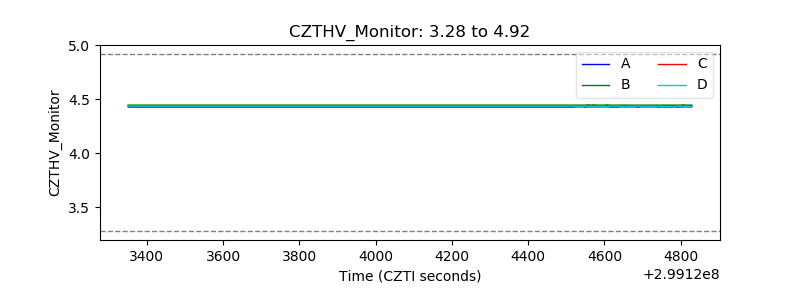 |
| D_VDD |  |
| Temperature 1 | 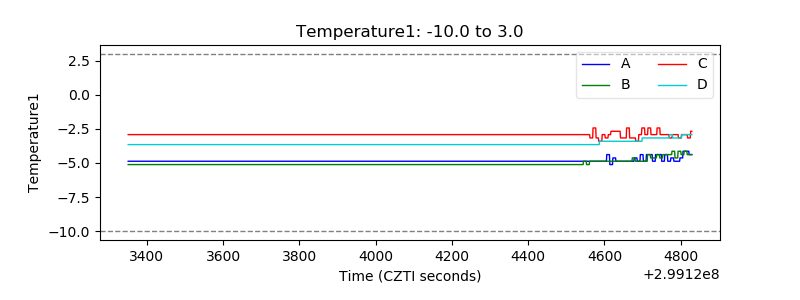 |
| Veto HV Monitor | 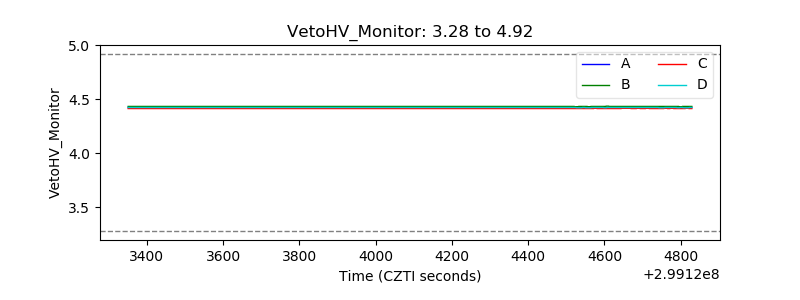 |
| Veto LLD | 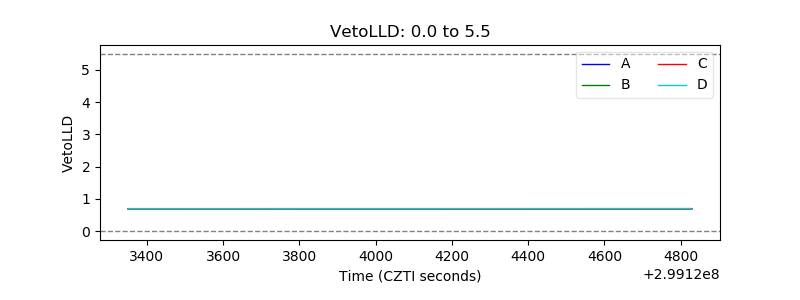 |
| Alpha Counter | 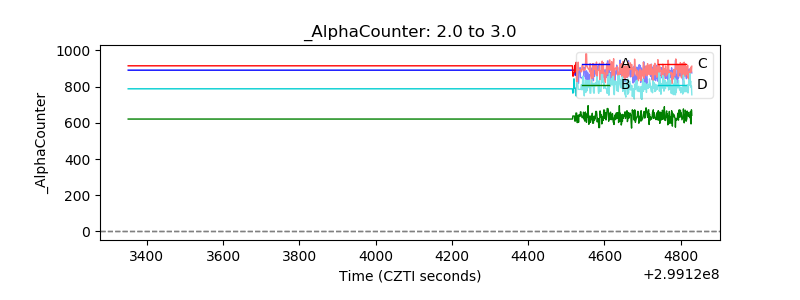 |
| _CPM_Rate | 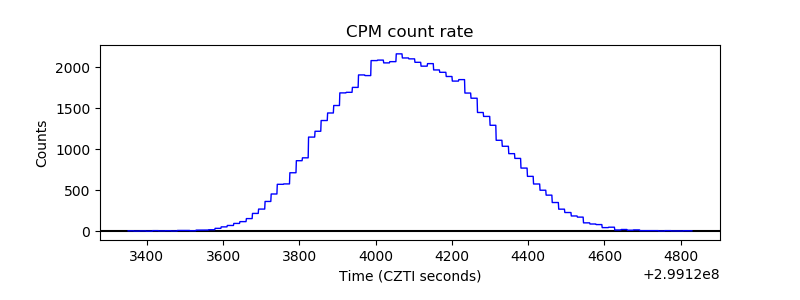 |
| CZT Counter | 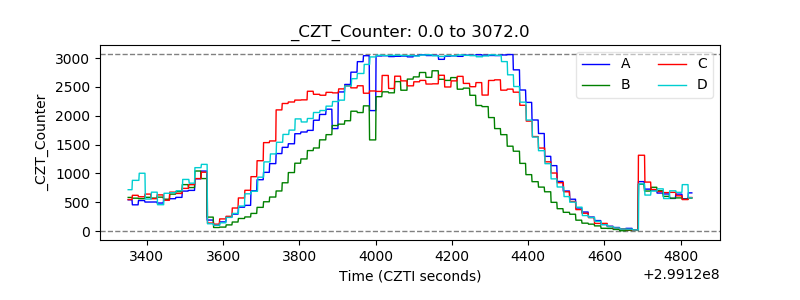 |
| +2.5 Volts monitor |  |
| +5 Volts monitor |  |
| _ROLL_ROT | 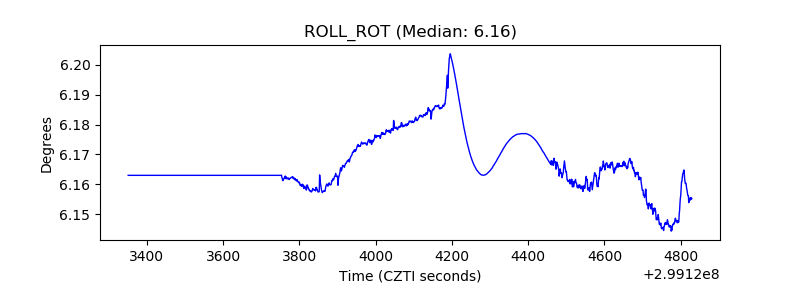 |
| _Roll_DEC | 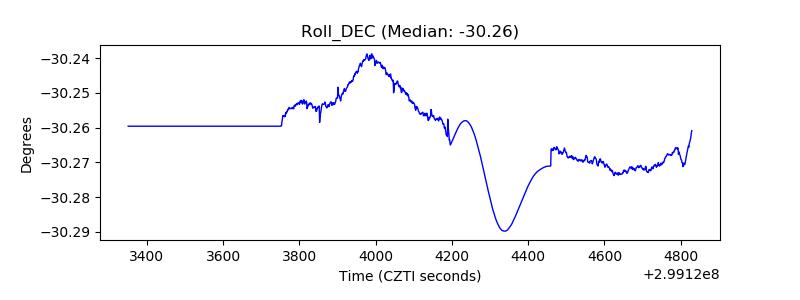 |
| _Roll_RA | 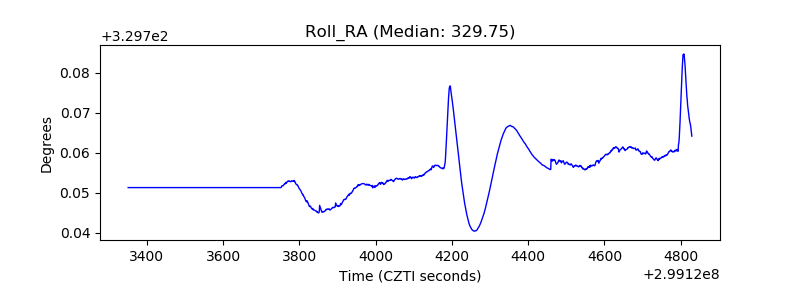 |
| Veto Counter |  |