| Param | Original file | Final file |
|---|---|---|
| Filename | modeM0/AS1T03_123T01_9000003000cztM0_level2.fits | modeM0/AS1T03_123T01_9000003000cztM0_level2_quad_clean.evt |
| Size (bytes) | 867,571,200 | 647,424,000 |
| Size | 827.4 MB | 617.4 MB |
| Events in quadrant A | 5,408,780 | 3,615,183 |
| Events in quadrant B | 5,218,930 | 3,615,372 |
| Events in quadrant C | 5,207,450 | 3,371,052 |
| Events in quadrant D | 4,557,374 | 3,121,376 |
| Mode M9 | |||
|---|---|---|---|
| Quadrant | BADHDUFLAG | Total packets | Discarded packets |
| A | 0 | 149 | 0 |
| B | 0 | 149 | 0 |
| C | 0 | 149 | 0 |
| D | 0 | 149 | 0 |
| Mode SS | |||
|---|---|---|---|
| Quadrant | BADHDUFLAG | Total packets | Discarded packets |
| A | 0 | 1748 | 0 |
| B | 0 | 1748 | 0 |
| C | 0 | 1748 | 0 |
| D | 0 | 1748 | 0 |
| Mode M0 | |||
|---|---|---|---|
| Quadrant | BADHDUFLAG | Total packets | Discarded packets |
| A | 0 | 179315 | 0 |
| B | 0 | 182151 | 0 |
| C | 0 | 179677 | 0 |
| D | 0 | 220376 | 0 |
| Quadrant | Total seconds | Saturated seconds | Saturation percentage |
|---|---|---|---|
| A | 85795 | 1120 | 1.305437% |
| B | 85795 | 1367 | 1.593333% |
| C | 85795 | 1586 | 1.848593% |
| D | 85795 | 3207 | 3.737980% |
Noise dominated data is calculated using 1-second bins in cleaned event files. If a bin has >2000 counts, and if more than 50% of those come from <1% of pixels, then it is considered to be noise-dominated and hence unusable.
| Quadrant | # 1 sec bins | Bins with >0 counts | Bins with >2000 counts | High rate bins dominated by noise | Noise dominated (total time) | Noise dominated (detector-on time) | Marked lightcurve |
|---|---|---|---|---|---|---|---|
| A | 100640 | 85795 | 0 | 0 | 0.00% | 0.00% |  |
| B | 100640 | 85793 | 0 | 0 | 0.00% | 0.00% |  |
| C | 100640 | 85795 | 0 | 0 | 0.00% | 0.00% |  |
| D | 100640 | 85784 | 0 | 0 | 0.00% | 0.00% |  |
Top three noisy pixels from each quadrant. If the there are fewer than three noisy pixels in the level2.evt file, extra rows are filled as -1
| Pixel properties | Quadrant properties | ||||||
|---|---|---|---|---|---|---|---|
| Quadrant | DetID | PixID | Counts | Sigma | Mean | Median | Sigma |
| A | 0 | 29 | 5120 | 11.1 | 1407 | 1322 | 342.2 |
| A | 7 | 110 | 4399 | 8.99 | 1407 | 1322 | 342.2 |
| A | 0 | 30 | 4087 | 8.08 | 1407 | 1322 | 342.2 |
| B | 2 | 9 | 4076 | 10.19 | 1375 | 1313 | 271.1 |
| B | 2 | 8 | 3443 | 7.86 | 1375 | 1313 | 271.1 |
| B | 5 | 232 | 3358 | 7.54 | 1375 | 1313 | 271.1 |
| C | 1 | 80 | 3972 | 7.58 | 1374 | 1280 | 355.3 |
| C | 1 | 81 | 3897 | 7.37 | 1374 | 1280 | 355.3 |
| C | 12 | 241 | 3627 | 6.61 | 1374 | 1280 | 355.3 |
| D | 3 | 14 | 3361 | 6.32 | 1301 | 1190 | 343.5 |
| D | 6 | 67 | 3249 | 5.99 | 1301 | 1190 | 343.5 |
| D | 10 | 189 | 3191 | 5.83 | 1301 | 1190 | 343.5 |
Histogram calculated using DETX and DETY for each event in the final _common_clean file
| Quadrant A | 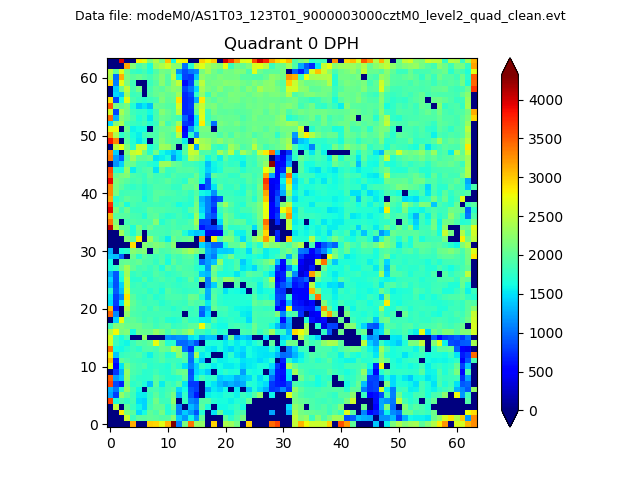 |
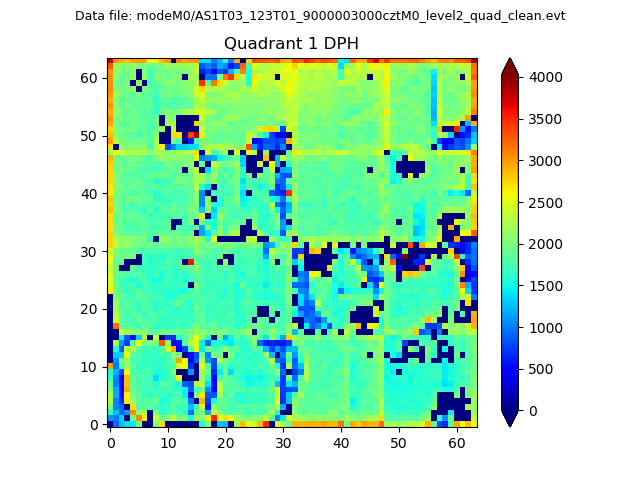 |
Quadrant B |
|---|---|---|---|
| Quadrant D |  |
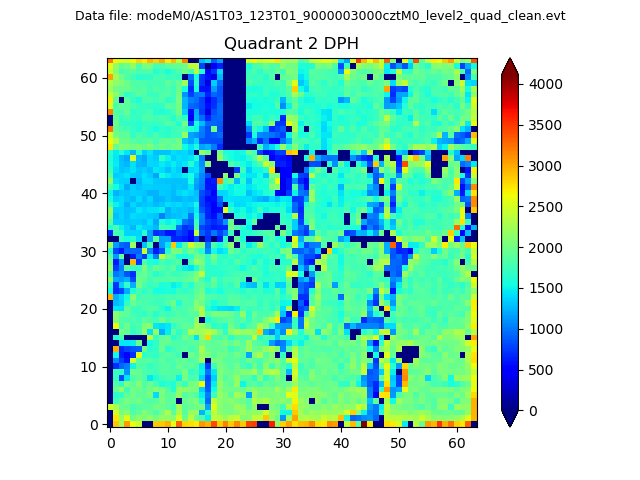 |
Quadrant C |
| Plot type | Count rate plots | Images |
|---|---|---|
| Comparison with Poisson distribution Blue bars denote a histogram of data divided into 1 sec bins. Red curve is a Poisson curve with rate = median count rate of data. |
 |
 |
| Quadrant-wise count rates Data is divided into 100 sec bins |
 |
|
| Module-wise count rates for Quadrant A Data is divided into 100 sec bins |
 |
 |
| Module-wise count rates for Quadrant B Data is divided into 100 sec bins |
 |
 |
| Module-wise count rates for Quadrant C Data is divided into 100 sec bins |
 |
 |
| Module-wise count rates for Quadrant D Data is divided into 100 sec bins |
 |
 |
| Parameter | Plot |
|---|---|
| CZT HV Monitor |  |
| D_VDD | 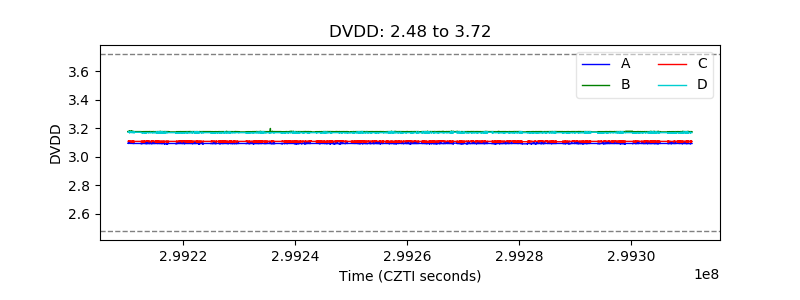 |
| Temperature 1 |  |
| Veto HV Monitor |  |
| Veto LLD |  |
| Alpha Counter |  |
| _CPM_Rate |  |
| CZT Counter |  |
| +2.5 Volts monitor |  |
| +5 Volts monitor |  |
| _ROLL_ROT |  |
| _Roll_DEC |  |
| _Roll_RA |  |
| Veto Counter |  |