| Param | Original file | Final file |
|---|---|---|
| Filename | modeM0/AS1T03_123T01_9000003000_20233cztM0_level2.evt | modeM0/AS1T03_123T01_9000003000_20233cztM0_level2_quad_clean.evt |
| Size (bytes) | 183,015,360 | 47,185,920 |
| Size | 174.5 MB | 45.0 MB |
| Events in quadrant A | 1,282,699 | 323,689 |
| Events in quadrant B | 1,525,640 | 327,160 |
| Events in quadrant C | 1,287,451 | 303,441 |
| Events in quadrant D | 1,283,731 | 303,956 |
| Mode M9 | |||
|---|---|---|---|
| Quadrant | BADHDUFLAG | Total packets | Discarded packets |
| A | 0 | 11 | 0 |
| B | 0 | 11 | 0 |
| C | 0 | 11 | 0 |
| D | 0 | 11 | 0 |
| Mode SS | |||
|---|---|---|---|
| Quadrant | BADHDUFLAG | Total packets | Discarded packets |
| A | 0 | 52 | 0 |
| B | 0 | 52 | 0 |
| C | 0 | 52 | 0 |
| D | 0 | 52 | 0 |
| Mode M0 | |||
|---|---|---|---|
| Quadrant | BADHDUFLAG | Total packets | Discarded packets |
| A | 0 | 5129 | 1 |
| B | 0 | 5997 | 1 |
| C | 0 | 5153 | 1 |
| D | 0 | 5212 | 1 |
| Quadrant | Total seconds | Saturated seconds | Saturation percentage |
|---|---|---|---|
| A | 2360 | 43 | 1.822034% |
| B | 2360 | 69 | 2.923729% |
| C | 2360 | 78 | 3.305085% |
| D | 2360 | 35 | 1.483051% |
Noise dominated data is calculated using 1-second bins in cleaned event files. If a bin has >2000 counts, and if more than 50% of those come from <1% of pixels, then it is considered to be noise-dominated and hence unusable.
| Quadrant | # 1 sec bins | Bins with >0 counts | Bins with >2000 counts | High rate bins dominated by noise | Noise dominated (total time) | Noise dominated (detector-on time) | Marked lightcurve |
|---|---|---|---|---|---|---|---|
| A | 3540 | 2361 | 0 | 0 | 0.00% | 0.00% | 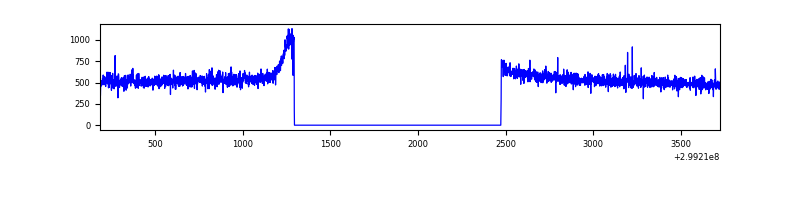 |
| B | 3540 | 2361 | 0 | 0 | 0.00% | 0.00% | 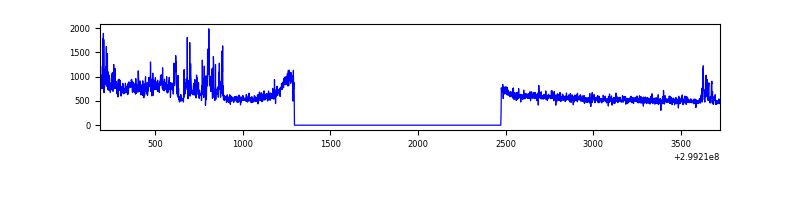 |
| C | 3540 | 2361 | 0 | 0 | 0.00% | 0.00% | 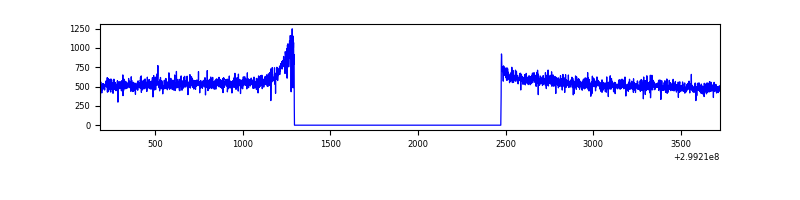 |
| D | 3540 | 2361 | 3 | 3 | 0.08% | 0.13% | 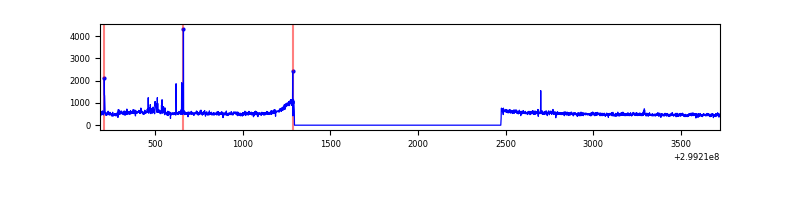 |
Top three noisy pixels from each quadrant. If the there are fewer than three noisy pixels in the level2.evt file, extra rows are filled as -1
| Pixel properties | Quadrant properties | ||||||
|---|---|---|---|---|---|---|---|
| Quadrant | DetID | PixID | Counts | Sigma | Mean | Median | Sigma |
| A | 0 | 226 | 2740 | 35.25 | 333 | 327 | 68.5 |
| A | 3 | 137 | 2442 | 30.9 | 333 | 327 | 68.5 |
| A | 12 | 194 | 2276 | 28.47 | 333 | 327 | 68.5 |
| B | 10 | 245 | 221159 | 3425.92 | 330 | 322 | 64.5 |
| B | 12 | 111 | 7418 | 110.08 | 330 | 322 | 64.5 |
| B | 0 | 214 | 6873 | 101.63 | 330 | 322 | 64.5 |
| C | 14 | 238 | 50429 | 667.27 | 316 | 318 | 75.1 |
| C | 3 | 233 | 3464 | 41.89 | 316 | 318 | 75.1 |
| C | 9 | 54 | 2309 | 26.51 | 316 | 318 | 75.1 |
| D | 1 | 52 | 47013 | 598.66 | 322 | 313 | 78.0 |
| D | 2 | 120 | 11420 | 142.38 | 322 | 313 | 78.0 |
| D | 2 | 234 | 11336 | 141.31 | 322 | 313 | 78.0 |
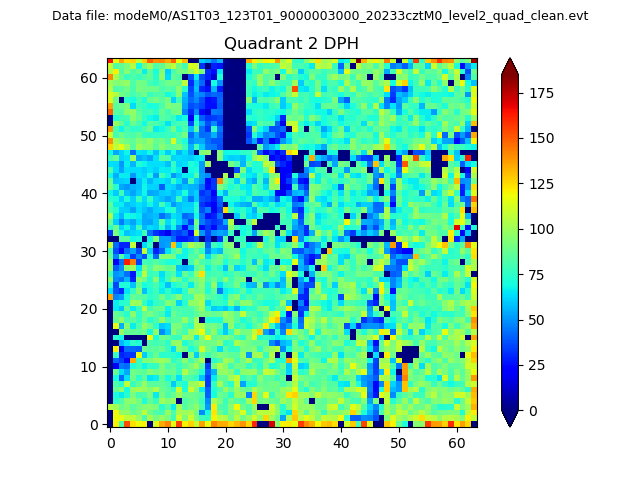
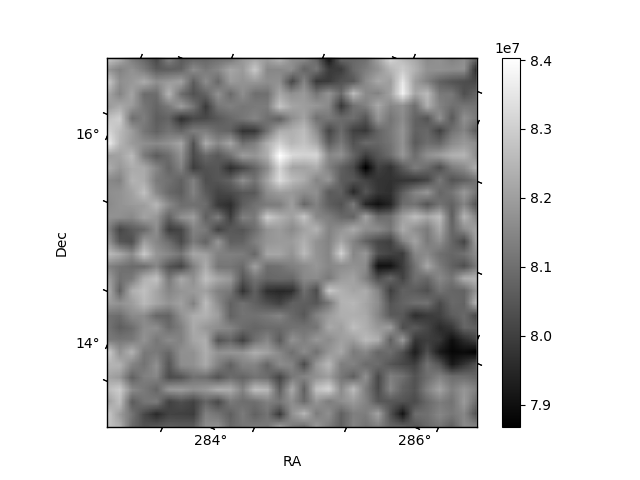
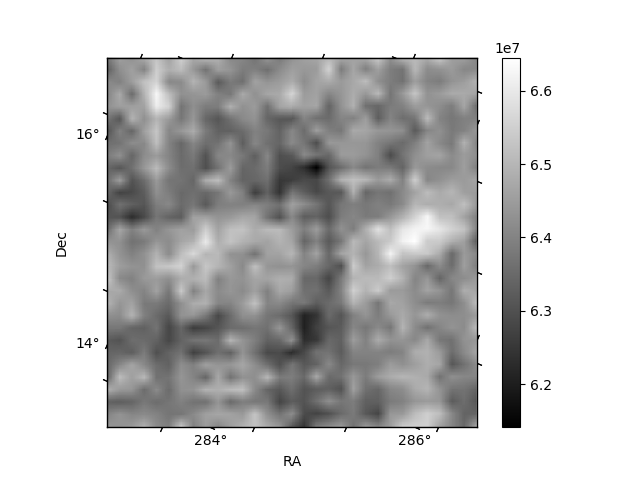
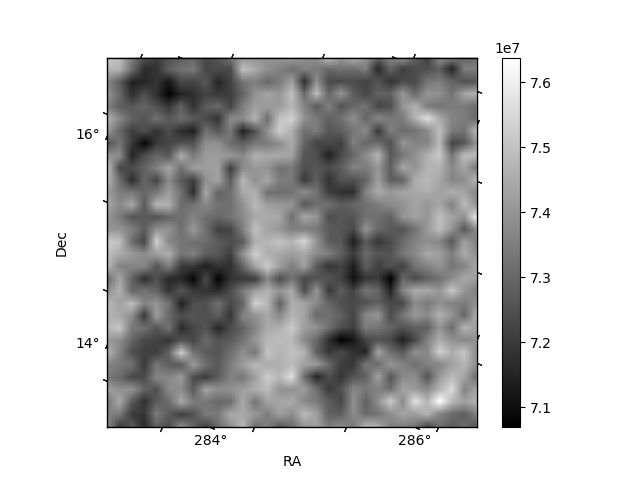
Histogram calculated using DETX and DETY for each event in the final _common_clean file
| Quadrant A | 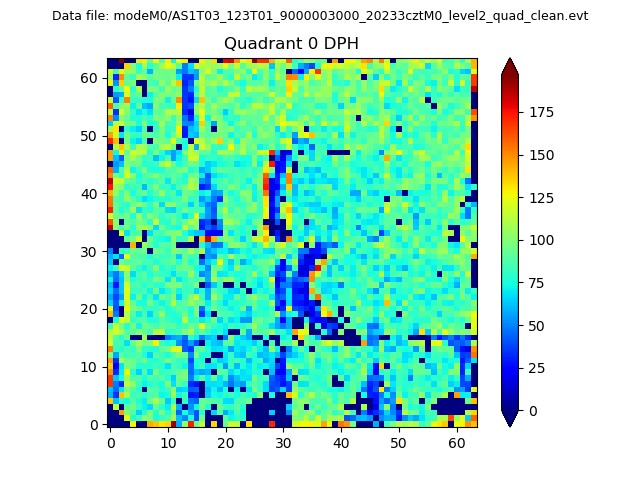 |
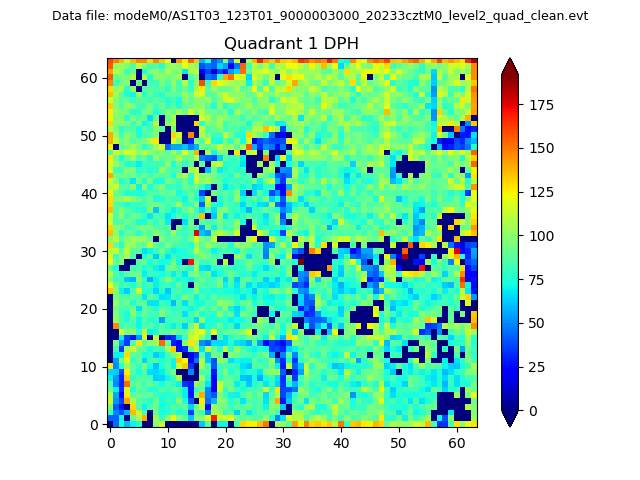 |
Quadrant B |
|---|---|---|---|
| Quadrant D | 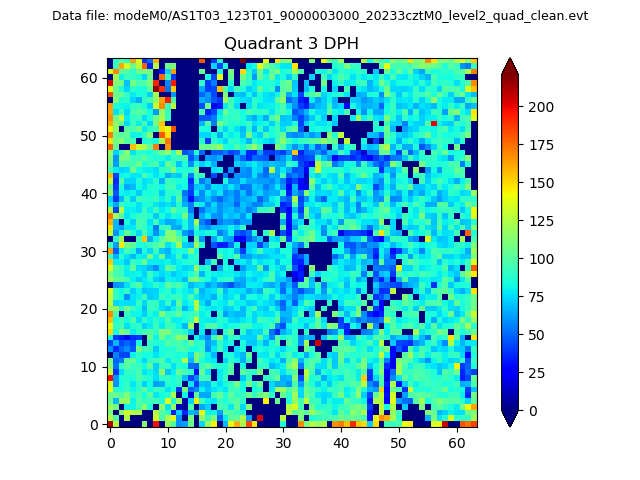 |
 |
Quadrant C |
| Plot type | Count rate plots | Images |
|---|---|---|
| Comparison with Poisson distribution Blue bars denote a histogram of data divided into 1 sec bins. Red curve is a Poisson curve with rate = median count rate of data. |
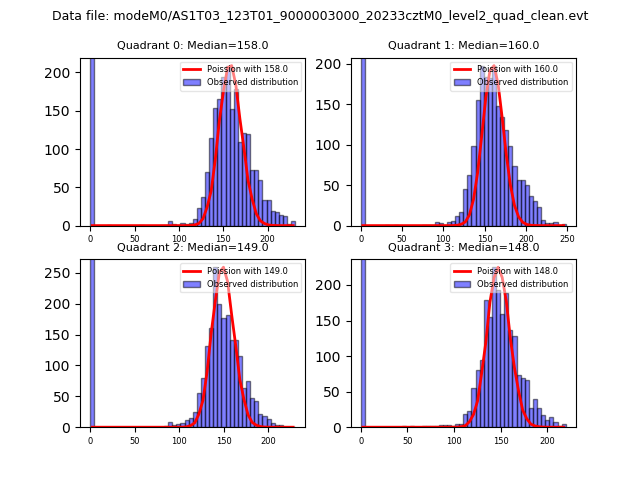 |
 |
| Quadrant-wise count rates Data is divided into 100 sec bins |
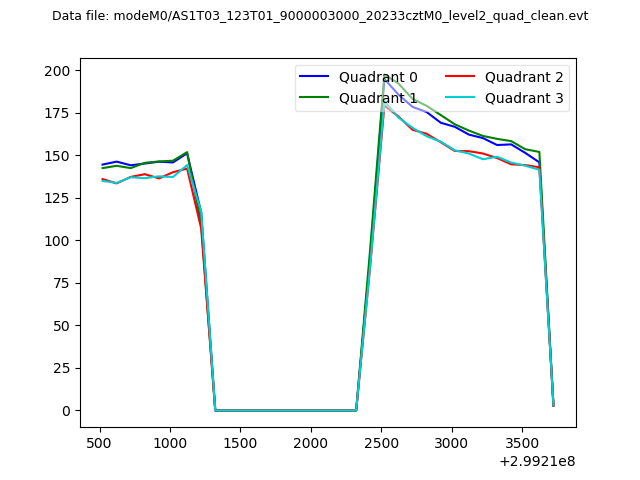 |
|
| Module-wise count rates for Quadrant A Data is divided into 100 sec bins |
 |
 |
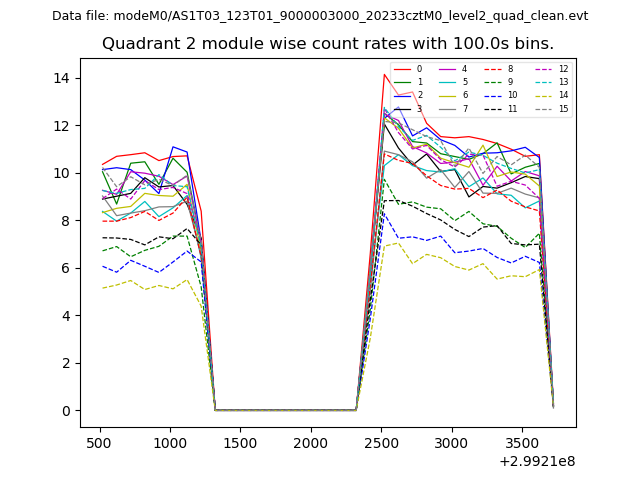
| Module-wise count rates for Quadrant B Data is divided into 100 sec bins |
 |
 |
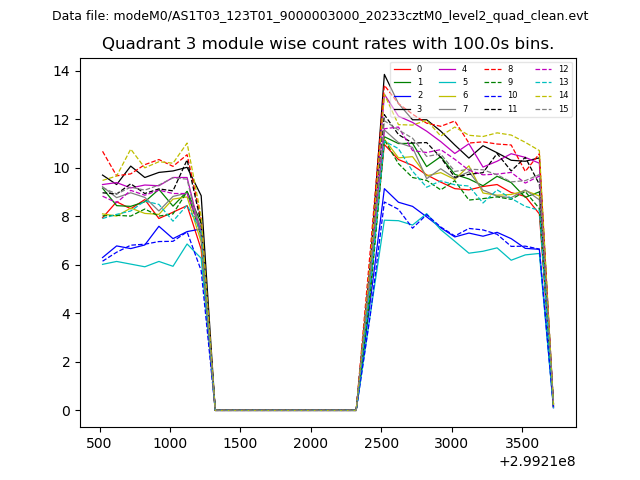
| Module-wise count rates for Quadrant C Data is divided into 100 sec bins |
 |
 |
| Module-wise count rates for Quadrant D Data is divided into 100 sec bins |
 |
 |
| Parameter | Plot |
|---|---|
| CZT HV Monitor | 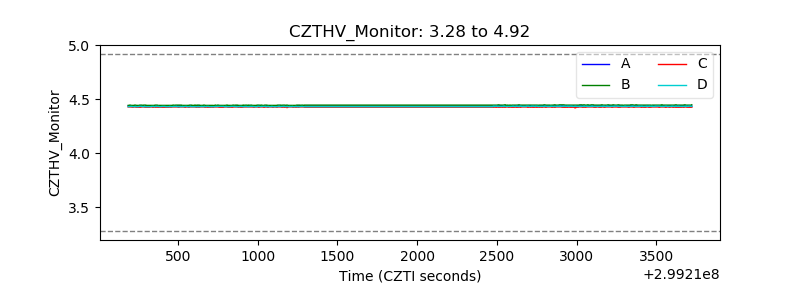 |
| D_VDD | 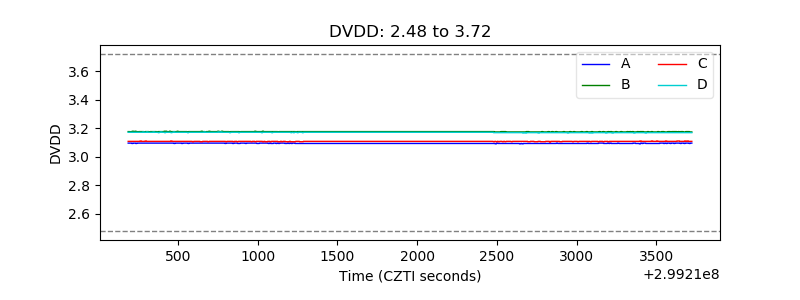 |
| Temperature 1 | 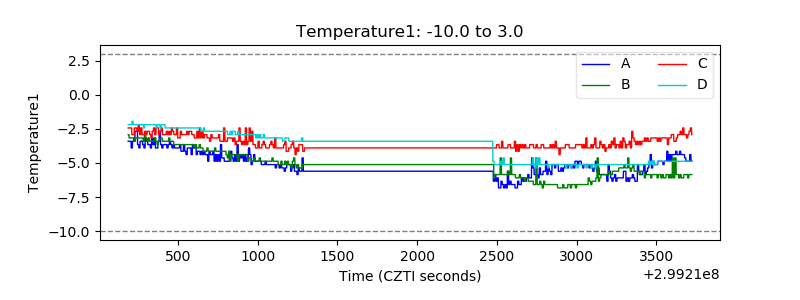 |
| Veto HV Monitor | 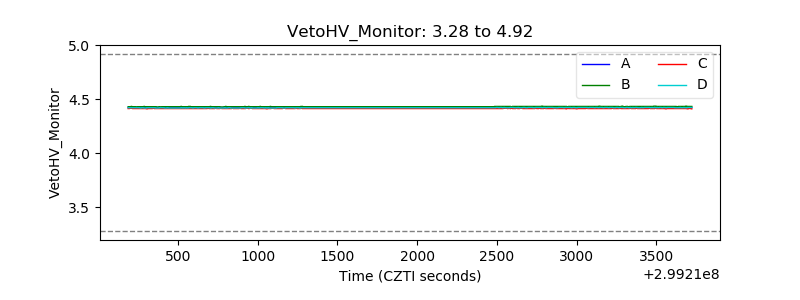 |
| Veto LLD |  |
| Alpha Counter | 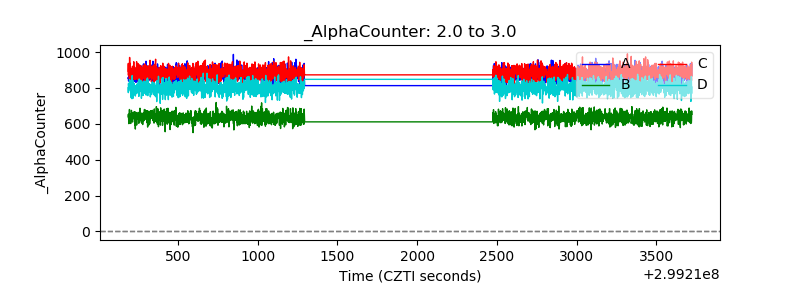 |
| _CPM_Rate | 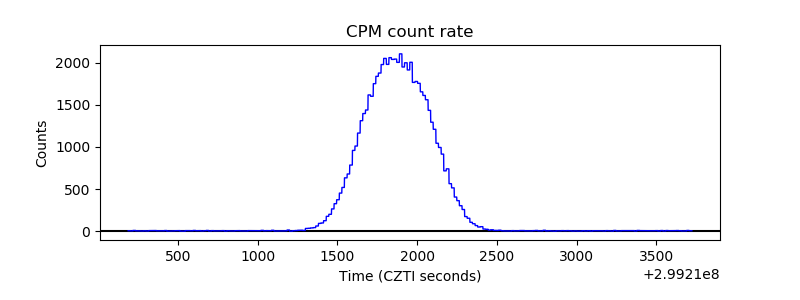 |
| CZT Counter | 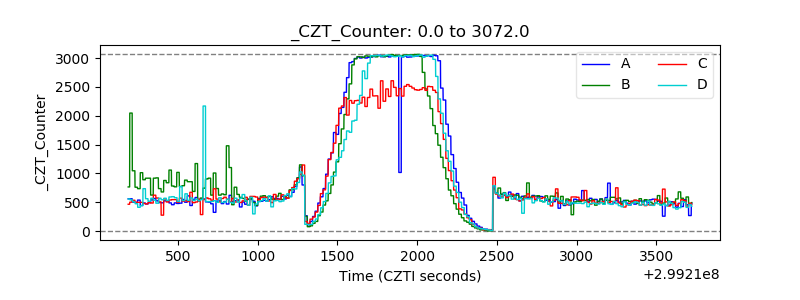 |
| +2.5 Volts monitor |  |
| +5 Volts monitor |  |
| _ROLL_ROT |  |
| _Roll_DEC | 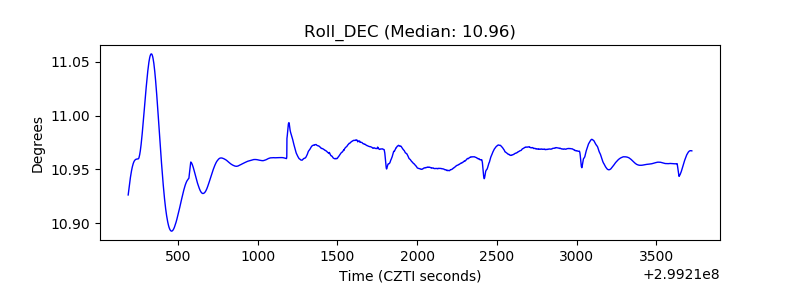 |
| _Roll_RA | 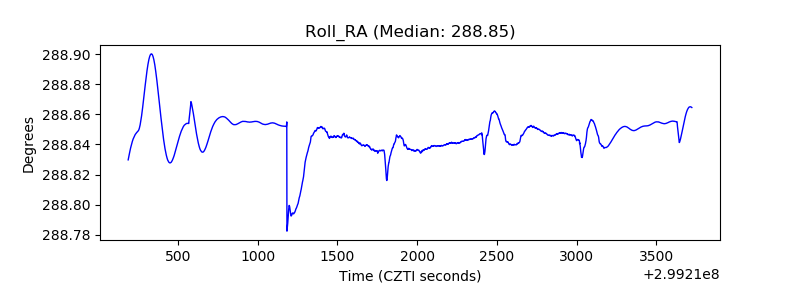 |
| Veto Counter |  |