| Param | Original file | Final file |
|---|---|---|
| Filename | modeM0/AS1T03_123T01_9000003000_20235cztM0_level2.evt | modeM0/AS1T03_123T01_9000003000_20235cztM0_level2_quad_clean.evt |
| Size (bytes) | 471,991,680 | 90,593,280 |
| Size | 450.1 MB | 86.4 MB |
| Events in quadrant A | 3,415,720 | 592,155 |
| Events in quadrant B | 3,444,688 | 602,768 |
| Events in quadrant C | 3,353,053 | 556,384 |
| Events in quadrant D | 3,650,490 | 549,809 |
| Mode M9 | |||
|---|---|---|---|
| Quadrant | BADHDUFLAG | Total packets | Discarded packets |
| A | 0 | 19 | 0 |
| B | 0 | 20 | 0 |
| C | 0 | 20 | 0 |
| D | 0 | 20 | 0 |
| Mode SS | |||
|---|---|---|---|
| Quadrant | BADHDUFLAG | Total packets | Discarded packets |
| A | 0 | 128 | 0 |
| B | 0 | 128 | 0 |
| C | 0 | 128 | 0 |
| D | 0 | 128 | 0 |
| Mode M0 | |||
|---|---|---|---|
| Quadrant | BADHDUFLAG | Total packets | Discarded packets |
| A | 0 | 13729 | 3 |
| B | 0 | 13829 | 2 |
| C | 0 | 13602 | 2 |
| D | 0 | 14632 | 2 |
| Quadrant | Total seconds | Saturated seconds | Saturation percentage |
|---|---|---|---|
| A | 6342 | 79 | 1.245664% |
| B | 6342 | 102 | 1.608325% |
| C | 6342 | 98 | 1.545254% |
| D | 6342 | 116 | 1.829076% |
Noise dominated data is calculated using 1-second bins in cleaned event files. If a bin has >2000 counts, and if more than 50% of those come from <1% of pixels, then it is considered to be noise-dominated and hence unusable.
| Quadrant | # 1 sec bins | Bins with >0 counts | Bins with >2000 counts | High rate bins dominated by noise | Noise dominated (total time) | Noise dominated (detector-on time) | Marked lightcurve |
|---|---|---|---|---|---|---|---|
| A | 7637 | 6344 | 2 | 2 | 0.03% | 0.03% | 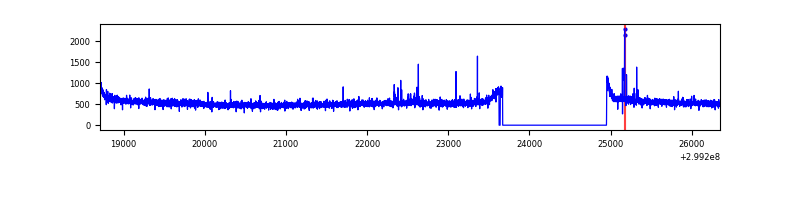 |
| B | 7637 | 6344 | 3 | 3 | 0.04% | 0.05% | 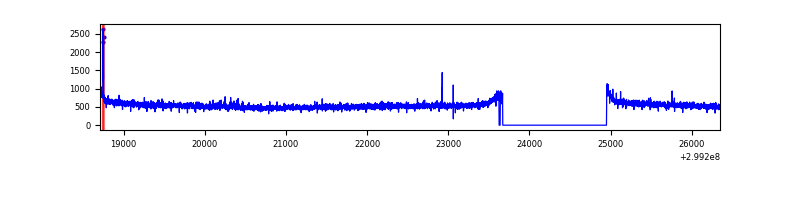 |
| C | 7637 | 6344 | 0 | 0 | 0.00% | 0.00% | 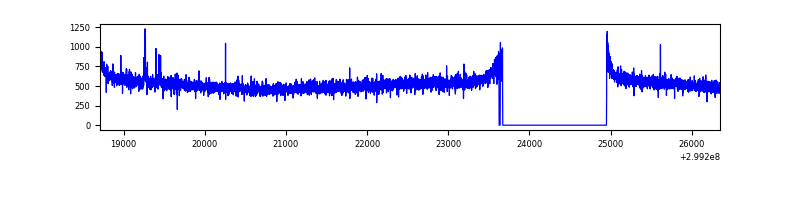 |
| D | 7637 | 6344 | 49 | 49 | 0.64% | 0.77% | 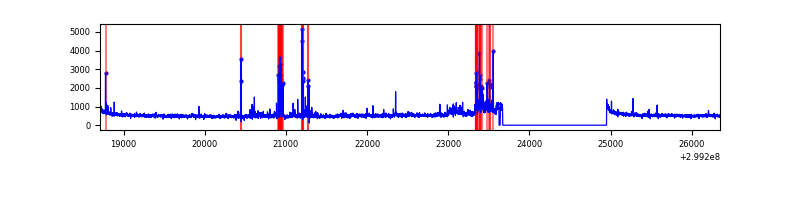 |
Top three noisy pixels from each quadrant. If the there are fewer than three noisy pixels in the level2.evt file, extra rows are filled as -1
| Pixel properties | Quadrant properties | ||||||
|---|---|---|---|---|---|---|---|
| Quadrant | DetID | PixID | Counts | Sigma | Mean | Median | Sigma |
| A | 4 | 2 | 31966 | 178.8 | 879 | 865 | 173.9 |
| A | 0 | 226 | 7606 | 38.75 | 879 | 865 | 173.9 |
| A | 3 | 137 | 6706 | 33.58 | 879 | 865 | 173.9 |
| B | 12 | 111 | 19333 | 113.63 | 869 | 850 | 162.7 |
| B | 11 | 111 | 17248 | 100.81 | 869 | 850 | 162.7 |
| B | 14 | 111 | 16167 | 94.17 | 869 | 850 | 162.7 |
| C | 14 | 238 | 132877 | 696.68 | 821 | 828 | 189.5 |
| C | 9 | 54 | 10812 | 52.67 | 821 | 828 | 189.5 |
| C | 3 | 233 | 8089 | 38.31 | 821 | 828 | 189.5 |
| D | 1 | 52 | 225312 | 1104.66 | 840 | 818 | 203.2 |
| D | 11 | 176 | 168376 | 824.5 | 840 | 818 | 203.2 |
| D | 12 | 218 | 68999 | 335.5 | 840 | 818 | 203.2 |
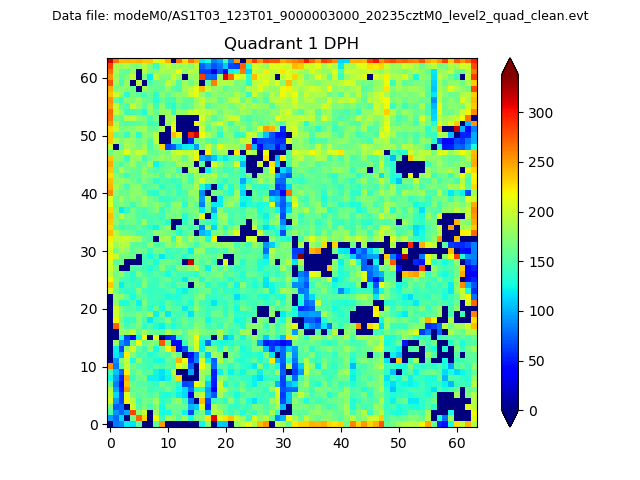
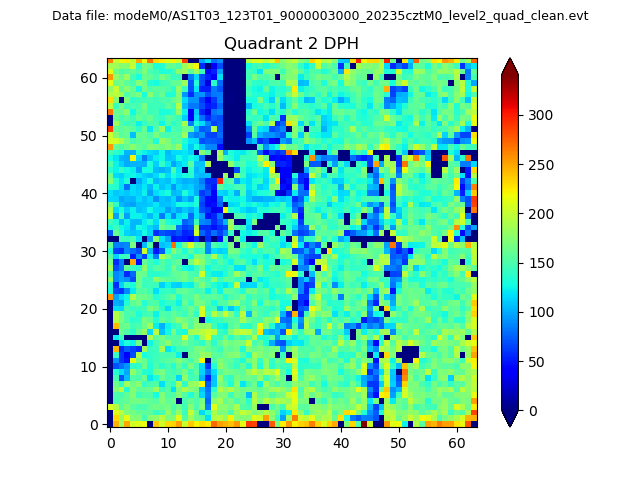
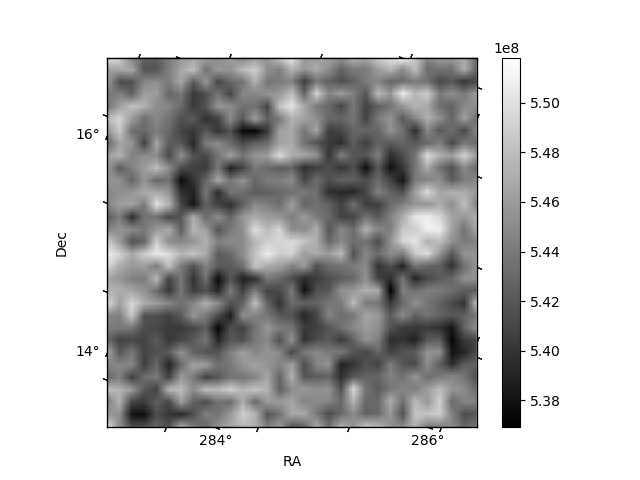
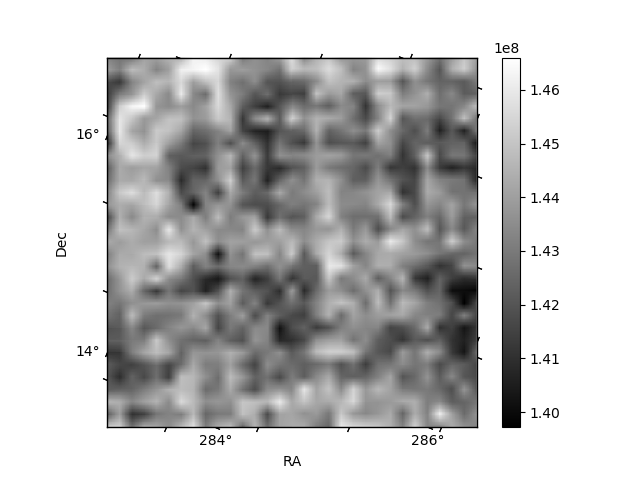
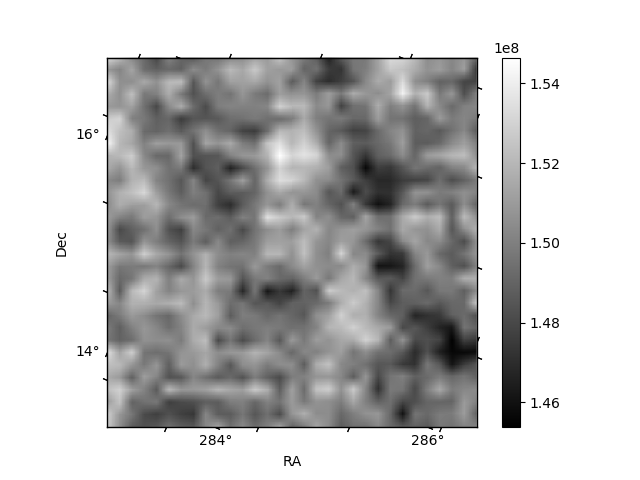
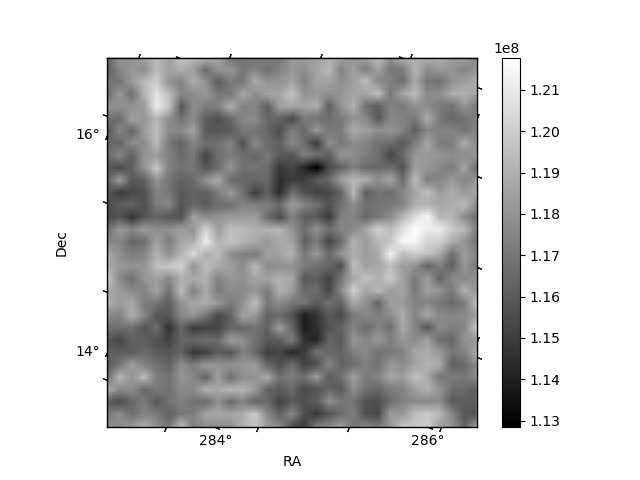
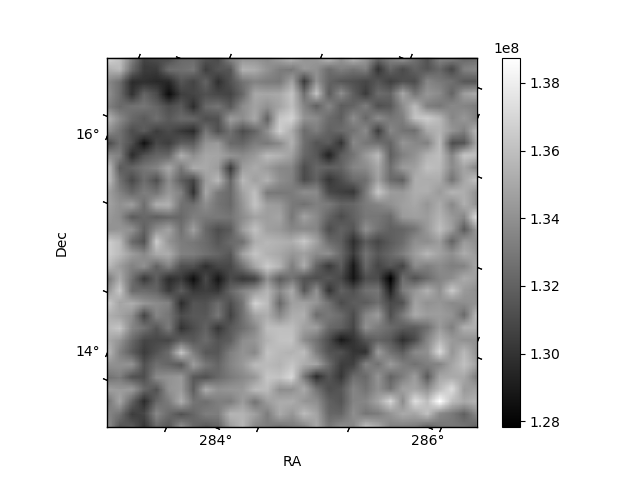
Histogram calculated using DETX and DETY for each event in the final _common_clean file
| Quadrant A |  |
 |
Quadrant B |
|---|---|---|---|
| Quadrant D | 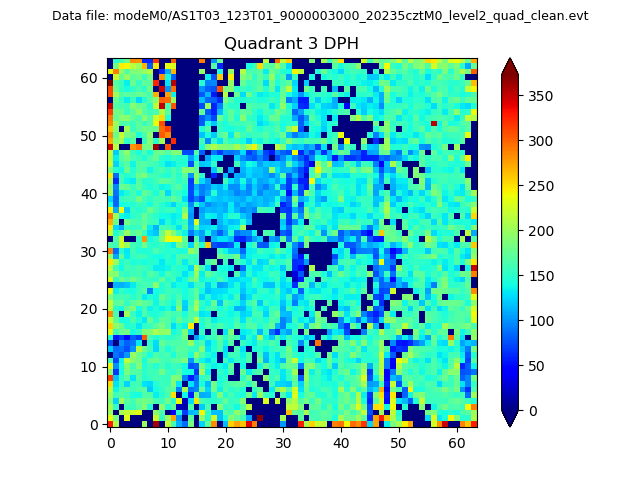 |
 |
Quadrant C |
| Plot type | Count rate plots | Images |
|---|---|---|
| Comparison with Poisson distribution Blue bars denote a histogram of data divided into 1 sec bins. Red curve is a Poisson curve with rate = median count rate of data. |
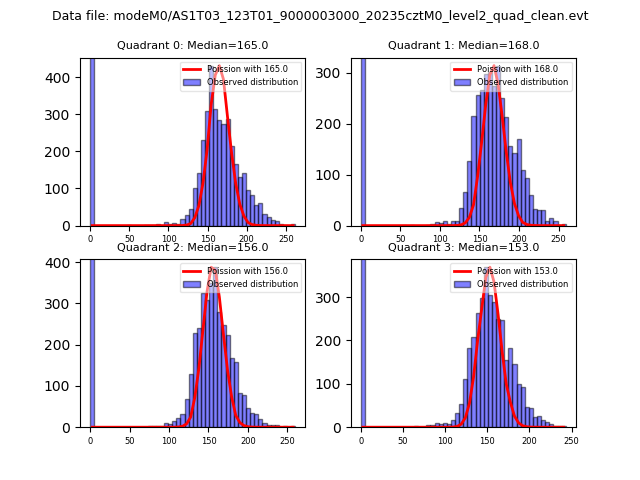 |
 |
| Quadrant-wise count rates Data is divided into 100 sec bins |
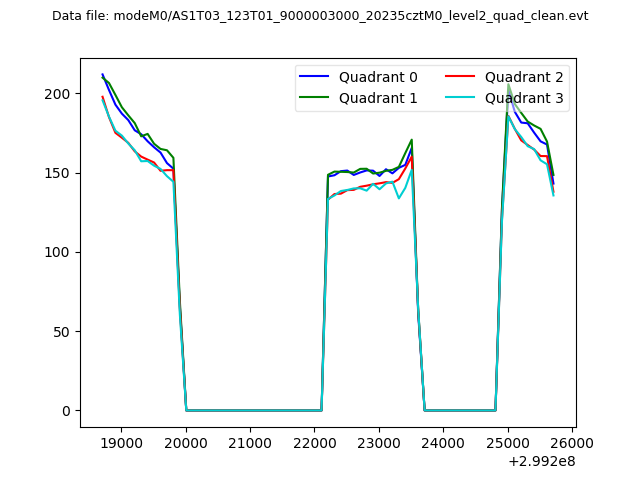 |
|
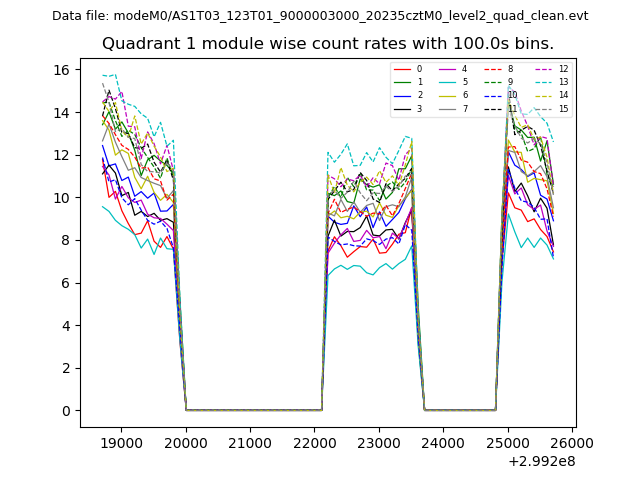
| Module-wise count rates for Quadrant A Data is divided into 100 sec bins |
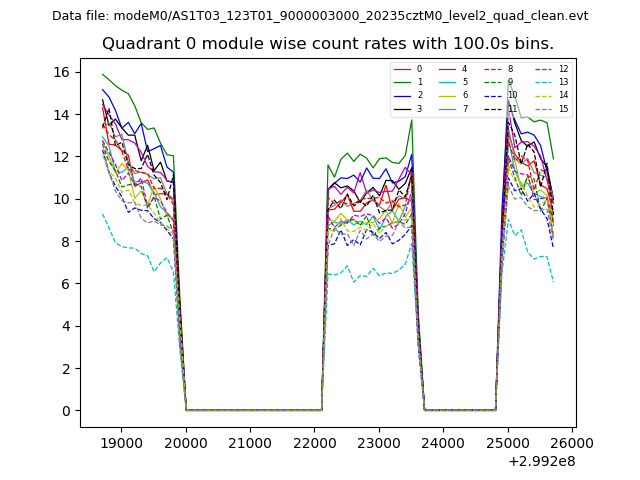 |
 |
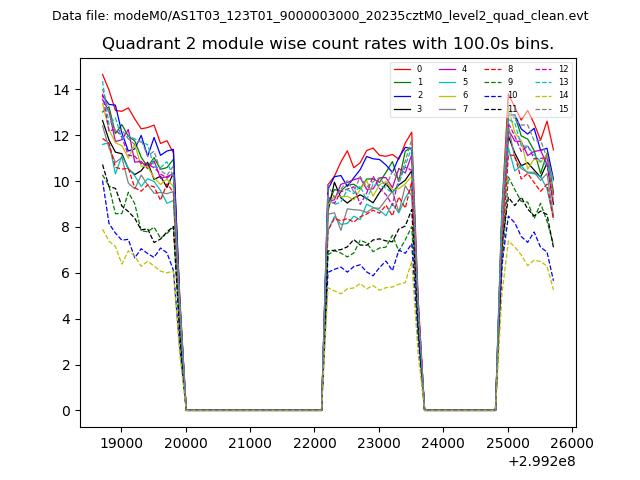
| Module-wise count rates for Quadrant B Data is divided into 100 sec bins |
 |
 |
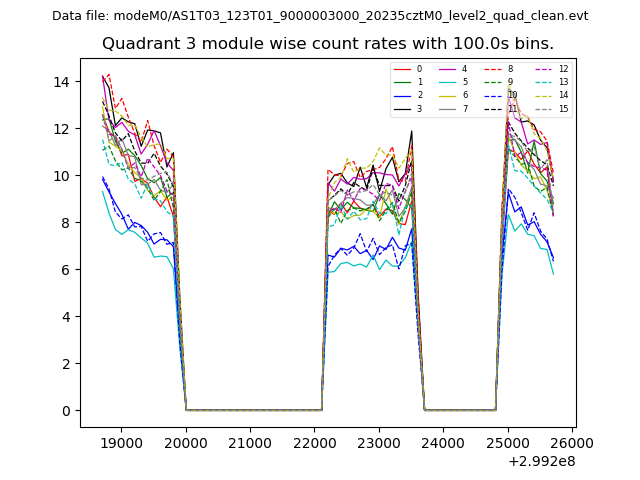
| Module-wise count rates for Quadrant C Data is divided into 100 sec bins |
 |
 |
| Module-wise count rates for Quadrant D Data is divided into 100 sec bins |
 |
 |
| Parameter | Plot |
|---|---|
| CZT HV Monitor | 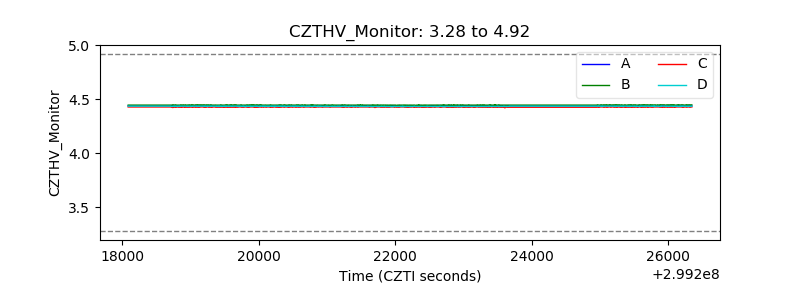 |
| D_VDD | 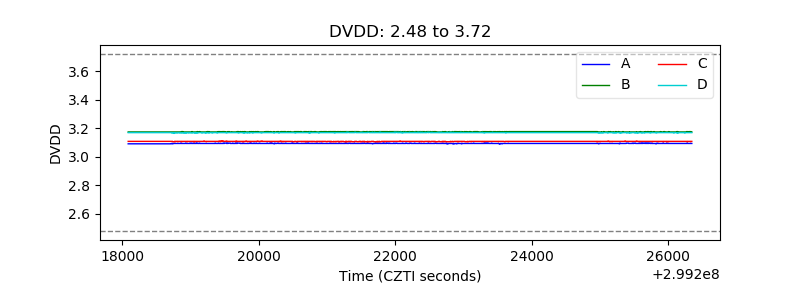 |
| Temperature 1 | 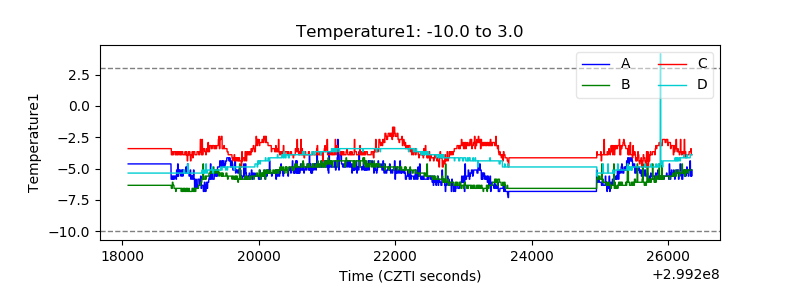 |
| Veto HV Monitor | 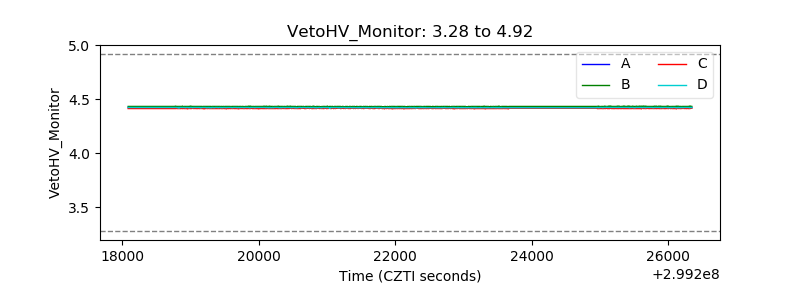 |
| Veto LLD | 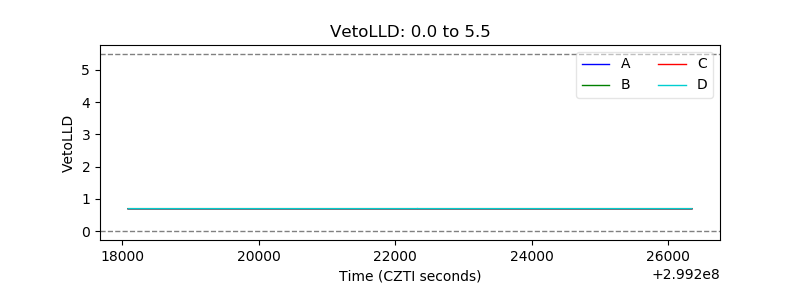 |
| Alpha Counter | 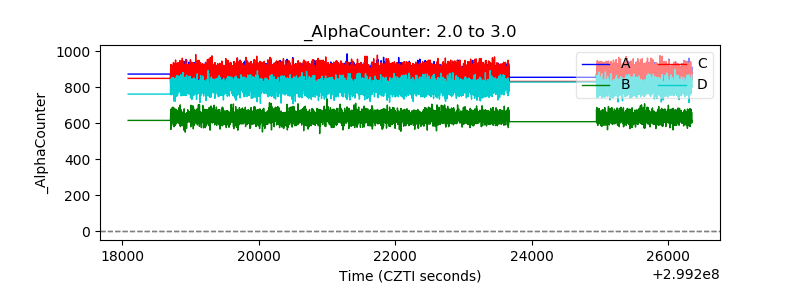 |
| _CPM_Rate | 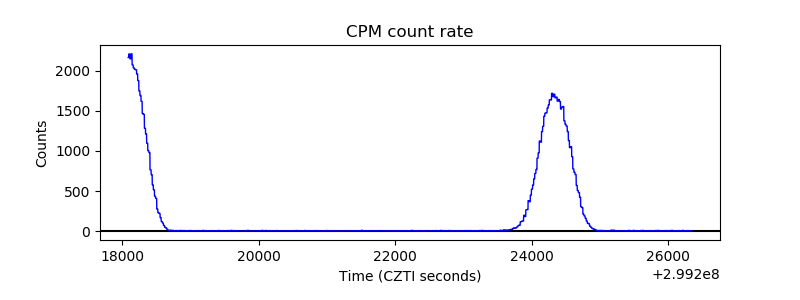 |
| CZT Counter | 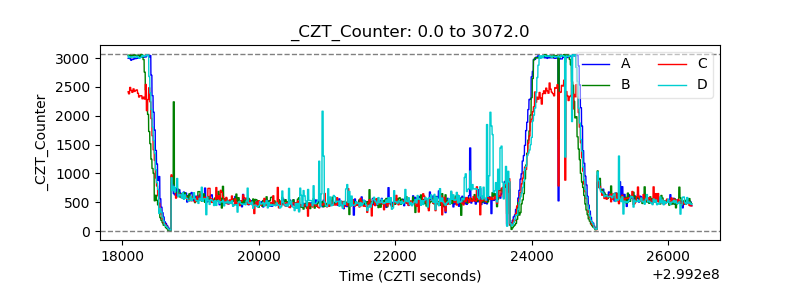 |
| +2.5 Volts monitor | 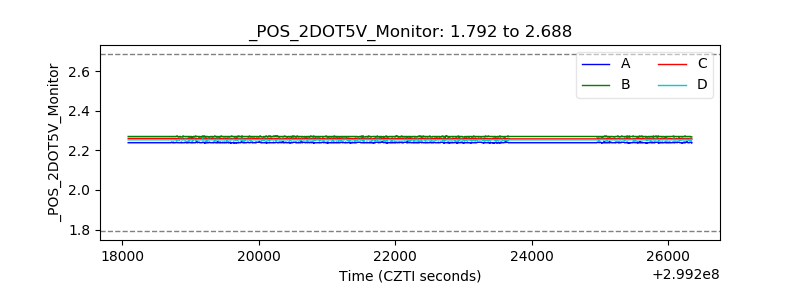 |
| +5 Volts monitor |  |
| _ROLL_ROT | 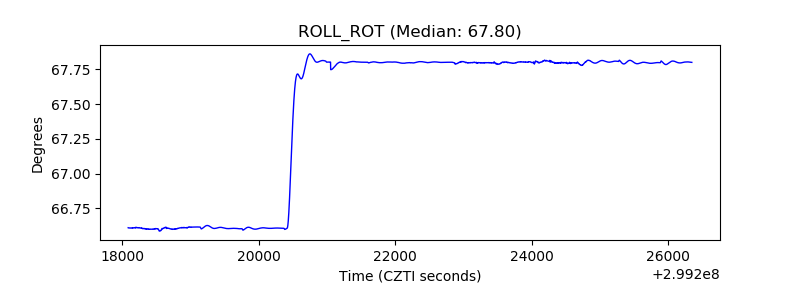 |
| _Roll_DEC | 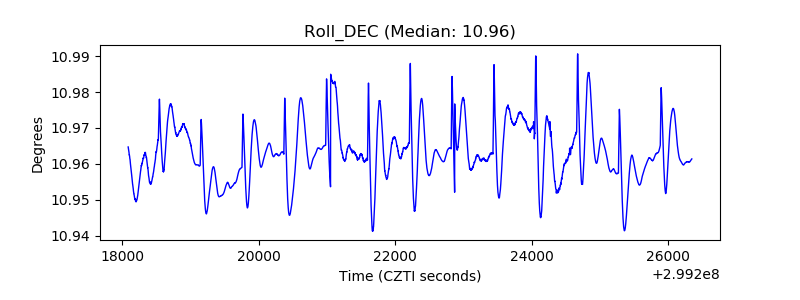 |
| _Roll_RA | 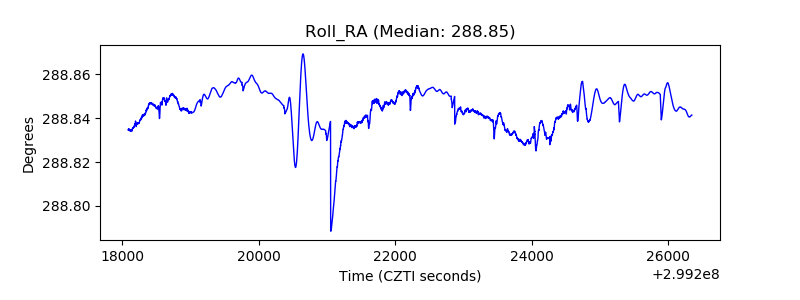 |
| Veto Counter | 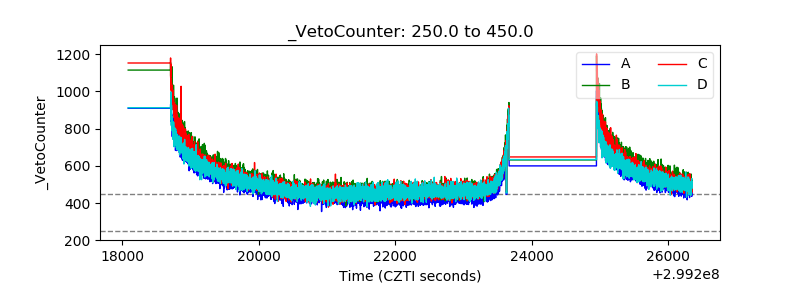 |