| Param | Original file | Final file |
|---|---|---|
| Filename | modeM0/AS1T03_123T01_9000003000_20237cztM0_level2.evt | modeM0/AS1T03_123T01_9000003000_20237cztM0_level2_quad_clean.evt |
| Size (bytes) | 461,076,480 | 71,035,200 |
| Size | 439.7 MB | 67.7 MB |
| Events in quadrant A | 3,336,208 | 437,091 |
| Events in quadrant B | 3,418,900 | 442,349 |
| Events in quadrant C | 3,311,495 | 411,935 |
| Events in quadrant D | 3,462,878 | 413,561 |
| Mode M9 | |||
|---|---|---|---|
| Quadrant | BADHDUFLAG | Total packets | Discarded packets |
| A | 0 | 18 | 0 |
| B | 0 | 19 | 0 |
| C | 0 | 19 | 0 |
| D | 0 | 19 | 0 |
| Mode SS | |||
|---|---|---|---|
| Quadrant | BADHDUFLAG | Total packets | Discarded packets |
| A | 0 | 130 | 0 |
| B | 0 | 130 | 0 |
| C | 0 | 130 | 0 |
| D | 0 | 130 | 0 |
| Mode M0 | |||
|---|---|---|---|
| Quadrant | BADHDUFLAG | Total packets | Discarded packets |
| A | 0 | 13542 | 2 |
| B | 0 | 13742 | 2 |
| C | 0 | 13475 | 2 |
| D | 0 | 14234 | 2 |
| Quadrant | Total seconds | Saturated seconds | Saturation percentage |
|---|---|---|---|
| A | 6390 | 121 | 1.893584% |
| B | 6390 | 135 | 2.112676% |
| C | 6390 | 138 | 2.159624% |
| D | 6390 | 95 | 1.486698% |
Noise dominated data is calculated using 1-second bins in cleaned event files. If a bin has >2000 counts, and if more than 50% of those come from <1% of pixels, then it is considered to be noise-dominated and hence unusable.
| Quadrant | # 1 sec bins | Bins with >0 counts | Bins with >2000 counts | High rate bins dominated by noise | Noise dominated (total time) | Noise dominated (detector-on time) | Marked lightcurve |
|---|---|---|---|---|---|---|---|
| A | 7515 | 6392 | 0 | 0 | 0.00% | 0.00% | 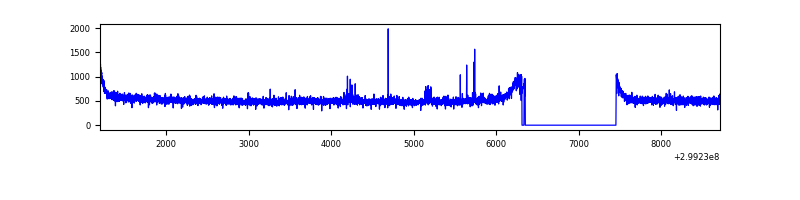 |
| B | 7515 | 6392 | 1 | 1 | 0.01% | 0.02% | 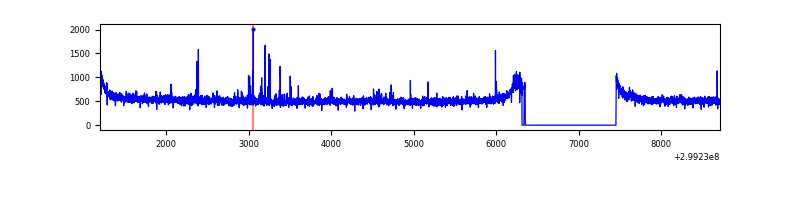 |
| C | 7515 | 6392 | 0 | 0 | 0.00% | 0.00% | 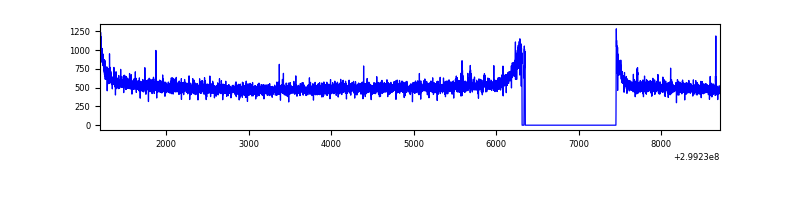 |
| D | 7515 | 6392 | 20 | 20 | 0.27% | 0.31% | 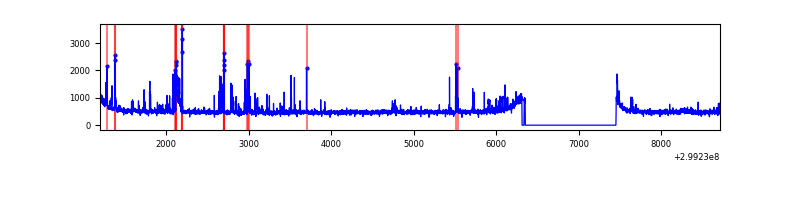 |
Top three noisy pixels from each quadrant. If the there are fewer than three noisy pixels in the level2.evt file, extra rows are filled as -1
| Pixel properties | Quadrant properties | ||||||
|---|---|---|---|---|---|---|---|
| Quadrant | DetID | PixID | Counts | Sigma | Mean | Median | Sigma |
| A | 4 | 2 | 19934 | 112.27 | 859 | 844 | 170.0 |
| A | 0 | 226 | 7277 | 37.83 | 859 | 844 | 170.0 |
| A | 3 | 137 | 6725 | 34.59 | 859 | 844 | 170.0 |
| B | 10 | 245 | 50508 | 306.17 | 849 | 828 | 162.3 |
| B | 0 | 214 | 32841 | 197.29 | 849 | 828 | 162.3 |
| B | 12 | 111 | 19988 | 118.08 | 849 | 828 | 162.3 |
| C | 14 | 238 | 127192 | 672.13 | 807 | 814 | 188.0 |
| C | 3 | 233 | 28587 | 147.71 | 807 | 814 | 188.0 |
| C | 13 | 61 | 5623 | 25.58 | 807 | 814 | 188.0 |
| D | 11 | 176 | 191689 | 949.04 | 829 | 808 | 201.1 |
| D | 7 | 238 | 46477 | 227.06 | 829 | 808 | 201.1 |
| D | 5 | 222 | 43016 | 209.85 | 829 | 808 | 201.1 |
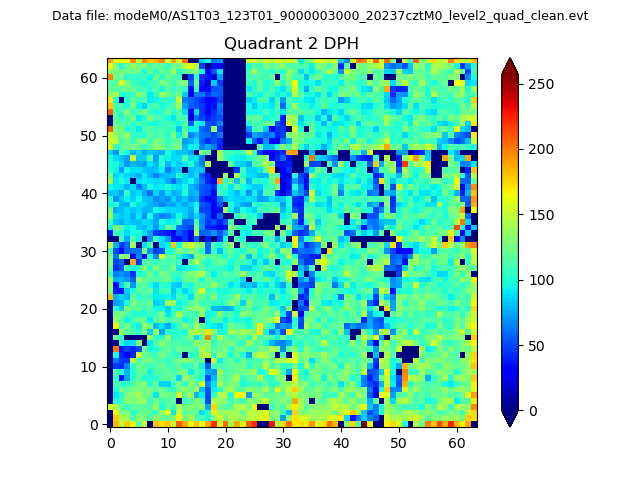
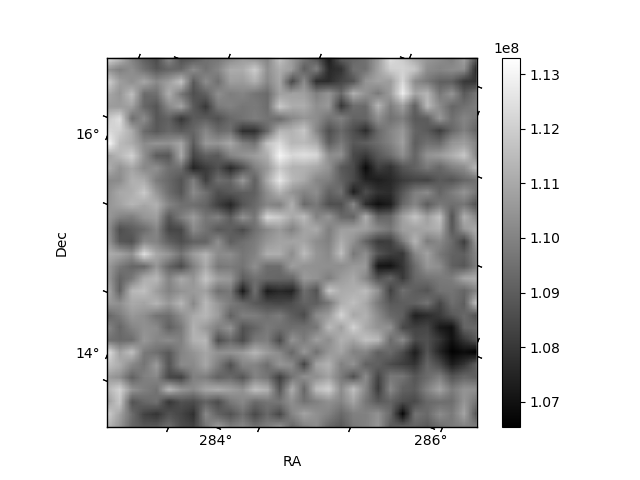
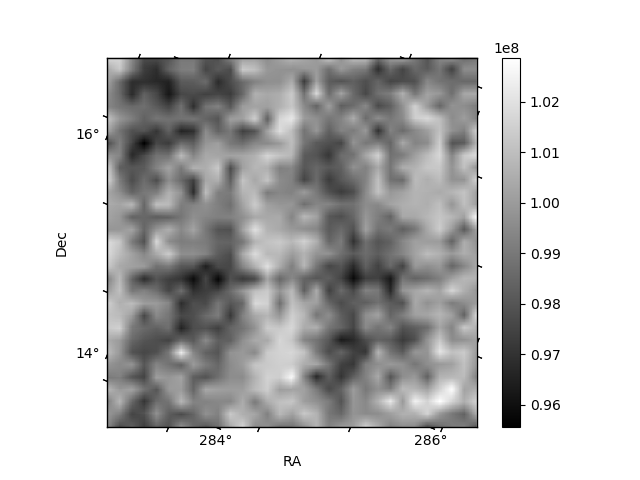
Histogram calculated using DETX and DETY for each event in the final _common_clean file
| Quadrant A | 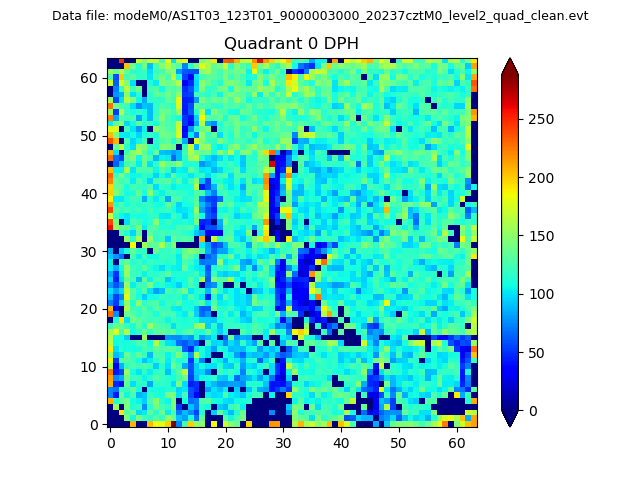 |
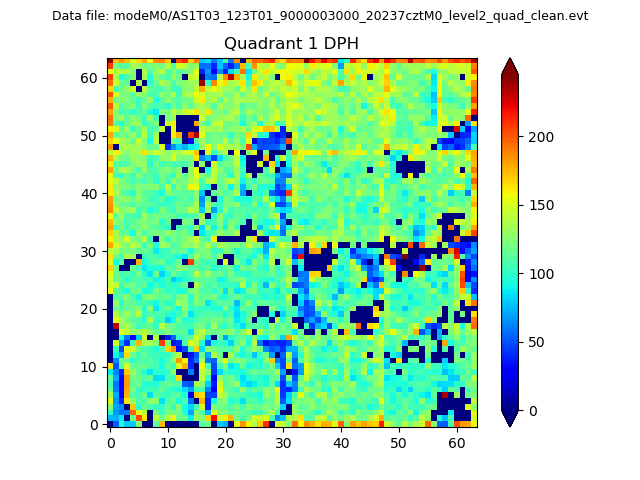 |
Quadrant B |
|---|---|---|---|
| Quadrant D | 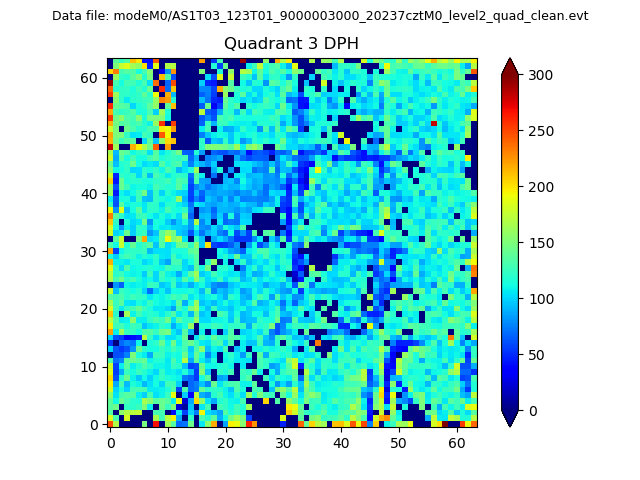 |
 |
Quadrant C |
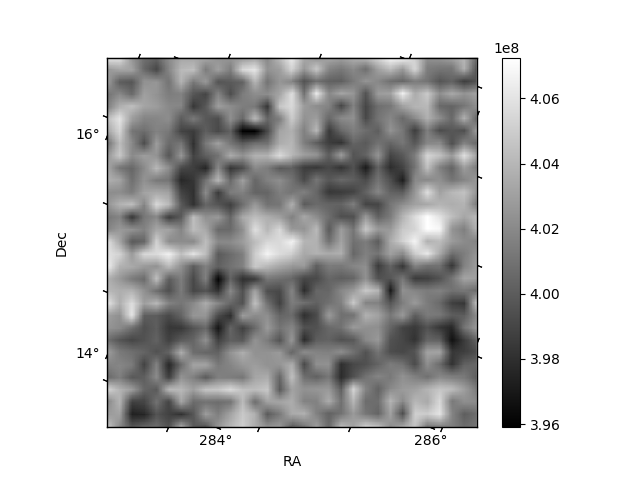
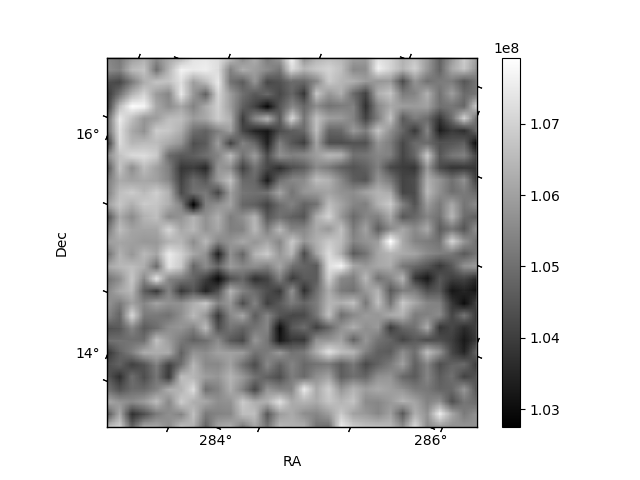
| Plot type | Count rate plots | Images |
|---|---|---|
| Comparison with Poisson distribution Blue bars denote a histogram of data divided into 1 sec bins. Red curve is a Poisson curve with rate = median count rate of data. |
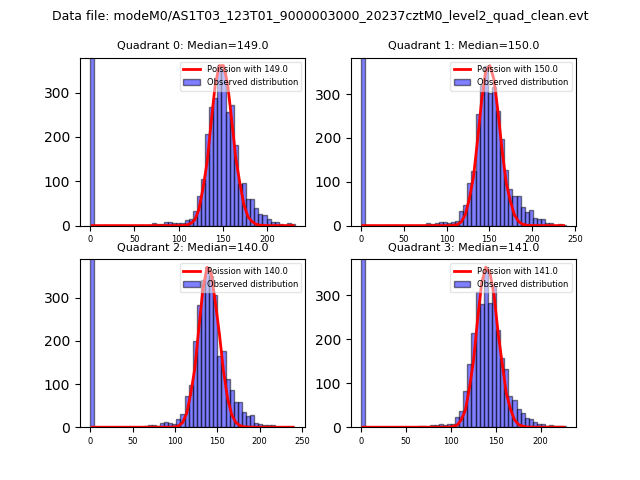 |
 |
| Quadrant-wise count rates Data is divided into 100 sec bins |
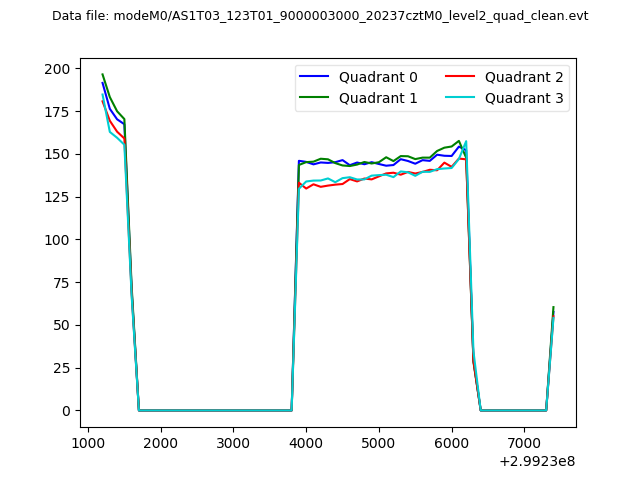 |
|
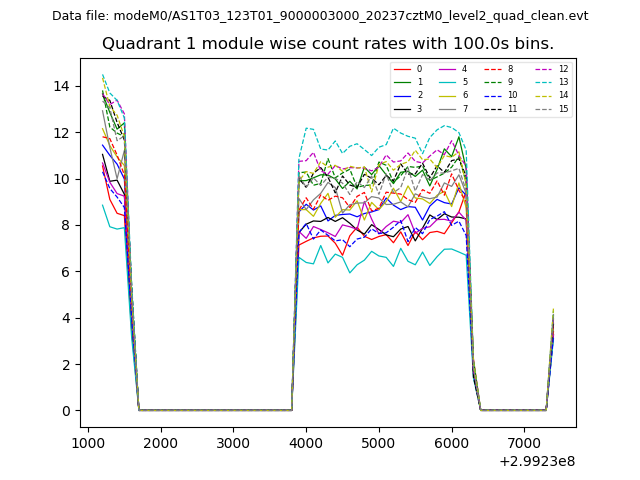
| Module-wise count rates for Quadrant A Data is divided into 100 sec bins |
 |
 |
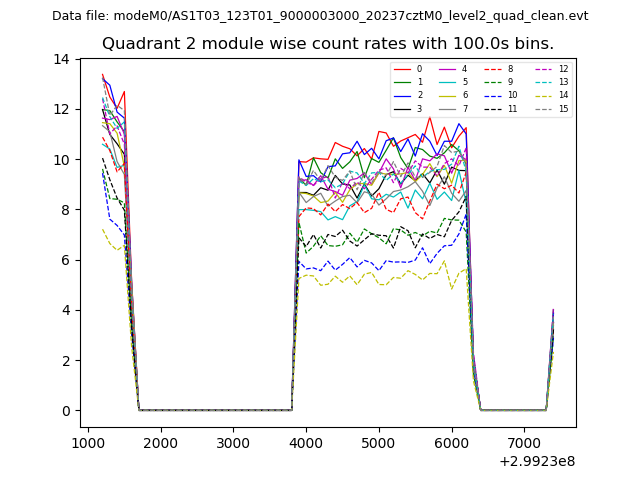
| Module-wise count rates for Quadrant B Data is divided into 100 sec bins |
 |
 |
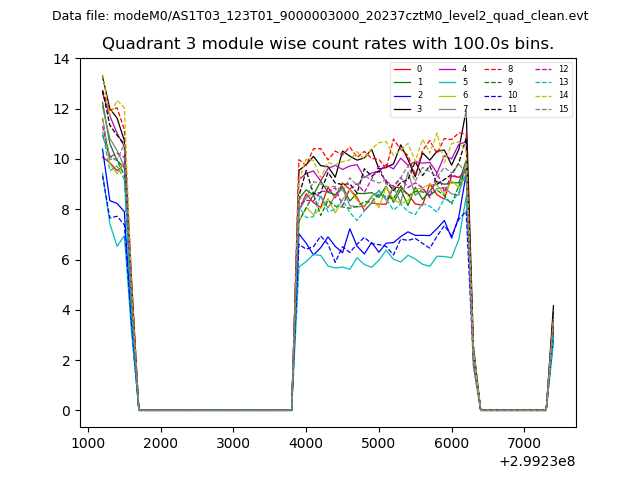
| Module-wise count rates for Quadrant C Data is divided into 100 sec bins |
 |
 |
| Module-wise count rates for Quadrant D Data is divided into 100 sec bins |
 |
 |
| Parameter | Plot |
|---|---|
| CZT HV Monitor | 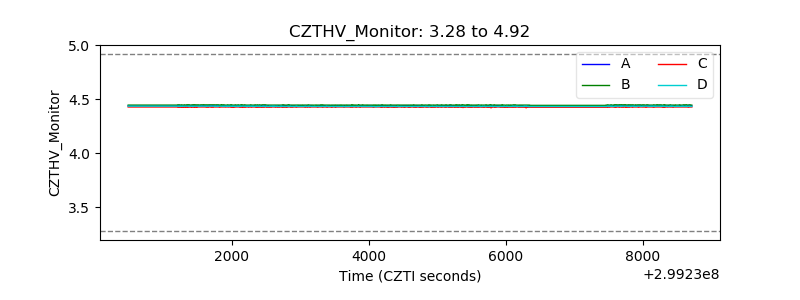 |
| D_VDD | 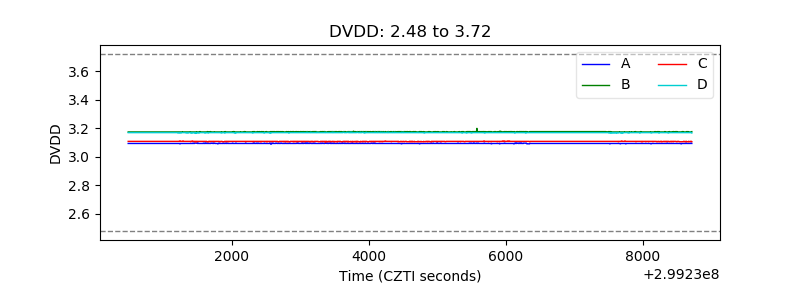 |
| Temperature 1 | 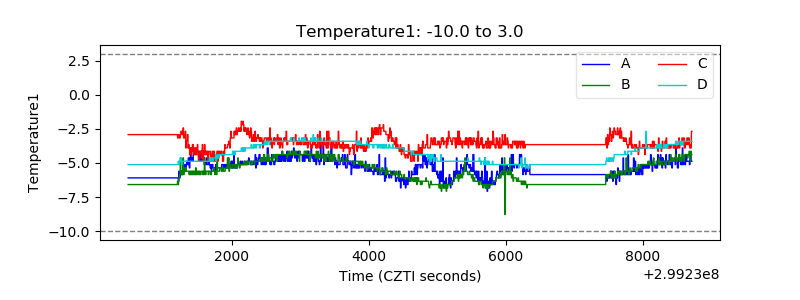 |
| Veto HV Monitor | 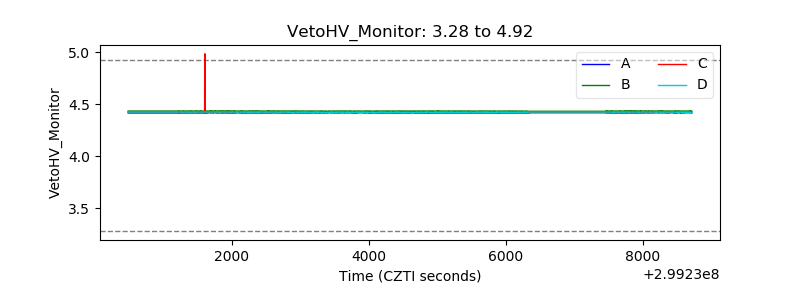 |
| Veto LLD | 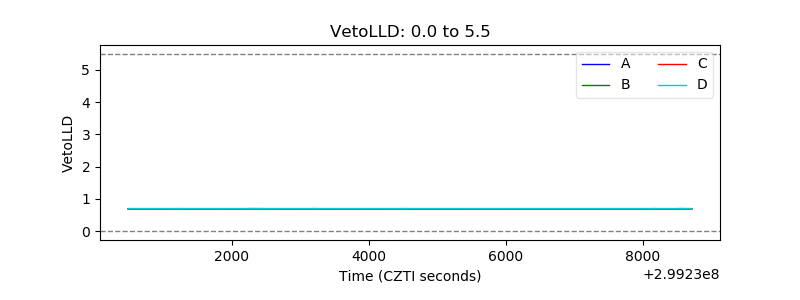 |
| Alpha Counter | 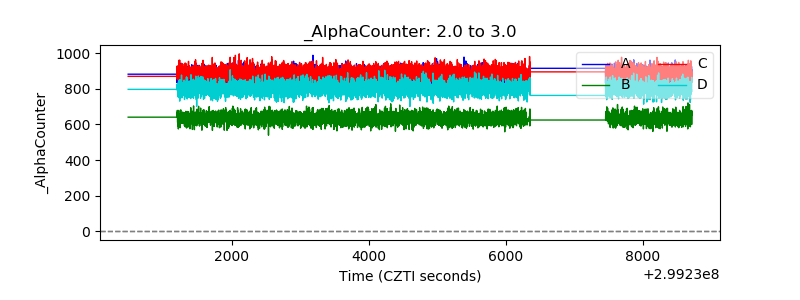 |
| _CPM_Rate | 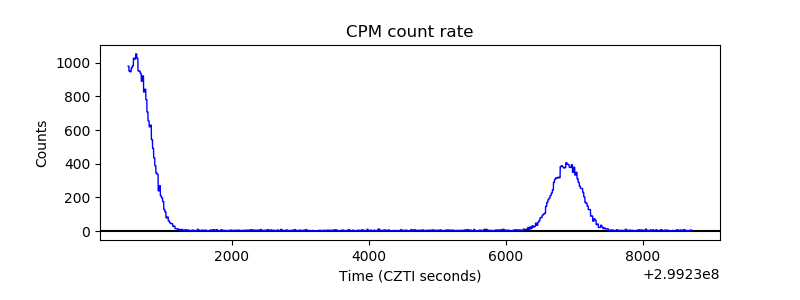 |
| CZT Counter | 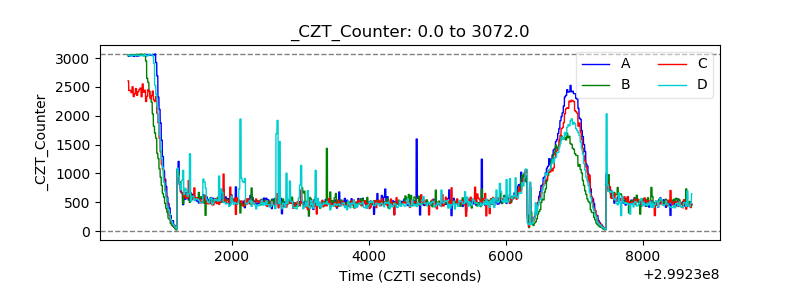 |
| +2.5 Volts monitor |  |
| +5 Volts monitor |  |
| _ROLL_ROT | 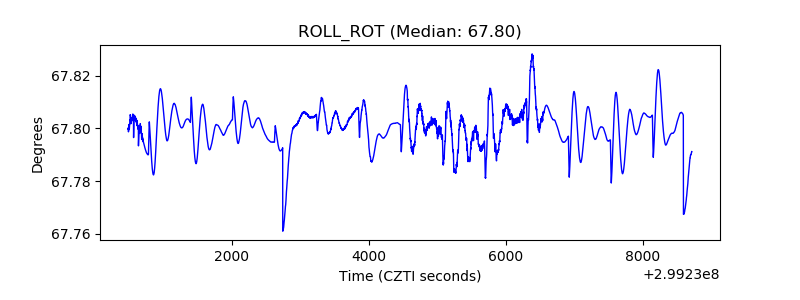 |
| _Roll_DEC |  |
| _Roll_RA | 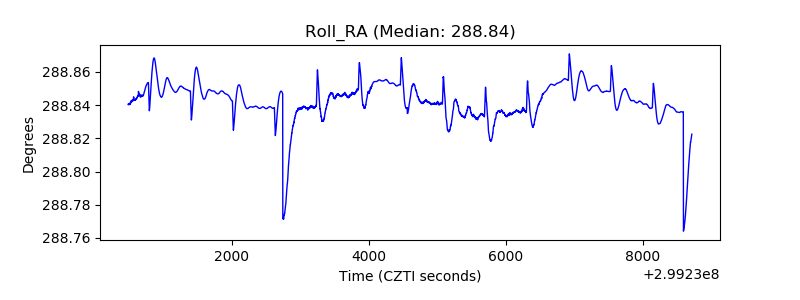 |
| Veto Counter | 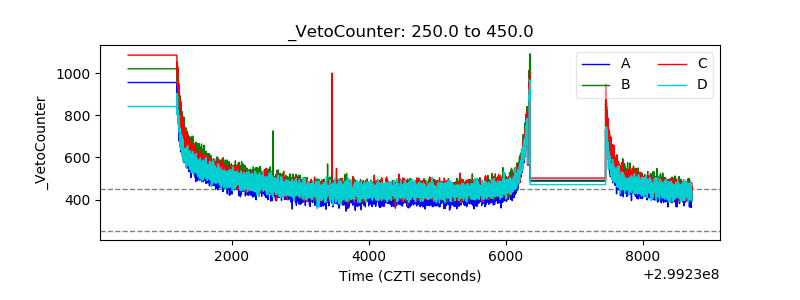 |