| Param | Original file | Final file |
|---|---|---|
| Filename | modeM0/AS1T03_123T01_9000003000_20238cztM0_level2.evt | modeM0/AS1T03_123T01_9000003000_20238cztM0_level2_quad_clean.evt |
| Size (bytes) | 543,836,160 | 81,429,120 |
| Size | 518.6 MB | 77.7 MB |
| Events in quadrant A | 3,706,732 | 503,018 |
| Events in quadrant B | 3,842,446 | 506,308 |
| Events in quadrant C | 3,708,220 | 476,839 |
| Events in quadrant D | 4,720,270 | 474,003 |
| Mode M9 | |||
|---|---|---|---|
| Quadrant | BADHDUFLAG | Total packets | Discarded packets |
| A | 0 | 19 | 0 |
| B | 0 | 19 | 0 |
| C | 0 | 19 | 0 |
| D | 0 | 19 | 0 |
| Mode SS | |||
|---|---|---|---|
| Quadrant | BADHDUFLAG | Total packets | Discarded packets |
| A | 0 | 150 | 0 |
| B | 0 | 150 | 0 |
| C | 0 | 150 | 0 |
| D | 0 | 150 | 0 |
| Mode M0 | |||
|---|---|---|---|
| Quadrant | BADHDUFLAG | Total packets | Discarded packets |
| A | 0 | 15329 | 2 |
| B | 0 | 15629 | 2 |
| C | 0 | 15318 | 2 |
| D | 0 | 18664 | 2 |
| Quadrant | Total seconds | Saturated seconds | Saturation percentage |
|---|---|---|---|
| A | 7253 | 182 | 2.509306% |
| B | 7254 | 210 | 2.894955% |
| C | 7254 | 209 | 2.881169% |
| D | 7254 | 246 | 3.391232% |
Noise dominated data is calculated using 1-second bins in cleaned event files. If a bin has >2000 counts, and if more than 50% of those come from <1% of pixels, then it is considered to be noise-dominated and hence unusable.
| Quadrant | # 1 sec bins | Bins with >0 counts | Bins with >2000 counts | High rate bins dominated by noise | Noise dominated (total time) | Noise dominated (detector-on time) | Marked lightcurve |
|---|---|---|---|---|---|---|---|
| A | 9208 | 7256 | 2 | 2 | 0.02% | 0.03% | 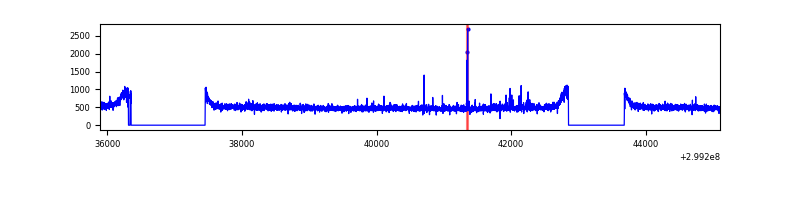 |
| B | 9209 | 7257 | 1 | 1 | 0.01% | 0.01% | 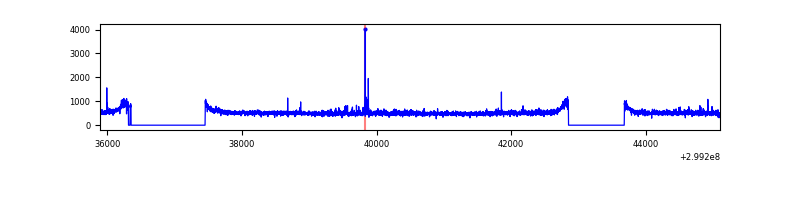 |
| C | 9209 | 7257 | 1 | 1 | 0.01% | 0.01% | 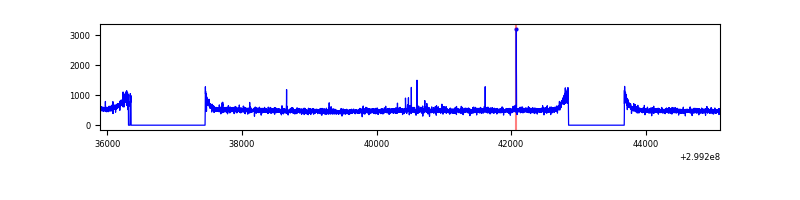 |
| D | 9209 | 7257 | 105 | 105 | 1.14% | 1.45% | 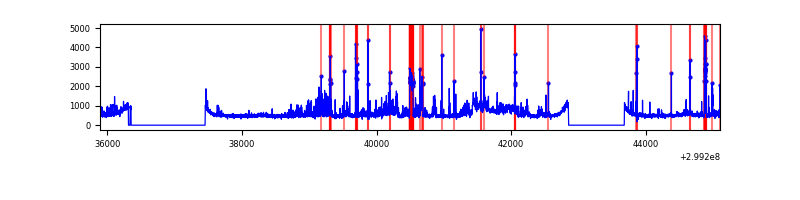 |
Top three noisy pixels from each quadrant. If the there are fewer than three noisy pixels in the level2.evt file, extra rows are filled as -1
| Pixel properties | Quadrant properties | ||||||
|---|---|---|---|---|---|---|---|
| Quadrant | DetID | PixID | Counts | Sigma | Mean | Median | Sigma |
| A | 4 | 2 | 21028 | 104.51 | 953 | 931 | 192.3 |
| A | 3 | 1 | 15419 | 75.34 | 953 | 931 | 192.3 |
| A | 0 | 226 | 8094 | 37.25 | 953 | 931 | 192.3 |
| B | 10 | 245 | 66823 | 361.46 | 942 | 920 | 182.3 |
| B | 0 | 214 | 55521 | 299.47 | 942 | 920 | 182.3 |
| B | 12 | 111 | 23000 | 121.1 | 942 | 920 | 182.3 |
| C | 14 | 238 | 139990 | 658.38 | 899 | 906 | 211.3 |
| C | 3 | 233 | 49397 | 229.54 | 899 | 906 | 211.3 |
| C | 9 | 54 | 12313 | 54.0 | 899 | 906 | 211.3 |
| D | 7 | 238 | 488676 | 2176.85 | 920 | 895 | 224.1 |
| D | 5 | 222 | 311936 | 1388.1 | 920 | 895 | 224.1 |
| D | 1 | 52 | 254874 | 1133.45 | 920 | 895 | 224.1 |
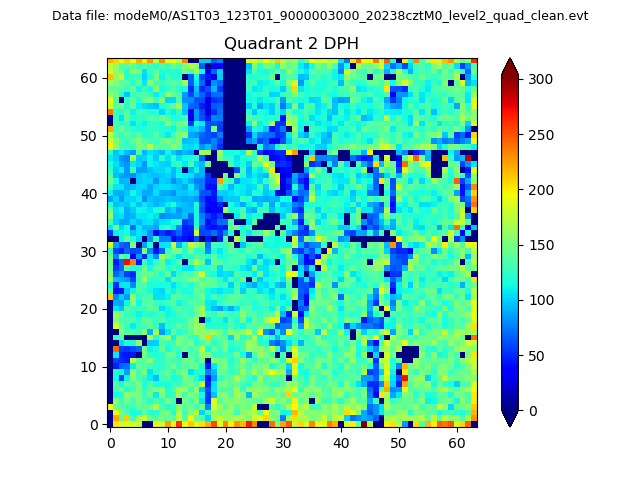
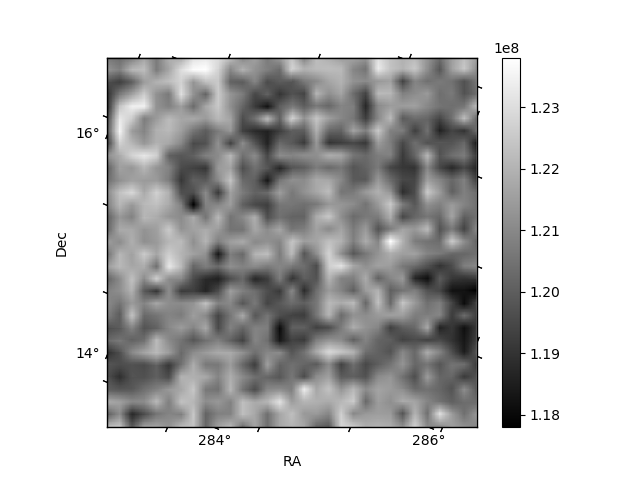
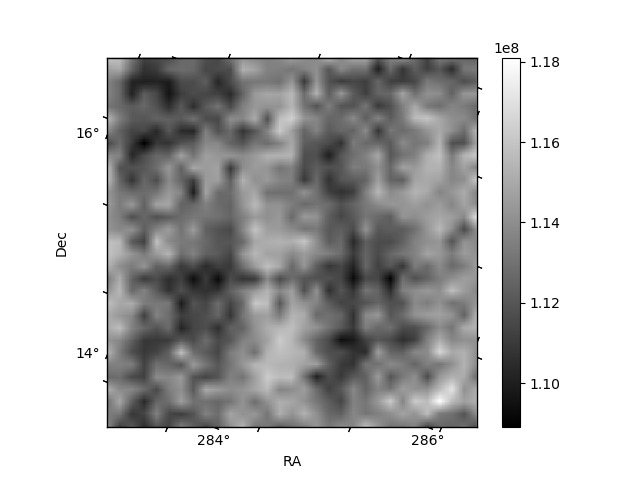
Histogram calculated using DETX and DETY for each event in the final _common_clean file
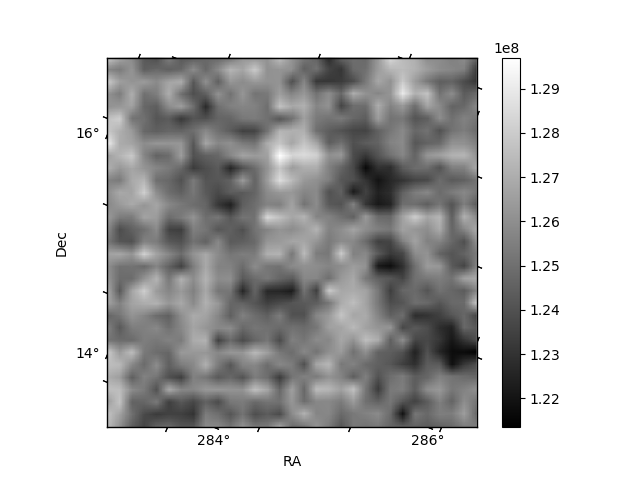
| Quadrant A | 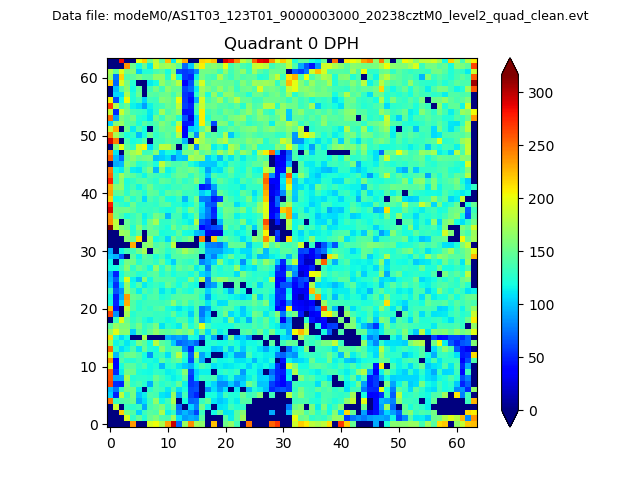 |
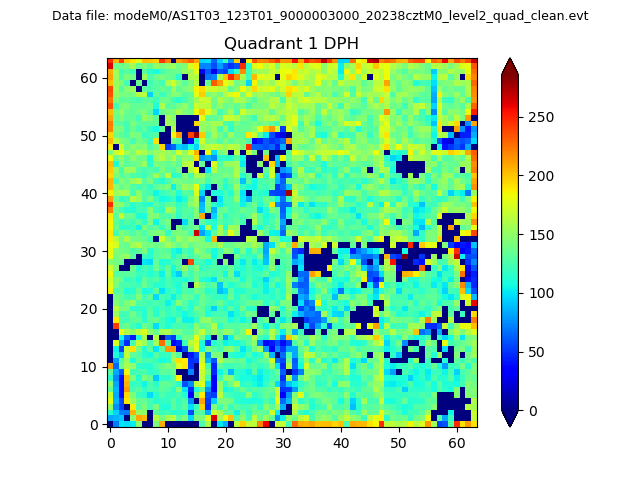 |
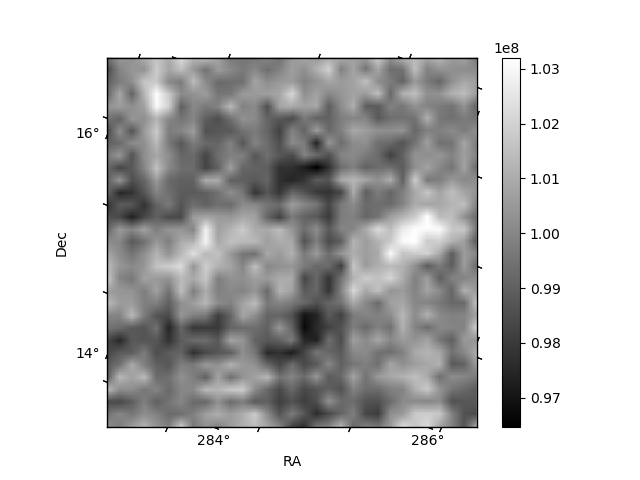
Quadrant B |
|---|---|---|---|
| Quadrant D | 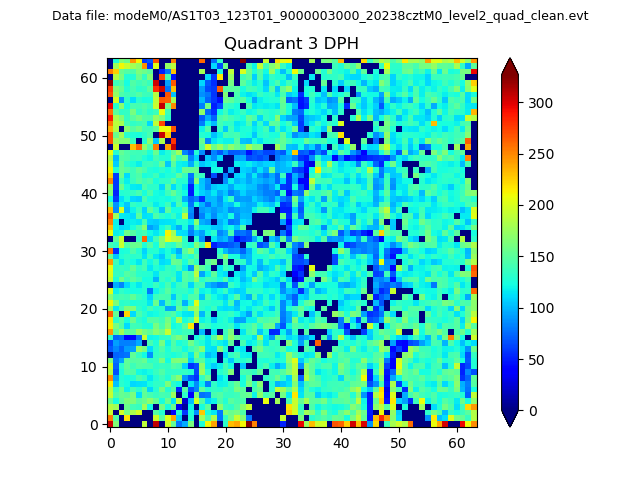 |
 |
Quadrant C |
| Plot type | Count rate plots | Images |
|---|---|---|
| Comparison with Poisson distribution Blue bars denote a histogram of data divided into 1 sec bins. Red curve is a Poisson curve with rate = median count rate of data. |
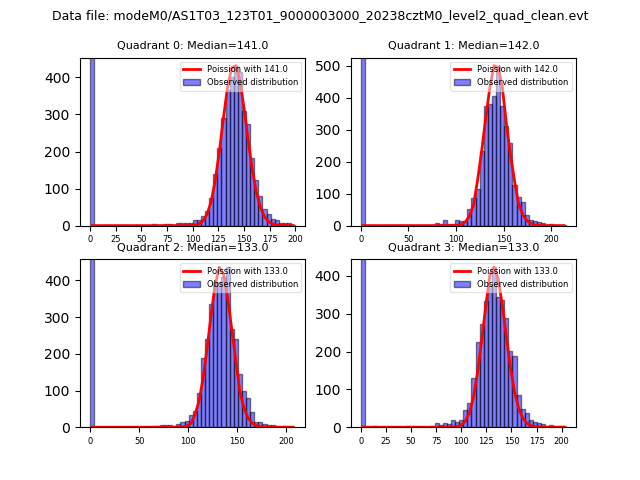 |
 |
| Quadrant-wise count rates Data is divided into 100 sec bins |
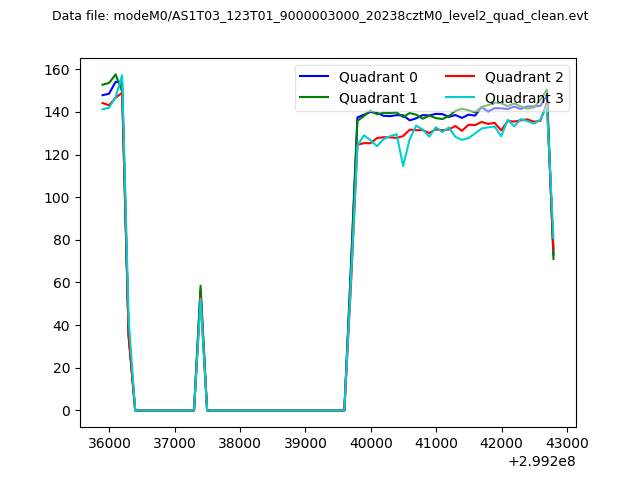 |
|
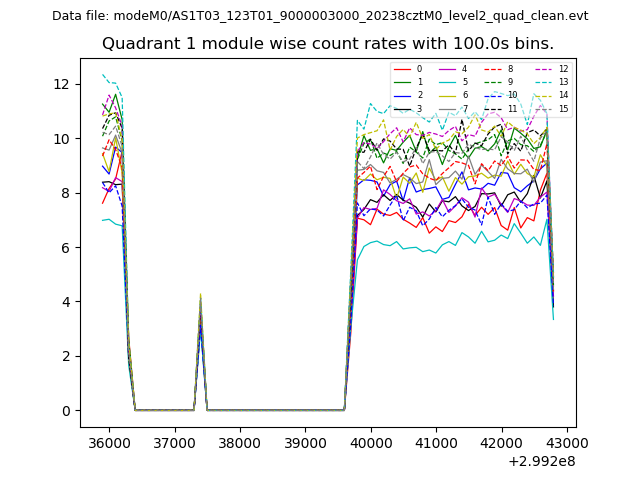
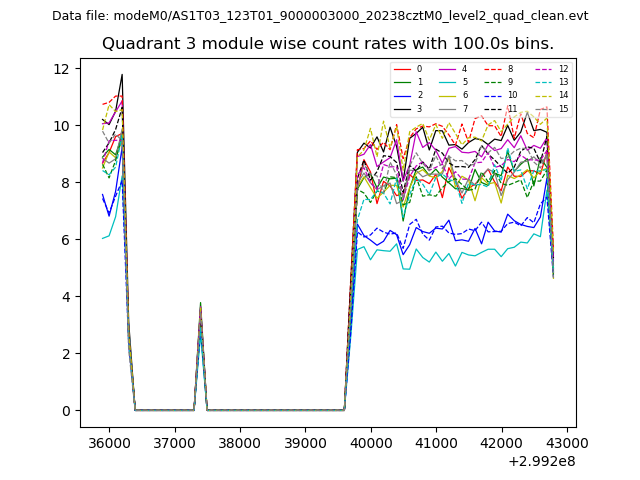
| Module-wise count rates for Quadrant A Data is divided into 100 sec bins |
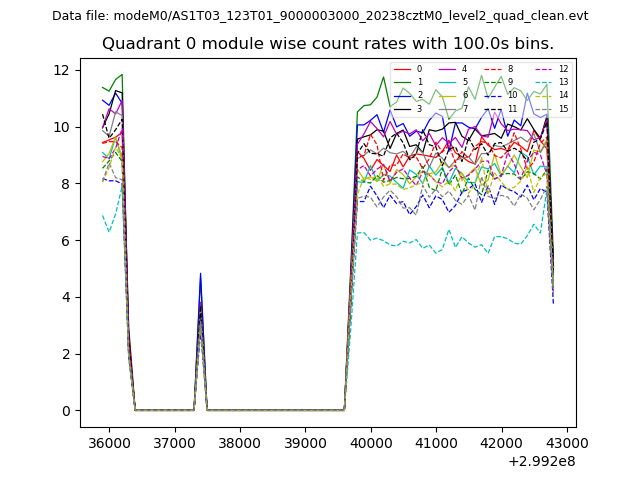 |
 |
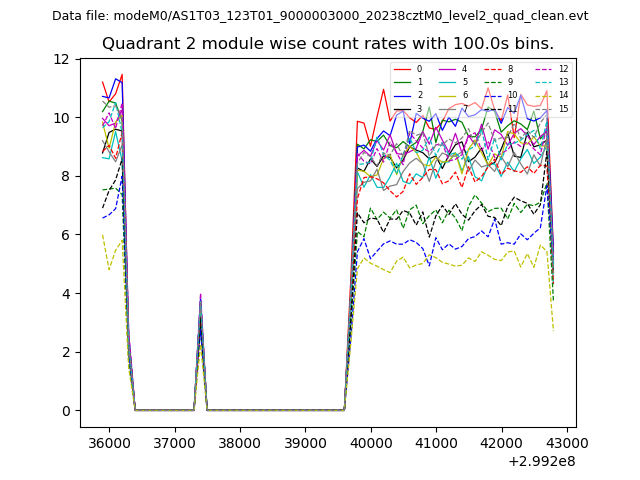
| Module-wise count rates for Quadrant B Data is divided into 100 sec bins |
 |
 |
| Module-wise count rates for Quadrant C Data is divided into 100 sec bins |
 |
 |
| Module-wise count rates for Quadrant D Data is divided into 100 sec bins |
 |
 |
| Parameter | Plot |
|---|---|
| CZT HV Monitor | 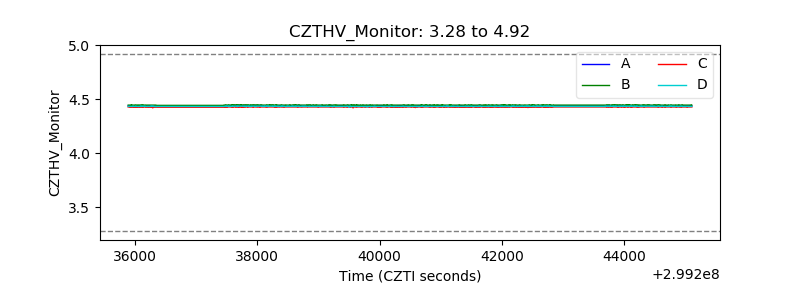 |
| D_VDD | 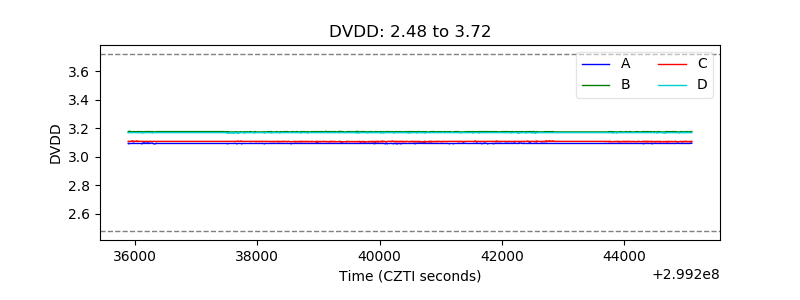 |
| Temperature 1 |  |
| Veto HV Monitor | 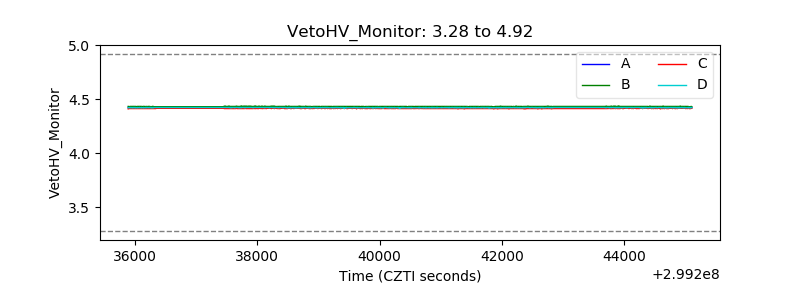 |
| Veto LLD | 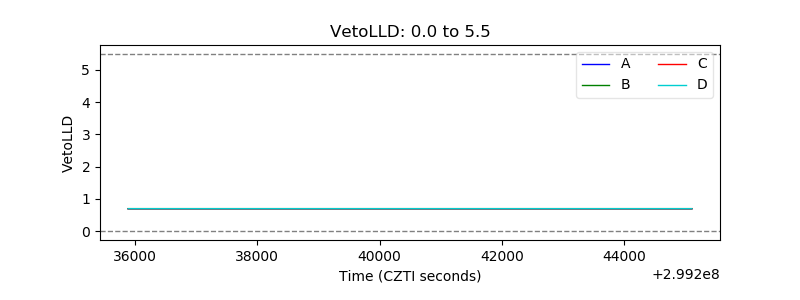 |
| Alpha Counter | 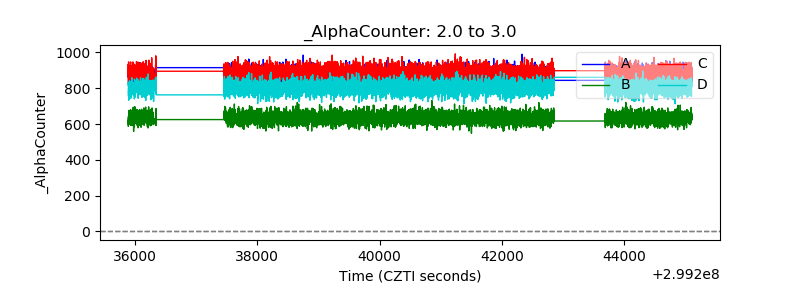 |
| _CPM_Rate | 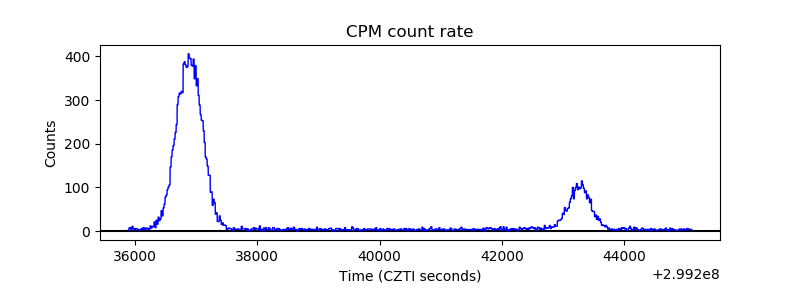 |
| CZT Counter |  |
| +2.5 Volts monitor |  |
| +5 Volts monitor | 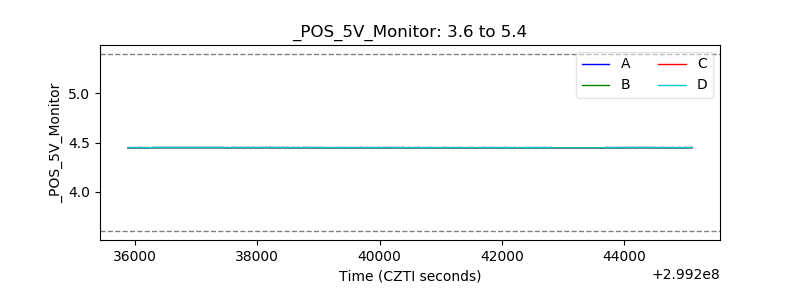 |
| _ROLL_ROT | 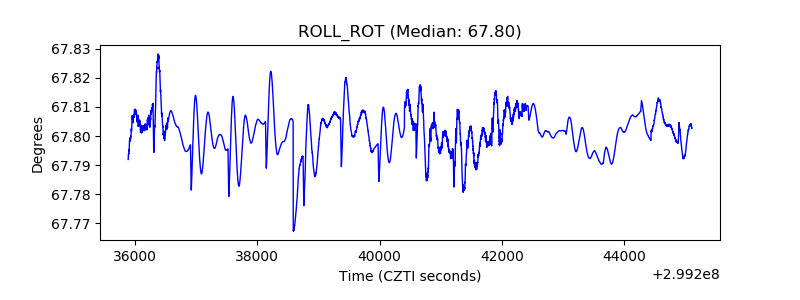 |
| _Roll_DEC | 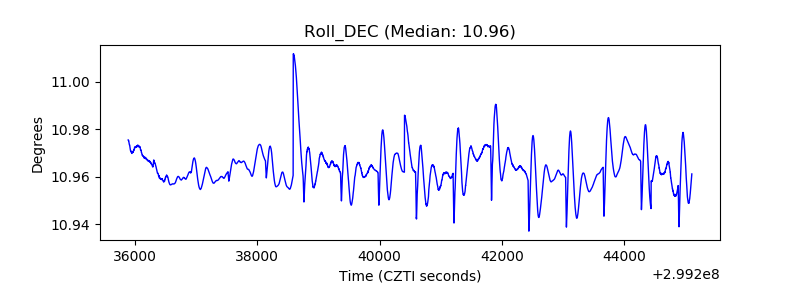 |
| _Roll_RA |  |
| Veto Counter | 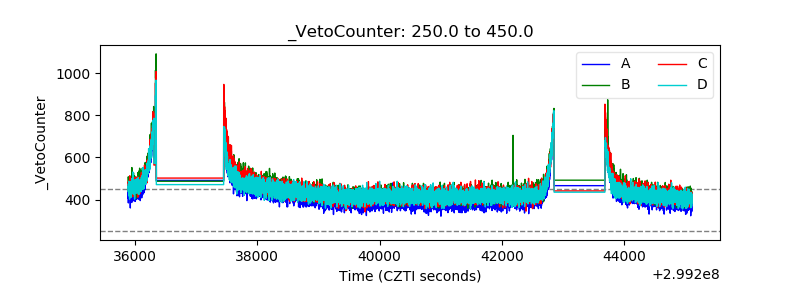 |