| Param | Original file | Final file |
|---|---|---|
| Filename | modeM0/AS1T03_123T01_9000003000_20239cztM0_level2.evt | modeM0/AS1T03_123T01_9000003000_20239cztM0_level2_quad_clean.evt |
| Size (bytes) | 521,377,920 | 78,471,360 |
| Size | 497.2 MB | 74.8 MB |
| Events in quadrant A | 3,642,851 | 478,264 |
| Events in quadrant B | 3,885,945 | 481,784 |
| Events in quadrant C | 3,555,167 | 455,716 |
| Events in quadrant D | 4,213,412 | 455,327 |
| Mode M9 | |||
|---|---|---|---|
| Quadrant | BADHDUFLAG | Total packets | Discarded packets |
| A | 0 | 9 | 0 |
| B | 0 | 10 | 0 |
| C | 0 | 10 | 0 |
| D | 0 | 10 | 0 |
| Mode SS | |||
|---|---|---|---|
| Quadrant | BADHDUFLAG | Total packets | Discarded packets |
| A | 0 | 148 | 0 |
| B | 0 | 148 | 0 |
| C | 0 | 148 | 0 |
| D | 0 | 148 | 0 |
| Mode M0 | |||
|---|---|---|---|
| Quadrant | BADHDUFLAG | Total packets | Discarded packets |
| A | 0 | 15290 | 2 |
| B | 0 | 16022 | 2 |
| C | 0 | 15004 | 2 |
| D | 0 | 17276 | 2 |
| Quadrant | Total seconds | Saturated seconds | Saturation percentage |
|---|---|---|---|
| A | 7249 | 158 | 2.179611% |
| B | 7249 | 170 | 2.345151% |
| C | 7249 | 155 | 2.138226% |
| D | 7249 | 146 | 2.014071% |
Noise dominated data is calculated using 1-second bins in cleaned event files. If a bin has >2000 counts, and if more than 50% of those come from <1% of pixels, then it is considered to be noise-dominated and hence unusable.
| Quadrant | # 1 sec bins | Bins with >0 counts | Bins with >2000 counts | High rate bins dominated by noise | Noise dominated (total time) | Noise dominated (detector-on time) | Marked lightcurve |
|---|---|---|---|---|---|---|---|
| A | 7729 | 7250 | 24 | 24 | 0.31% | 0.33% | 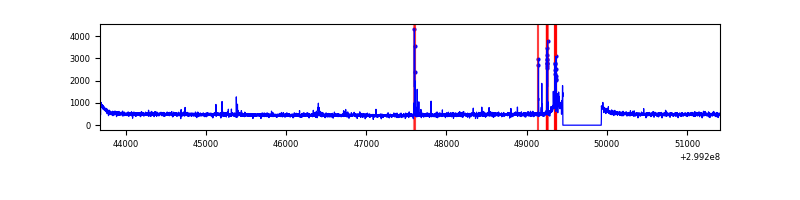 |
| B | 7729 | 7250 | 6 | 6 | 0.08% | 0.08% | 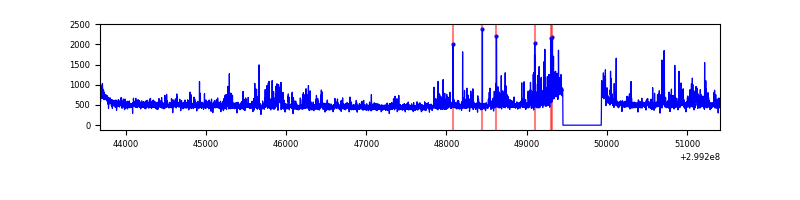 |
| C | 7729 | 7250 | 3 | 3 | 0.04% | 0.04% | 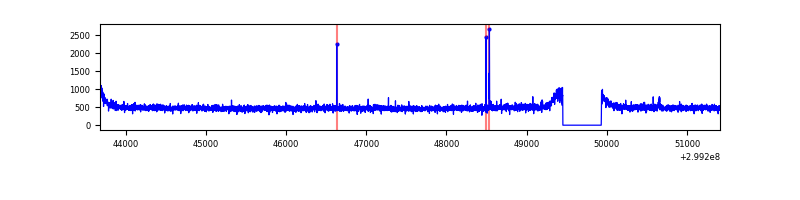 |
| D | 7729 | 7250 | 52 | 52 | 0.67% | 0.72% | 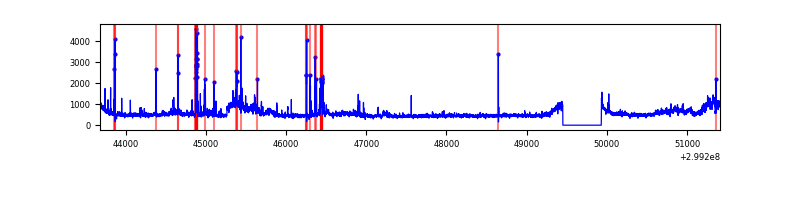 |
Top three noisy pixels from each quadrant. If the there are fewer than three noisy pixels in the level2.evt file, extra rows are filled as -1
| Pixel properties | Quadrant properties | ||||||
|---|---|---|---|---|---|---|---|
| Quadrant | DetID | PixID | Counts | Sigma | Mean | Median | Sigma |
| A | 4 | 2 | 120856 | 655.36 | 909 | 890 | 183.1 |
| A | 3 | 1 | 12127 | 61.39 | 909 | 890 | 183.1 |
| A | 8 | 205 | 8140 | 39.61 | 909 | 890 | 183.1 |
| B | 10 | 245 | 335405 | 1909.96 | 902 | 878 | 175.1 |
| B | 12 | 111 | 21977 | 120.46 | 902 | 878 | 175.1 |
| B | 11 | 111 | 19557 | 106.65 | 902 | 878 | 175.1 |
| C | 14 | 238 | 133014 | 646.74 | 863 | 869 | 204.3 |
| C | 3 | 233 | 40196 | 192.47 | 863 | 869 | 204.3 |
| C | 9 | 54 | 16505 | 76.53 | 863 | 869 | 204.3 |
| D | 7 | 238 | 505373 | 2337.68 | 883 | 857 | 215.8 |
| D | 1 | 52 | 316353 | 1461.86 | 883 | 857 | 215.8 |
| D | 2 | 234 | 34583 | 156.27 | 883 | 857 | 215.8 |
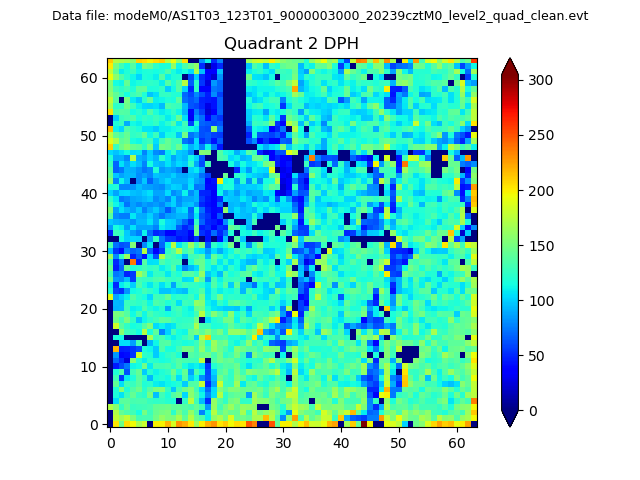
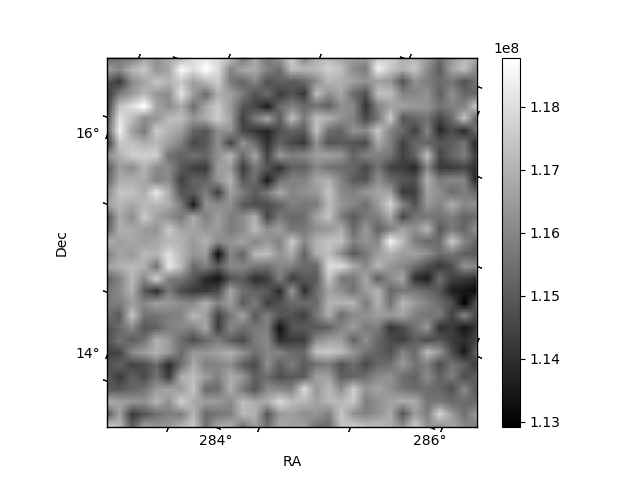
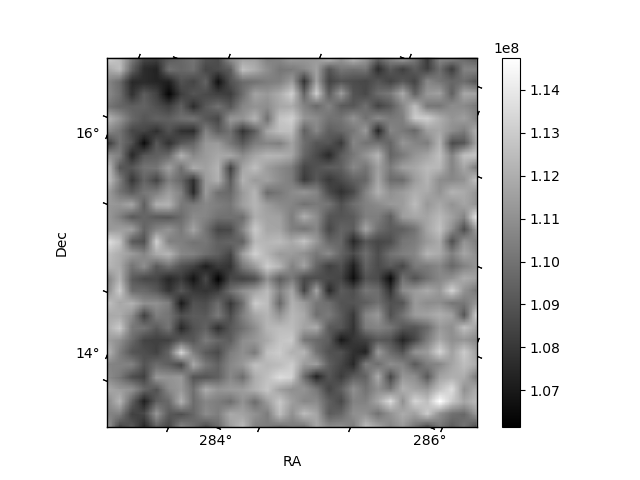
Histogram calculated using DETX and DETY for each event in the final _common_clean file
| Quadrant A | 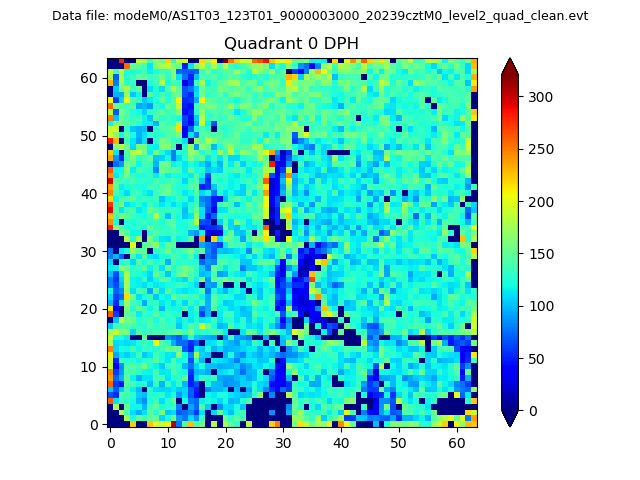 |
 |
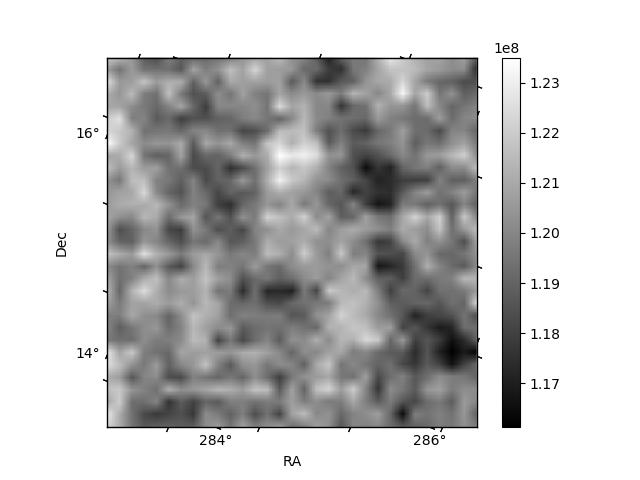
Quadrant B |
|---|---|---|---|
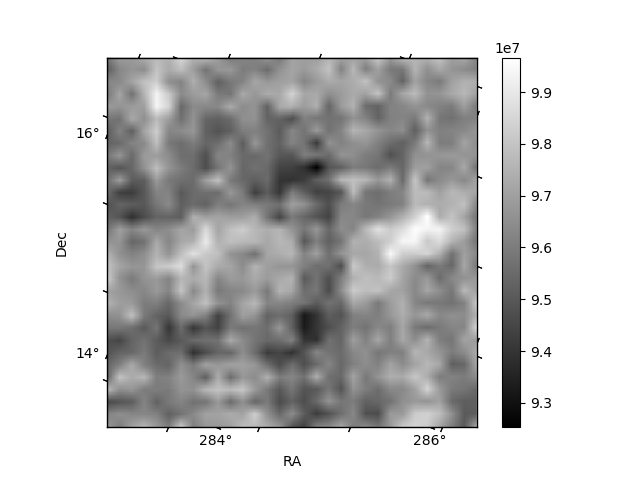
| Quadrant D |  |
 |
Quadrant C |
| Plot type | Count rate plots | Images |
|---|---|---|
| Comparison with Poisson distribution Blue bars denote a histogram of data divided into 1 sec bins. Red curve is a Poisson curve with rate = median count rate of data. |
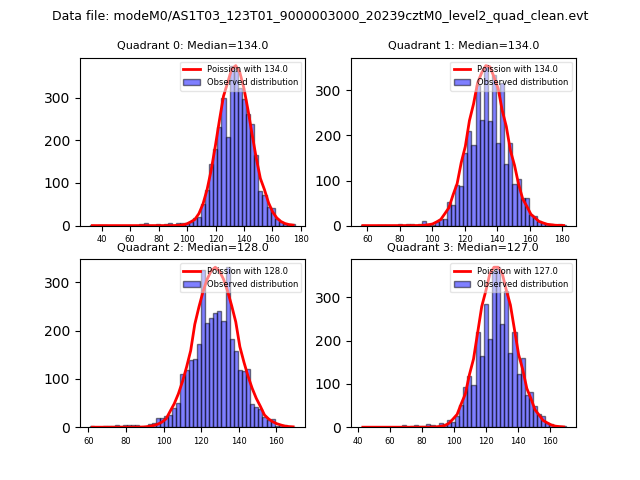 |
 |
| Quadrant-wise count rates Data is divided into 100 sec bins |
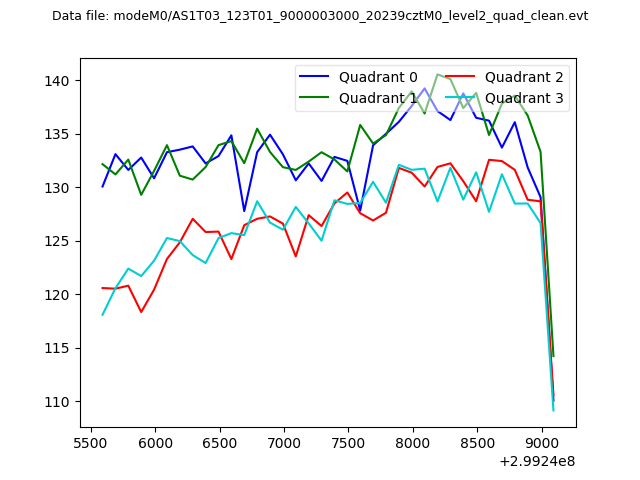 |
|
| Module-wise count rates for Quadrant A Data is divided into 100 sec bins |
 |
 |
| Module-wise count rates for Quadrant B Data is divided into 100 sec bins |
 |
 |
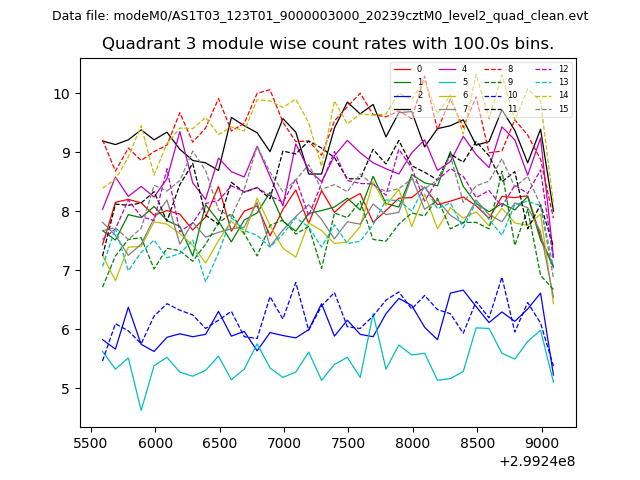
| Module-wise count rates for Quadrant C Data is divided into 100 sec bins |
 |
 |
| Module-wise count rates for Quadrant D Data is divided into 100 sec bins |
 |
 |
| Parameter | Plot |
|---|---|
| CZT HV Monitor | 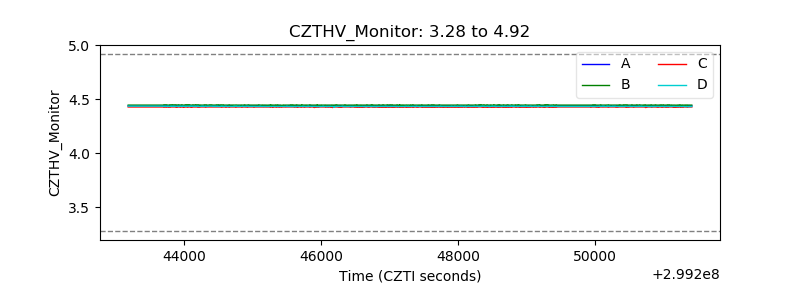 |
| D_VDD | 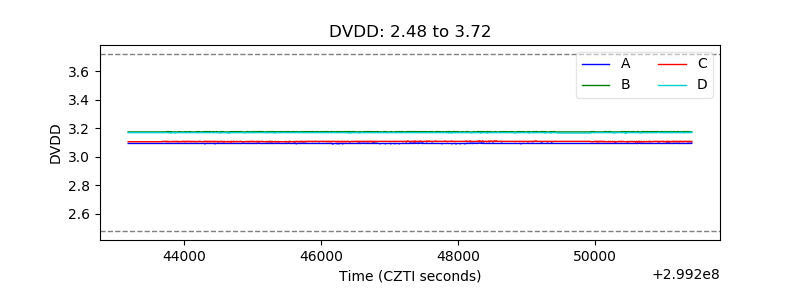 |
| Temperature 1 | 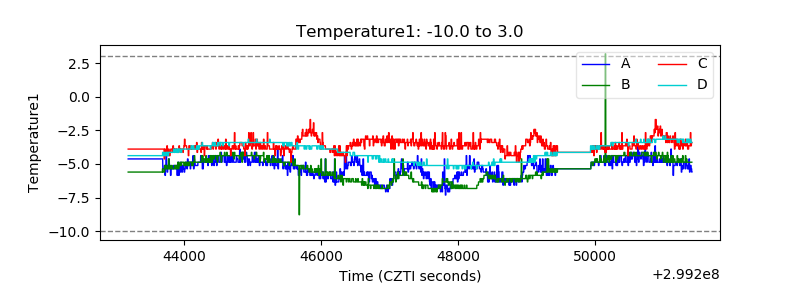 |
| Veto HV Monitor | 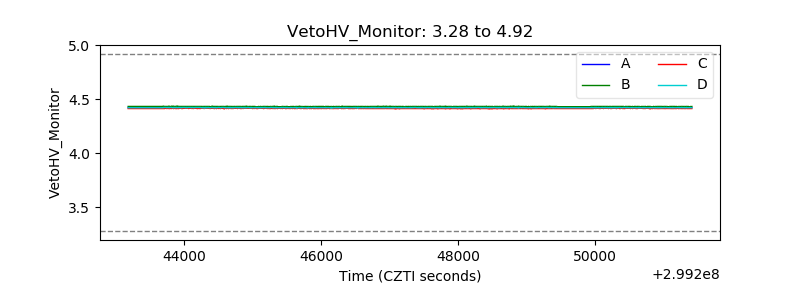 |
| Veto LLD | 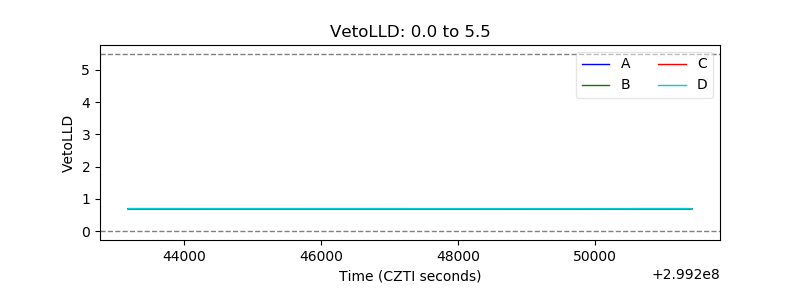 |
| Alpha Counter | 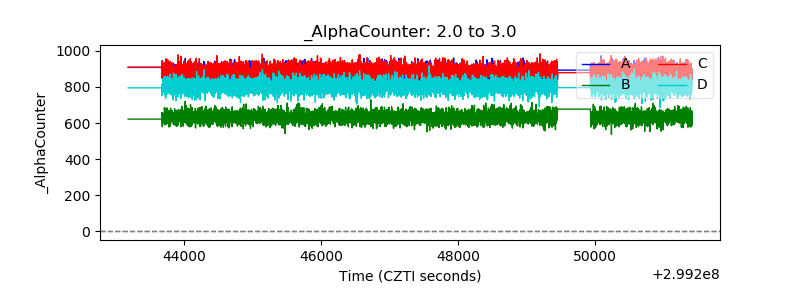 |
| _CPM_Rate | 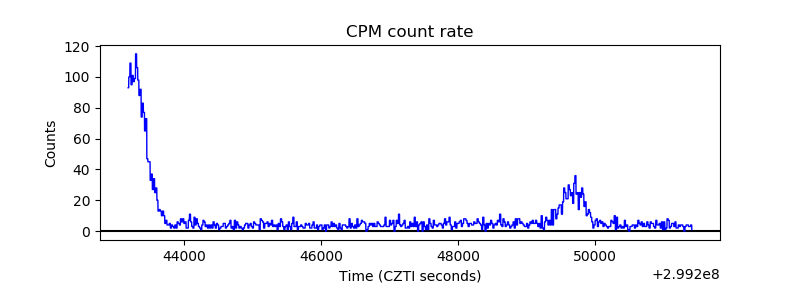 |
| CZT Counter | 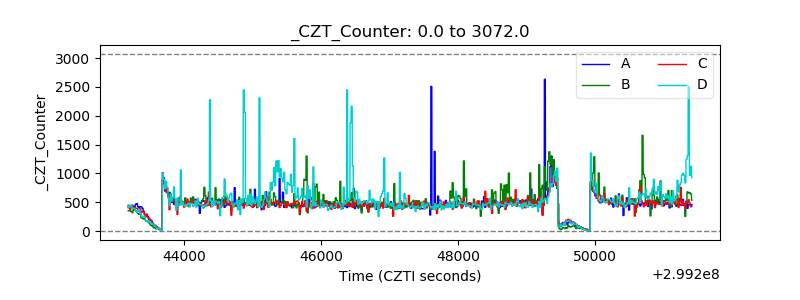 |
| +2.5 Volts monitor |  |
| +5 Volts monitor |  |
| _ROLL_ROT | 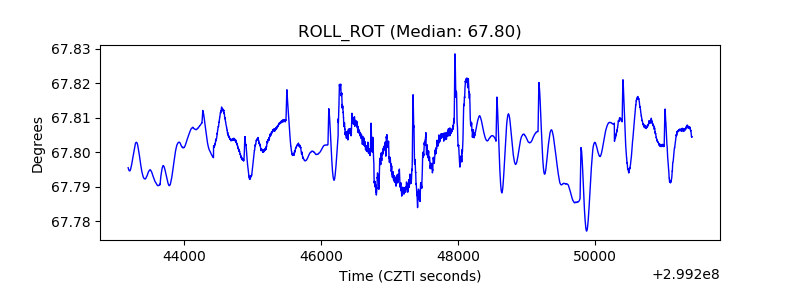 |
| _Roll_DEC | 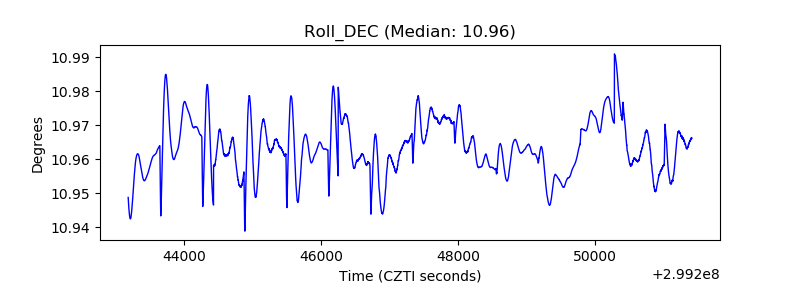 |
| _Roll_RA | 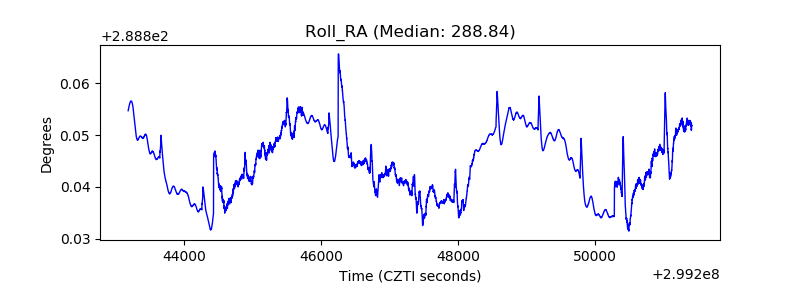 |
| Veto Counter | 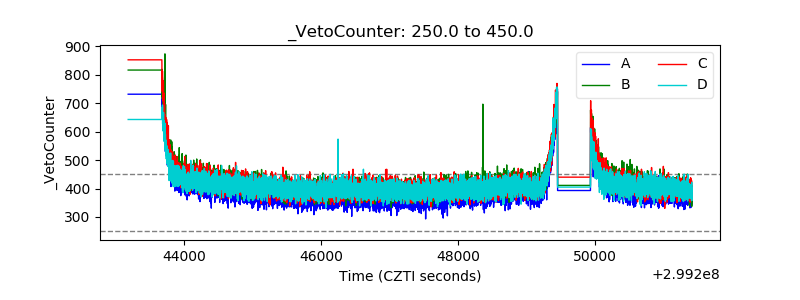 |