| Param | Original file | Final file |
|---|---|---|
| Filename | modeM0/AS1T03_123T01_9000003000_20240cztM0_level2.evt | modeM0/AS1T03_123T01_9000003000_20240cztM0_level2_quad_clean.evt |
| Size (bytes) | 596,629,440 | 86,725,440 |
| Size | 569.0 MB | 82.7 MB |
| Events in quadrant A | 3,911,688 | 533,754 |
| Events in quadrant B | 4,302,234 | 535,906 |
| Events in quadrant C | 3,890,854 | 508,815 |
| Events in quadrant D | 5,431,213 | 501,284 |
| Mode M9 | |||
|---|---|---|---|
| Quadrant | BADHDUFLAG | Total packets | Discarded packets |
| A | 0 | 8 | 0 |
| B | 0 | 8 | 0 |
| C | 0 | 8 | 0 |
| D | 0 | 8 | 0 |
| Mode SS | |||
|---|---|---|---|
| Quadrant | BADHDUFLAG | Total packets | Discarded packets |
| A | 0 | 162 | 0 |
| B | 0 | 162 | 0 |
| C | 0 | 162 | 0 |
| D | 0 | 162 | 0 |
| Mode M0 | |||
|---|---|---|---|
| Quadrant | BADHDUFLAG | Total packets | Discarded packets |
| A | 0 | 16575 | 2 |
| B | 0 | 17626 | 2 |
| C | 0 | 16365 | 2 |
| D | 0 | 21467 | 2 |
| Quadrant | Total seconds | Saturated seconds | Saturation percentage |
|---|---|---|---|
| A | 7857 | 236 | 3.003691% |
| B | 7857 | 307 | 3.907344% |
| C | 7857 | 257 | 3.270969% |
| D | 7856 | 342 | 4.353360% |
Noise dominated data is calculated using 1-second bins in cleaned event files. If a bin has >2000 counts, and if more than 50% of those come from <1% of pixels, then it is considered to be noise-dominated and hence unusable.
| Quadrant | # 1 sec bins | Bins with >0 counts | Bins with >2000 counts | High rate bins dominated by noise | Noise dominated (total time) | Noise dominated (detector-on time) | Marked lightcurve |
|---|---|---|---|---|---|---|---|
| A | 8622 | 7859 | 21 | 21 | 0.24% | 0.27% | 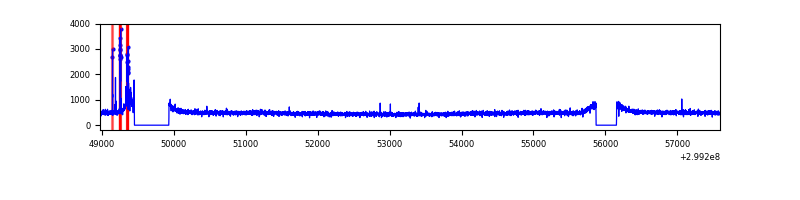 |
| B | 8622 | 7859 | 10 | 10 | 0.12% | 0.13% | 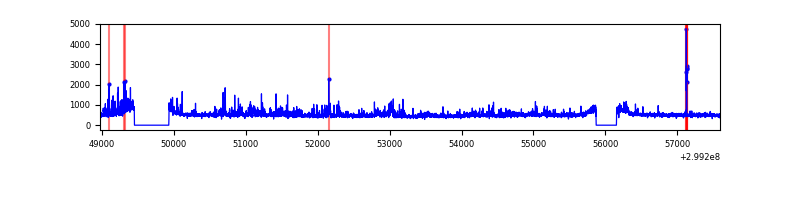 |
| C | 8622 | 7859 | 0 | 0 | 0.00% | 0.00% | 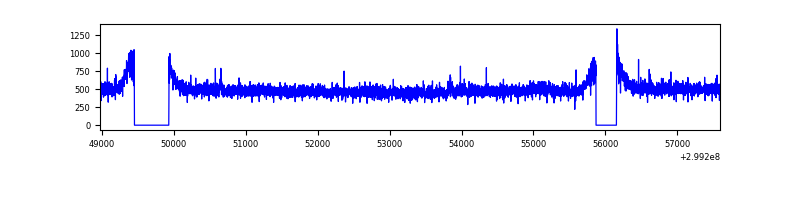 |
| D | 8621 | 7858 | 137 | 137 | 1.59% | 1.74% | 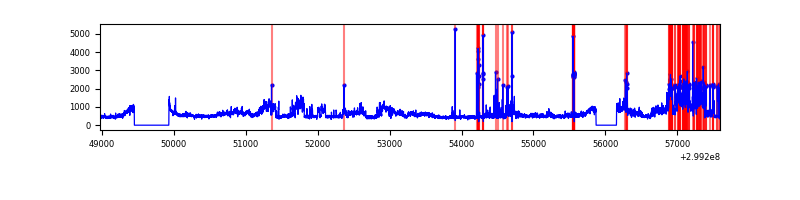 |
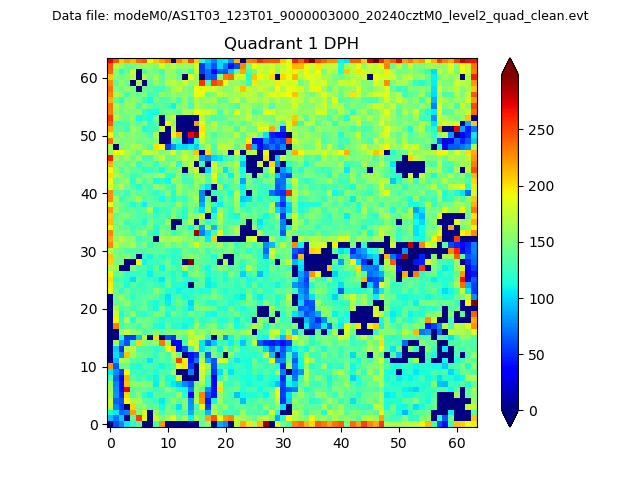
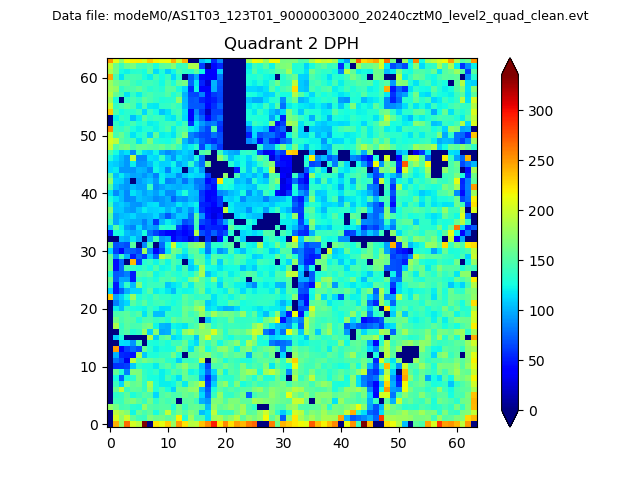
Top three noisy pixels from each quadrant. If the there are fewer than three noisy pixels in the level2.evt file, extra rows are filled as -1
| Pixel properties | Quadrant properties | ||||||
|---|---|---|---|---|---|---|---|
| Quadrant | DetID | PixID | Counts | Sigma | Mean | Median | Sigma |
| A | 4 | 2 | 96541 | 483.74 | 990 | 968 | 197.6 |
| A | 3 | 137 | 8718 | 39.22 | 990 | 968 | 197.6 |
| A | 0 | 226 | 8272 | 36.97 | 990 | 968 | 197.6 |
| B | 10 | 245 | 365126 | 1914.66 | 978 | 952 | 190.2 |
| B | 0 | 85 | 34073 | 174.14 | 978 | 952 | 190.2 |
| B | 12 | 111 | 24217 | 122.32 | 978 | 952 | 190.2 |
| C | 14 | 238 | 145993 | 654.35 | 940 | 943 | 221.7 |
| C | 3 | 233 | 77396 | 344.9 | 940 | 943 | 221.7 |
| C | 13 | 61 | 6384 | 24.55 | 940 | 943 | 221.7 |
| D | 7 | 238 | 1091638 | 4696.28 | 957 | 928 | 232.3 |
| D | 1 | 52 | 695790 | 2991.87 | 957 | 928 | 232.3 |
| D | 2 | 234 | 37533 | 157.61 | 957 | 928 | 232.3 |
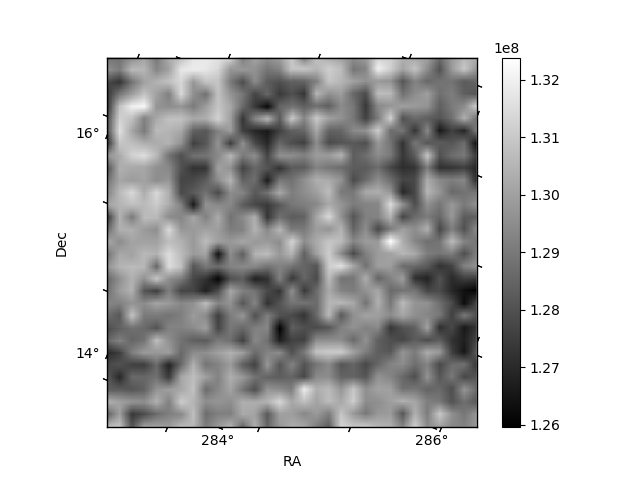
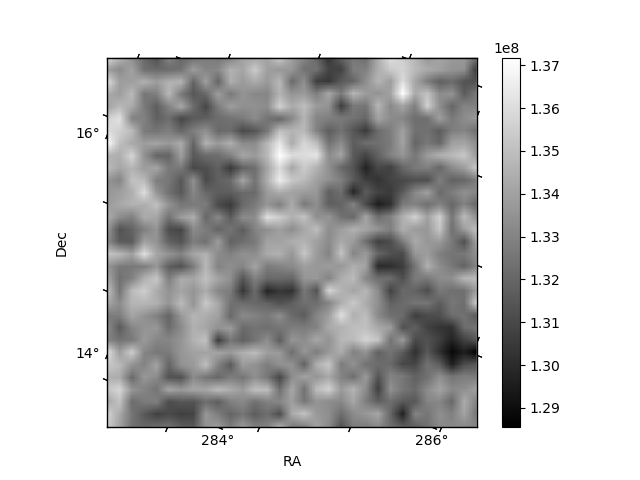
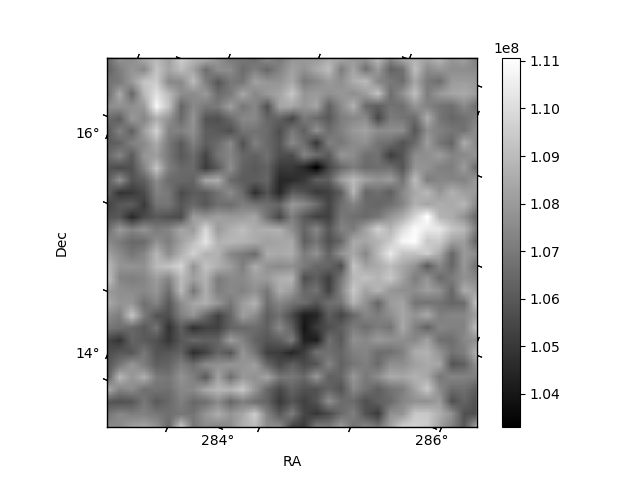
Histogram calculated using DETX and DETY for each event in the final _common_clean file
| Quadrant A | 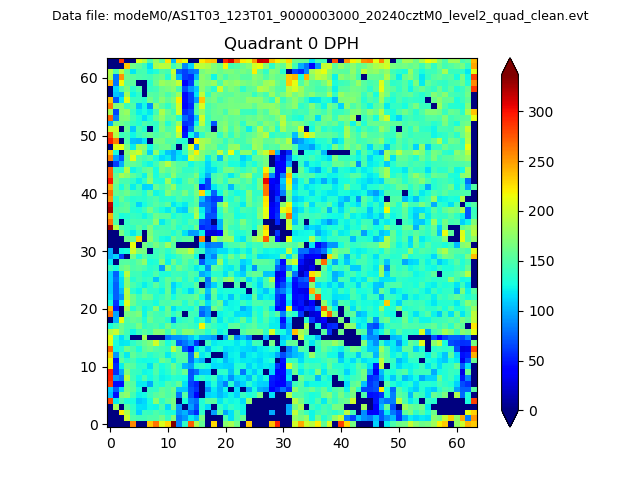 |
 |
Quadrant B |
|---|---|---|---|
| Quadrant D | 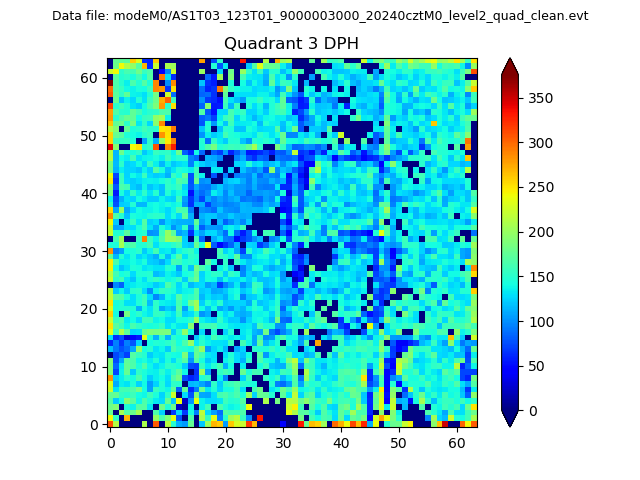 |
 |
Quadrant C |
| Plot type | Count rate plots | Images |
|---|---|---|
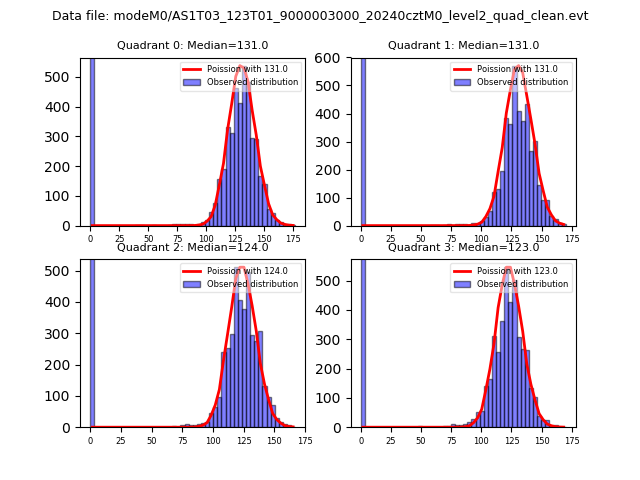
| Comparison with Poisson distribution Blue bars denote a histogram of data divided into 1 sec bins. Red curve is a Poisson curve with rate = median count rate of data. |
 |
 |
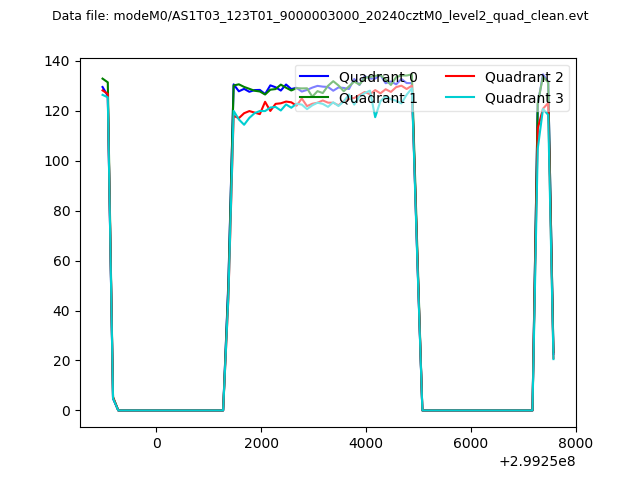
| Quadrant-wise count rates Data is divided into 100 sec bins |
 |
|
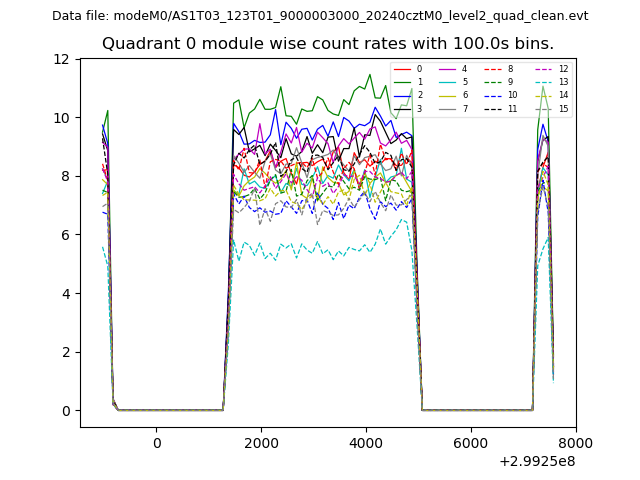
| Module-wise count rates for Quadrant A Data is divided into 100 sec bins |
 |
 |
| Module-wise count rates for Quadrant B Data is divided into 100 sec bins |
 |
 |
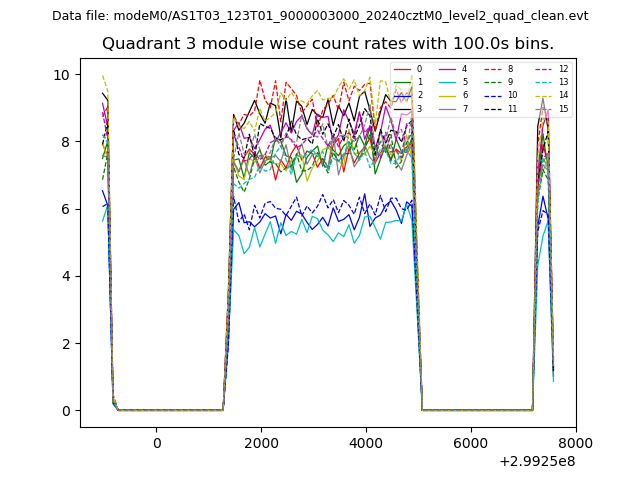
| Module-wise count rates for Quadrant C Data is divided into 100 sec bins |
 |
 |
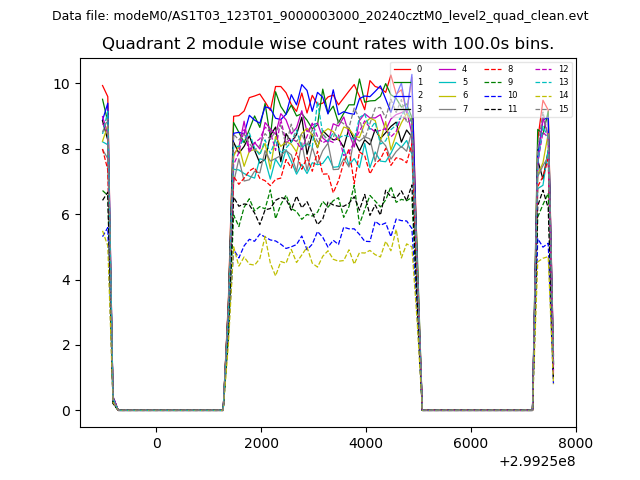
| Module-wise count rates for Quadrant D Data is divided into 100 sec bins |
 |
 |
| Parameter | Plot |
|---|---|
| CZT HV Monitor | 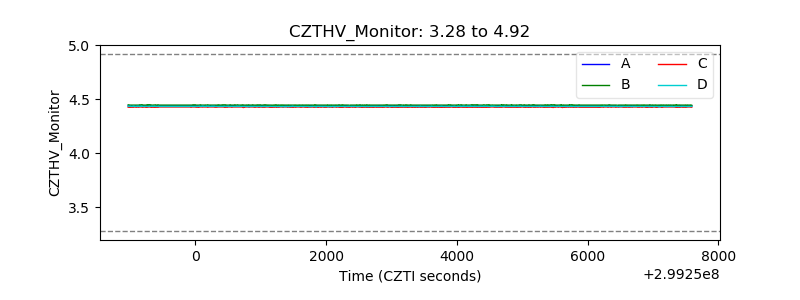 |
| D_VDD | 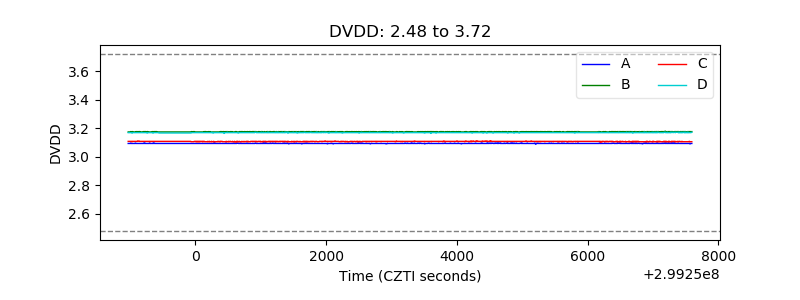 |
| Temperature 1 | 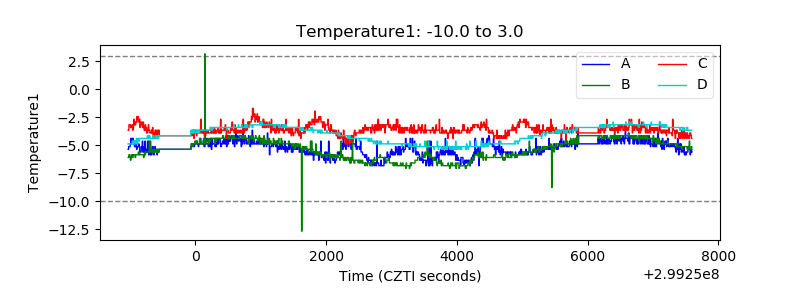 |
| Veto HV Monitor | 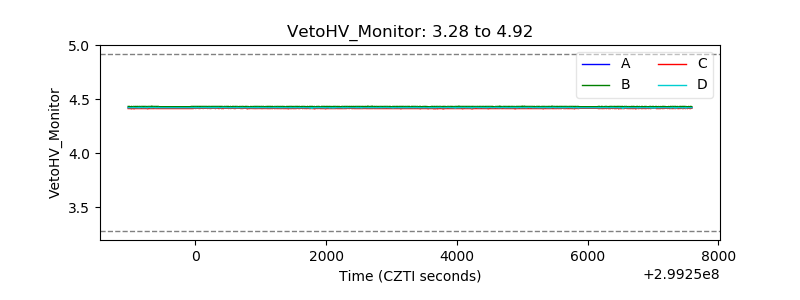 |
| Veto LLD | 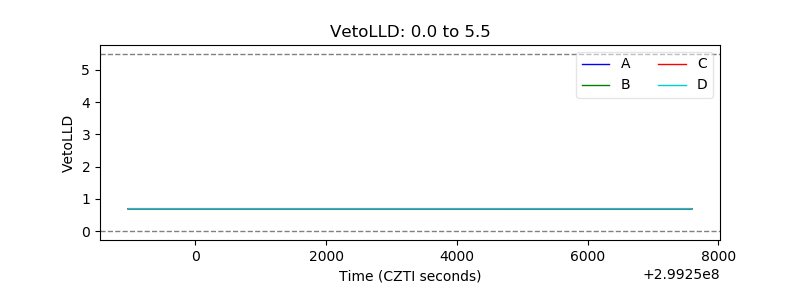 |
| Alpha Counter | 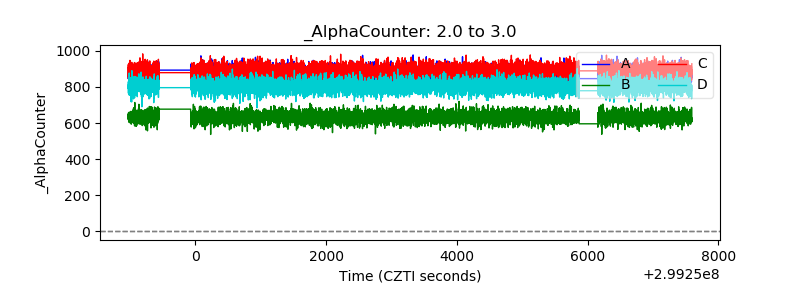 |
| _CPM_Rate | 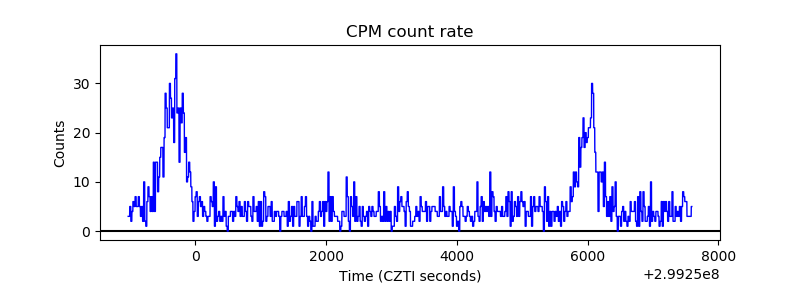 |
| CZT Counter | 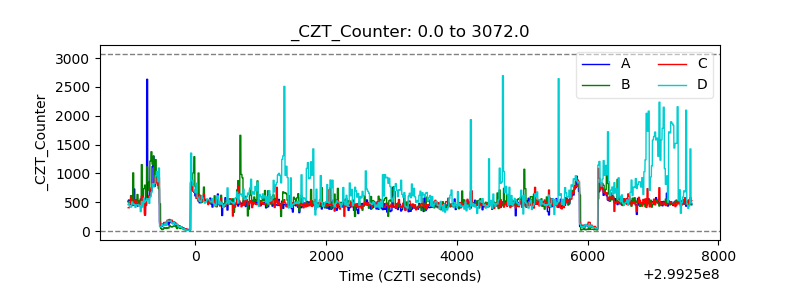 |
| +2.5 Volts monitor |  |
| +5 Volts monitor | 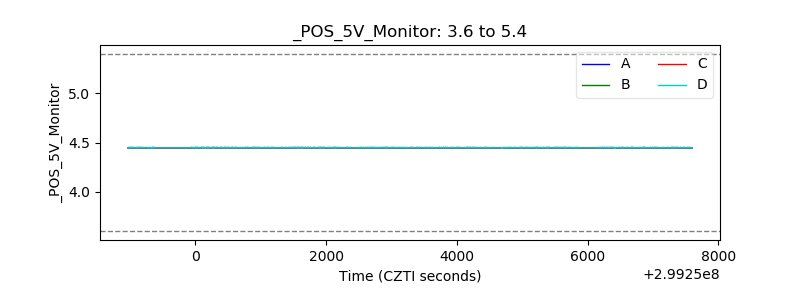 |
| _ROLL_ROT |  |
| _Roll_DEC | 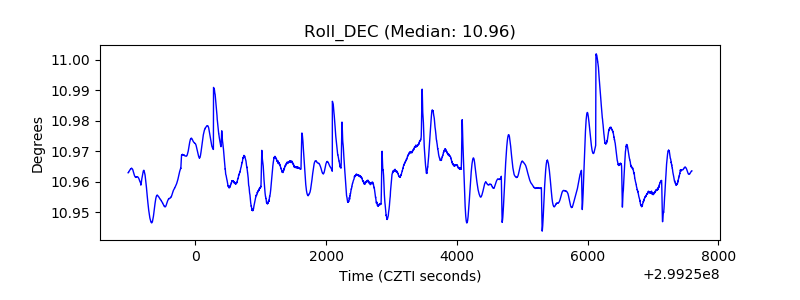 |
| _Roll_RA | 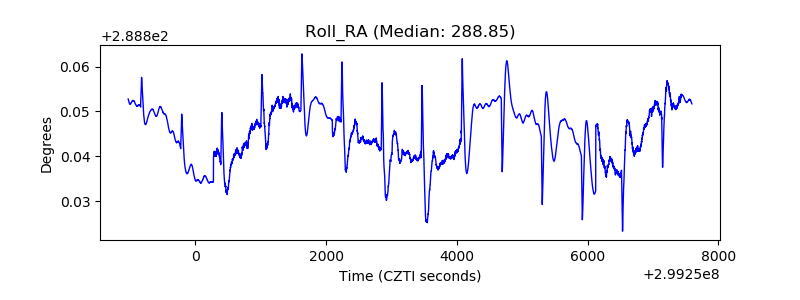 |
| Veto Counter | 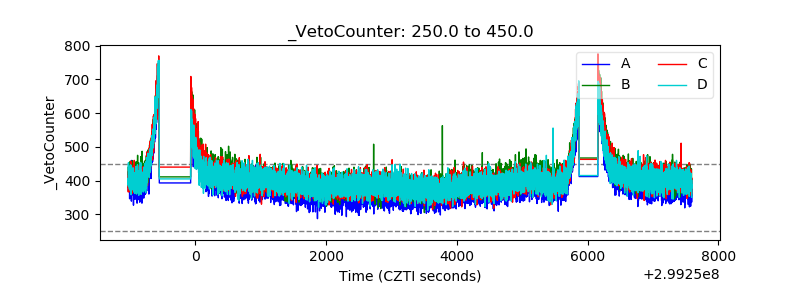 |