| Param | Original file | Final file |
|---|---|---|
| Filename | modeM0/AS1T03_123T01_9000003000_20241cztM0_level2.evt | modeM0/AS1T03_123T01_9000003000_20241cztM0_level2_quad_clean.evt |
| Size (bytes) | 556,254,720 | 92,367,360 |
| Size | 530.5 MB | 88.1 MB |
| Events in quadrant A | 3,500,659 | 586,640 |
| Events in quadrant B | 3,625,875 | 590,202 |
| Events in quadrant C | 3,672,627 | 557,158 |
| Events in quadrant D | 5,546,321 | 549,291 |
| Mode M9 | |||
|---|---|---|---|
| Quadrant | BADHDUFLAG | Total packets | Discarded packets |
| A | 0 | 4 | 0 |
| B | 0 | 4 | 0 |
| C | 0 | 4 | 0 |
| D | 0 | 4 | 0 |
| Mode SS | |||
|---|---|---|---|
| Quadrant | BADHDUFLAG | Total packets | Discarded packets |
| A | 0 | 150 | 0 |
| B | 0 | 148 | 0 |
| C | 0 | 148 | 0 |
| D | 0 | 148 | 0 |
| Mode M0 | |||
|---|---|---|---|
| Quadrant | BADHDUFLAG | Total packets | Discarded packets |
| A | 0 | 15046 | 1 |
| B | 0 | 15374 | 1 |
| C | 0 | 15353 | 1 |
| D | 0 | 21479 | 1 |
| Quadrant | Total seconds | Saturated seconds | Saturation percentage |
|---|---|---|---|
| A | 7388 | 73 | 0.988089% |
| B | 7388 | 107 | 1.448295% |
| C | 7388 | 146 | 1.976178% |
| D | 7388 | 203 | 2.747699% |
Noise dominated data is calculated using 1-second bins in cleaned event files. If a bin has >2000 counts, and if more than 50% of those come from <1% of pixels, then it is considered to be noise-dominated and hence unusable.
| Quadrant | # 1 sec bins | Bins with >0 counts | Bins with >2000 counts | High rate bins dominated by noise | Noise dominated (total time) | Noise dominated (detector-on time) | Marked lightcurve |
|---|---|---|---|---|---|---|---|
| A | 7783 | 7389 | 0 | 0 | 0.00% | 0.00% |  |
| B | 7783 | 7389 | 6 | 6 | 0.08% | 0.08% | 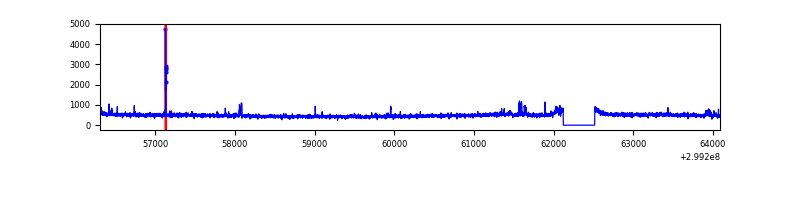 |
| C | 7783 | 7389 | 12 | 12 | 0.15% | 0.16% | 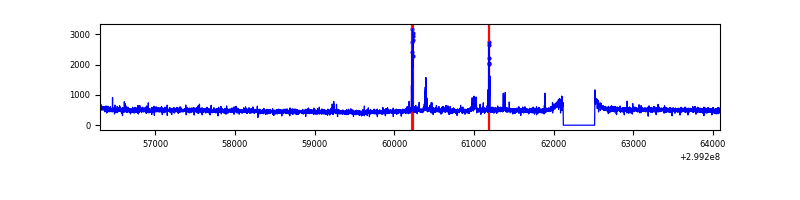 |
| D | 7783 | 7389 | 149 | 149 | 1.91% | 2.02% | 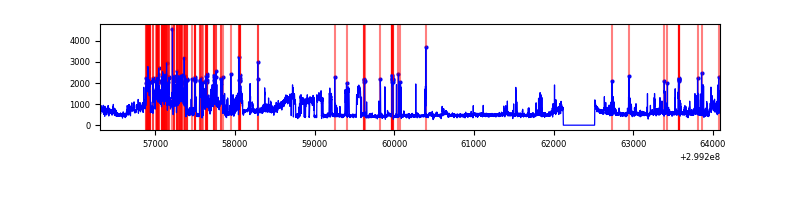 |
Top three noisy pixels from each quadrant. If the there are fewer than three noisy pixels in the level2.evt file, extra rows are filled as -1
| Pixel properties | Quadrant properties | ||||||
|---|---|---|---|---|---|---|---|
| Quadrant | DetID | PixID | Counts | Sigma | Mean | Median | Sigma |
| A | 3 | 137 | 7823 | 37.86 | 909 | 888 | 183.2 |
| A | 0 | 226 | 7674 | 37.05 | 909 | 888 | 183.2 |
| A | 12 | 194 | 6379 | 29.98 | 909 | 888 | 183.2 |
| B | 0 | 230 | 45270 | 254.94 | 901 | 877 | 174.1 |
| B | 4 | 173 | 23053 | 127.35 | 901 | 877 | 174.1 |
| B | 12 | 111 | 21707 | 119.62 | 901 | 877 | 174.1 |
| C | 14 | 238 | 132889 | 646.94 | 866 | 870 | 204.1 |
| C | 3 | 233 | 68052 | 329.22 | 866 | 870 | 204.1 |
| C | 9 | 54 | 58640 | 283.1 | 866 | 870 | 204.1 |
| D | 7 | 238 | 1379899 | 6436.49 | 880 | 855 | 214.3 |
| D | 1 | 52 | 823778 | 3840.88 | 880 | 855 | 214.3 |
| D | 2 | 234 | 37075 | 169.05 | 880 | 855 | 214.3 |
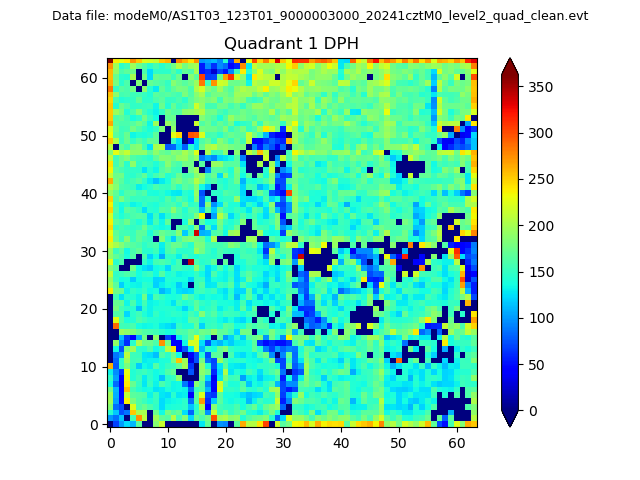
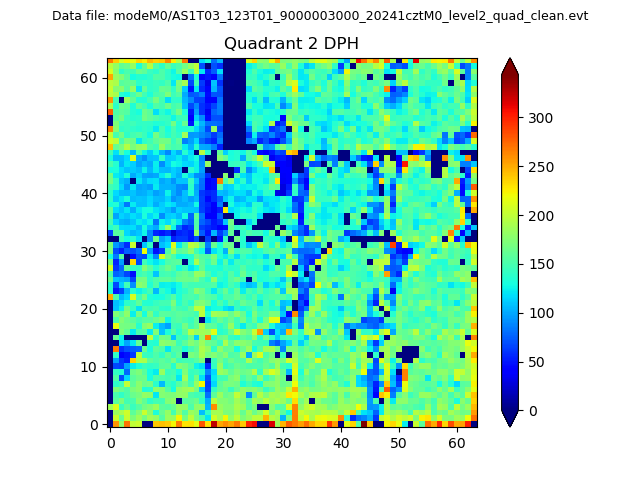
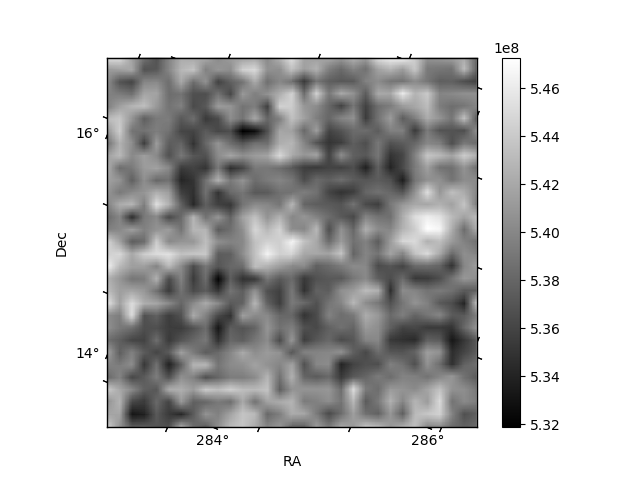
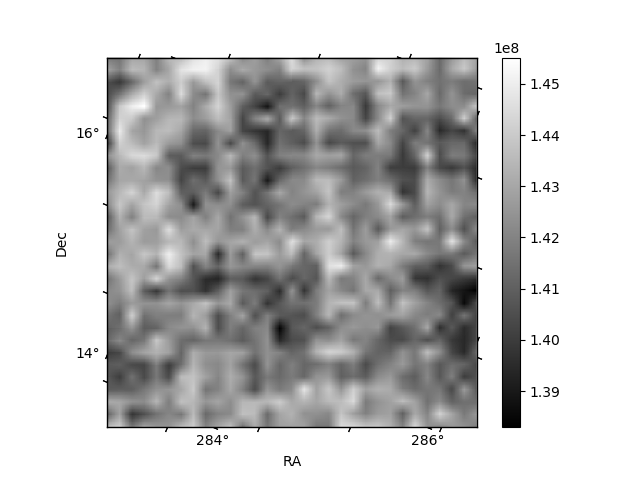
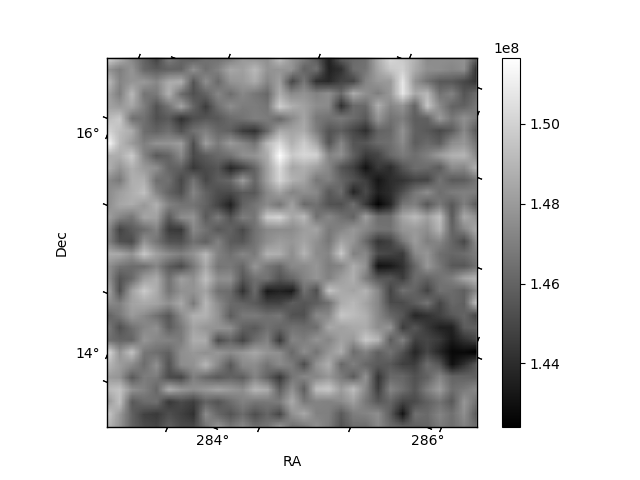
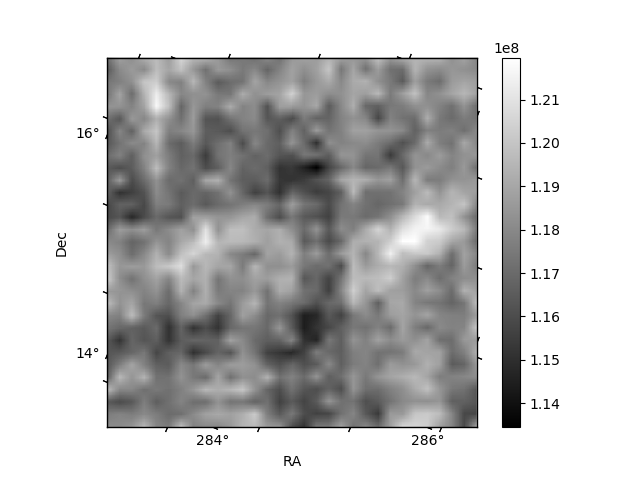
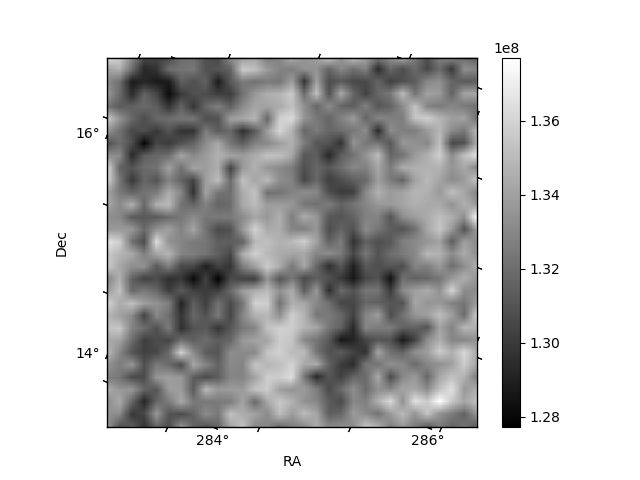
Histogram calculated using DETX and DETY for each event in the final _common_clean file
| Quadrant A | 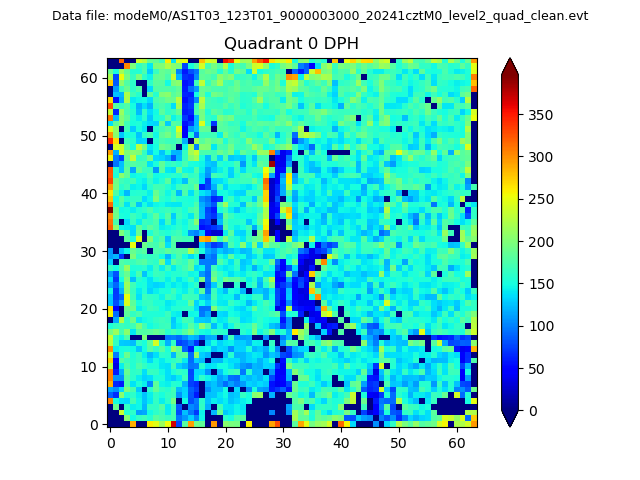 |
 |
Quadrant B |
|---|---|---|---|
| Quadrant D | 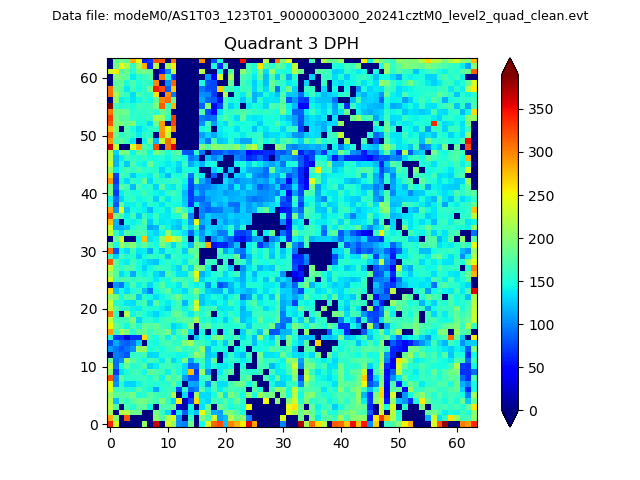 |
 |
Quadrant C |
| Plot type | Count rate plots | Images |
|---|---|---|
| Comparison with Poisson distribution Blue bars denote a histogram of data divided into 1 sec bins. Red curve is a Poisson curve with rate = median count rate of data. |
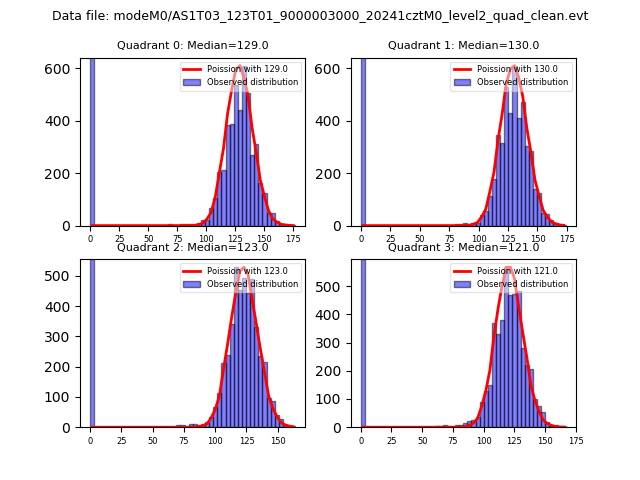 |
 |
| Quadrant-wise count rates Data is divided into 100 sec bins |
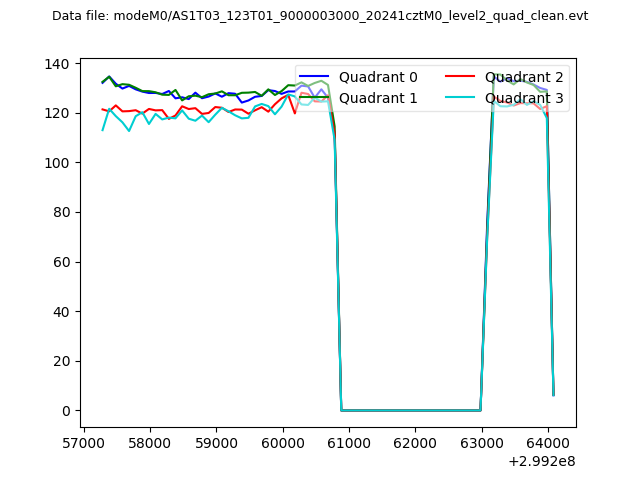 |
|
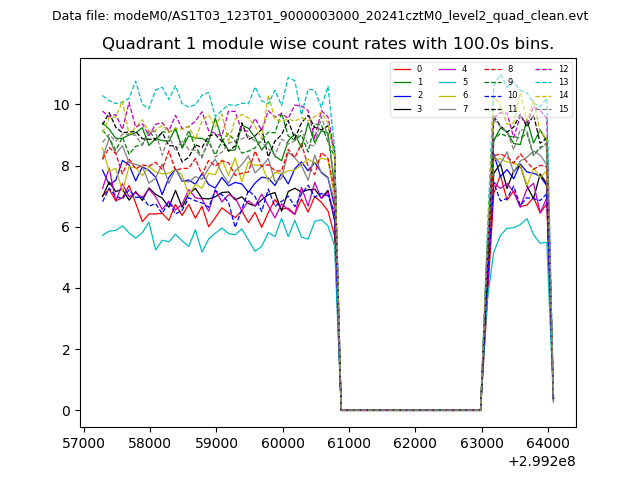
| Module-wise count rates for Quadrant A Data is divided into 100 sec bins |
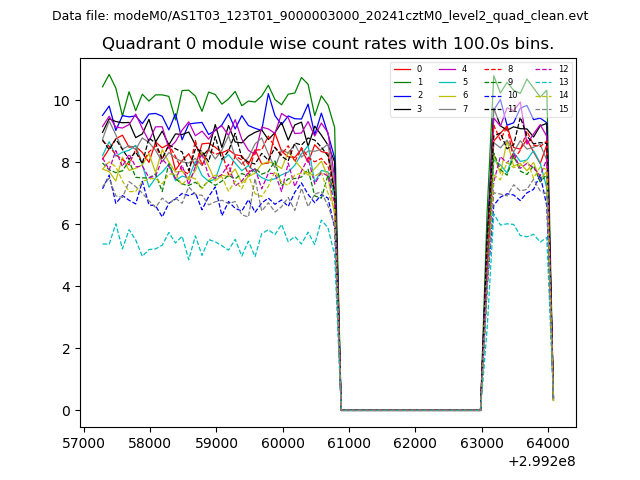 |
 |
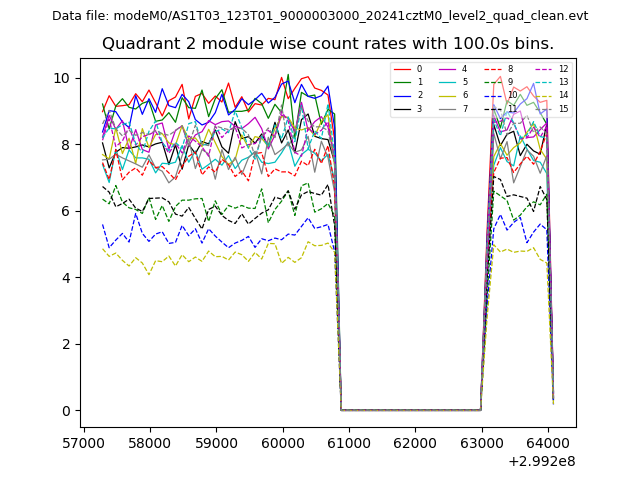
| Module-wise count rates for Quadrant B Data is divided into 100 sec bins |
 |
 |
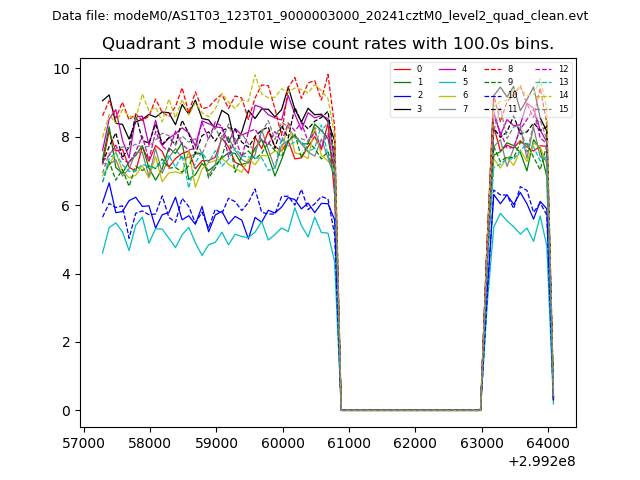
| Module-wise count rates for Quadrant C Data is divided into 100 sec bins |
 |
 |
| Module-wise count rates for Quadrant D Data is divided into 100 sec bins |
 |
 |
| Parameter | Plot |
|---|---|
| CZT HV Monitor | 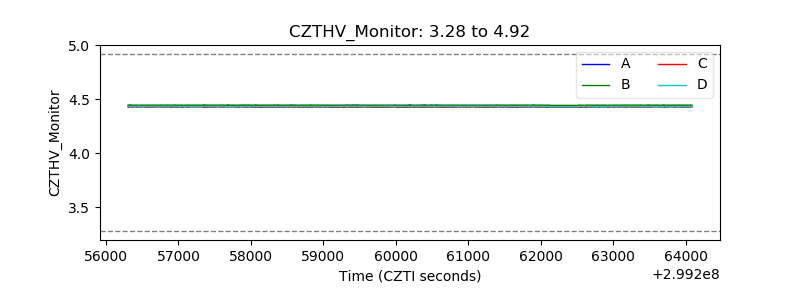 |
| D_VDD | 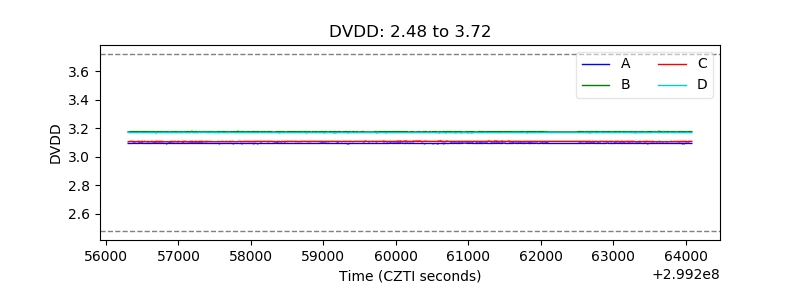 |
| Temperature 1 | 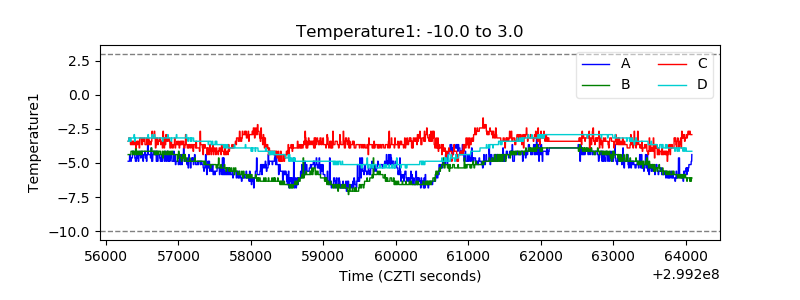 |
| Veto HV Monitor | 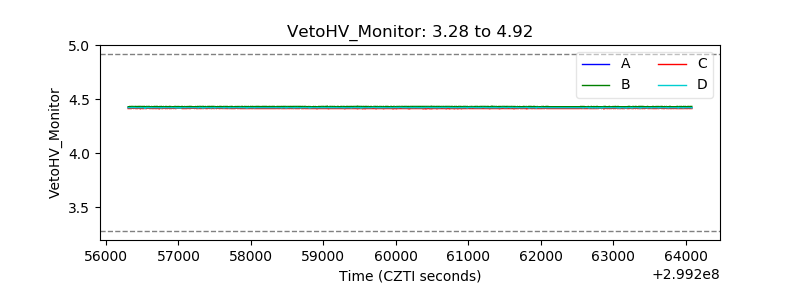 |
| Veto LLD | 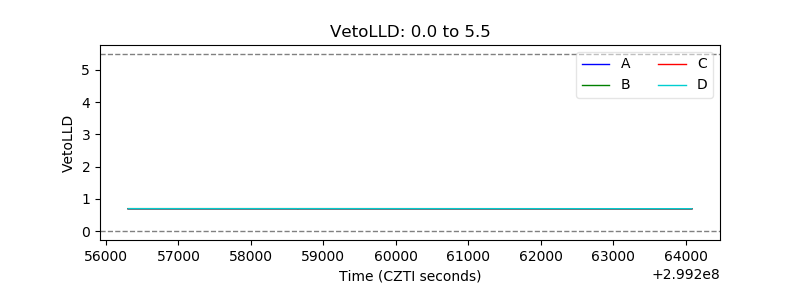 |
| Alpha Counter | 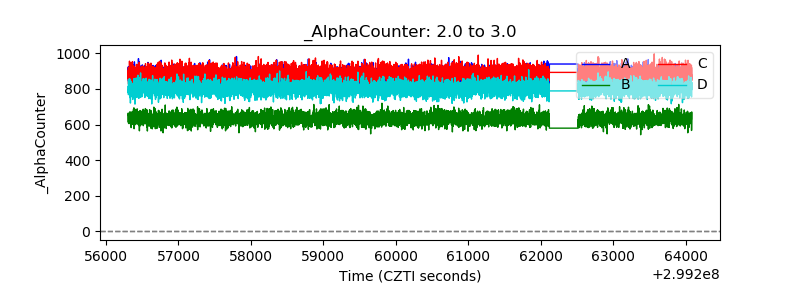 |
| _CPM_Rate | 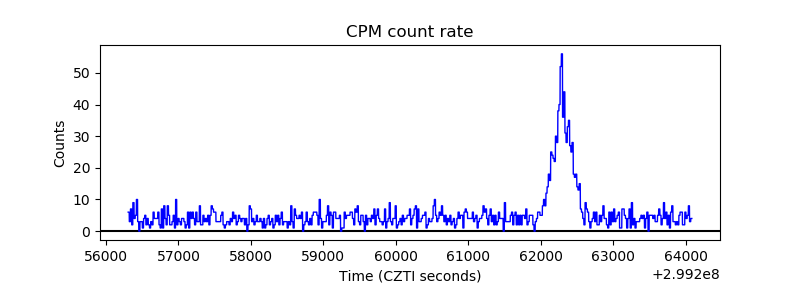 |
| CZT Counter | 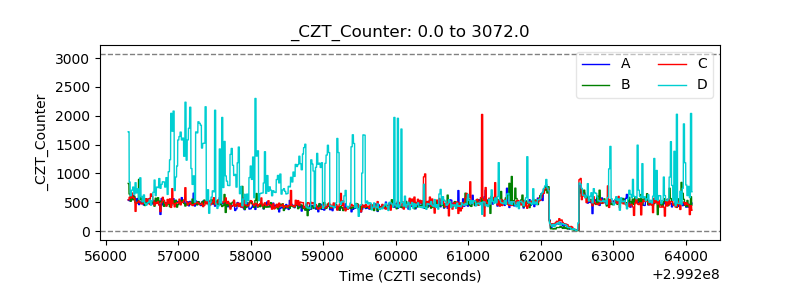 |
| +2.5 Volts monitor | 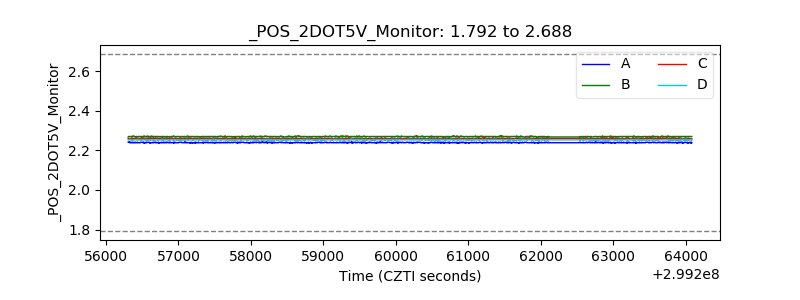 |
| +5 Volts monitor |  |
| _ROLL_ROT | 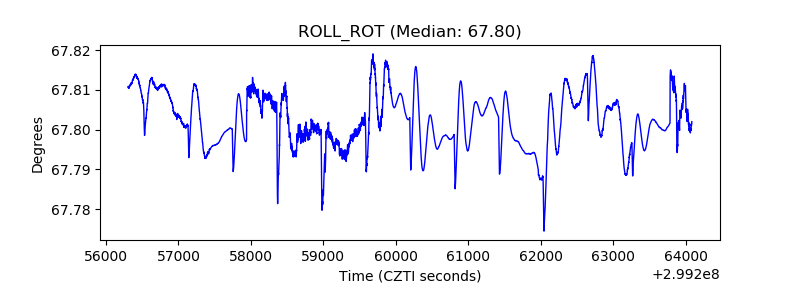 |
| _Roll_DEC | 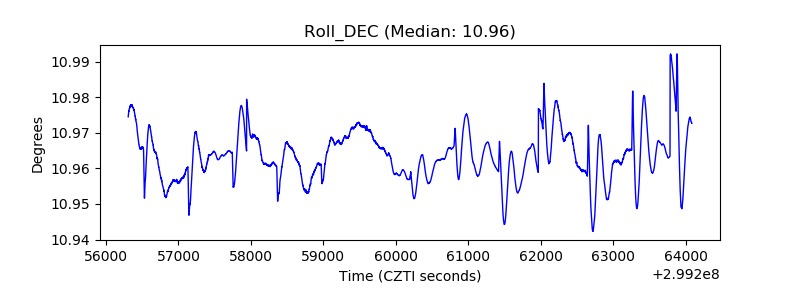 |
| _Roll_RA | 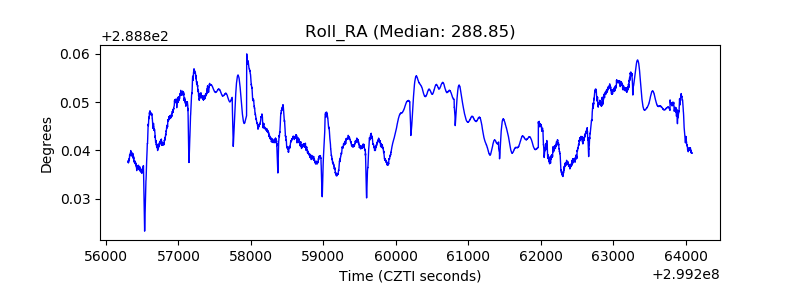 |
| Veto Counter | 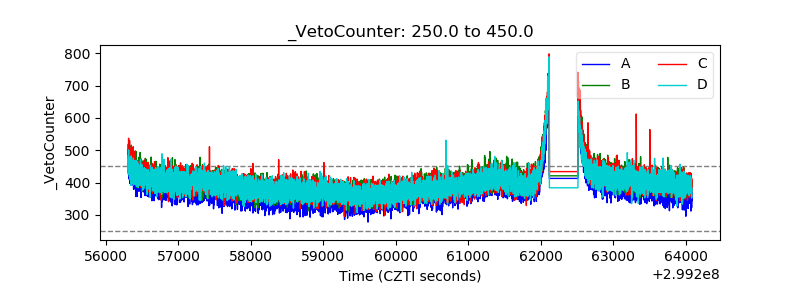 |