| Param | Original file | Final file |
|---|---|---|
| Filename | modeM0/AS1T03_123T01_9000003000_20243cztM0_level2.evt | modeM0/AS1T03_123T01_9000003000_20243cztM0_level2_quad_clean.evt |
| Size (bytes) | 931,605,120 | 174,035,520 |
| Size | 888.4 MB | 166.0 MB |
| Events in quadrant A | 6,291,247 | 1,111,183 |
| Events in quadrant B | 6,470,506 | 1,121,797 |
| Events in quadrant C | 6,745,526 | 1,063,843 |
| Events in quadrant D | 7,806,862 | 1,056,105 |
| Mode M9 | |||
|---|---|---|---|
| Quadrant | BADHDUFLAG | Total packets | Discarded packets |
| A | 0 | 17 | 0 |
| B | 0 | 17 | 0 |
| C | 0 | 17 | 0 |
| D | 0 | 17 | 0 |
| Mode SS | |||
|---|---|---|---|
| Quadrant | BADHDUFLAG | Total packets | Discarded packets |
| A | 0 | 270 | 0 |
| B | 0 | 270 | 0 |
| C | 0 | 270 | 0 |
| D | 0 | 270 | 0 |
| Mode M0 | |||
|---|---|---|---|
| Quadrant | BADHDUFLAG | Total packets | Discarded packets |
| A | 0 | 27344 | 3 |
| B | 0 | 27685 | 3 |
| C | 0 | 28261 | 3 |
| D | 0 | 32012 | 3 |
| Quadrant | Total seconds | Saturated seconds | Saturation percentage |
|---|---|---|---|
| A | 13298 | 153 | 1.150549% |
| B | 13299 | 191 | 1.436198% |
| C | 13299 | 323 | 2.428754% |
| D | 13299 | 263 | 1.977592% |
Noise dominated data is calculated using 1-second bins in cleaned event files. If a bin has >2000 counts, and if more than 50% of those come from <1% of pixels, then it is considered to be noise-dominated and hence unusable.
| Quadrant | # 1 sec bins | Bins with >0 counts | Bins with >2000 counts | High rate bins dominated by noise | Noise dominated (total time) | Noise dominated (detector-on time) | Marked lightcurve |
|---|---|---|---|---|---|---|---|
| A | 14953 | 13301 | 1 | 1 | 0.01% | 0.01% | 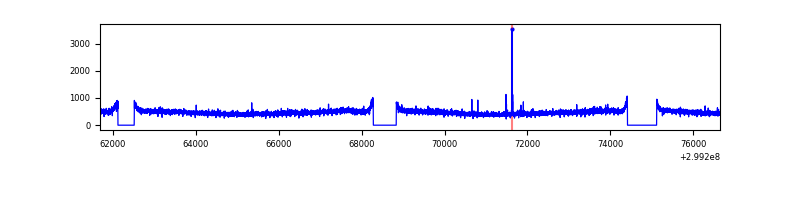 |
| B | 14954 | 13302 | 2 | 2 | 0.01% | 0.02% | 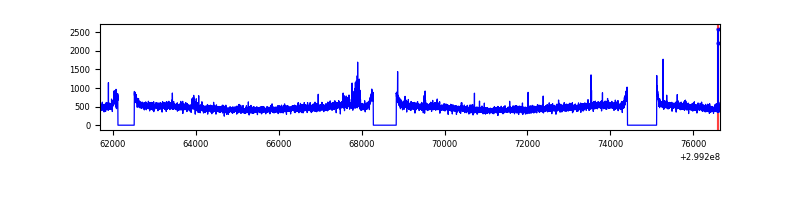 |
| C | 14954 | 13302 | 23 | 23 | 0.15% | 0.17% |  |
| D | 14954 | 13302 | 120 | 120 | 0.80% | 0.90% | 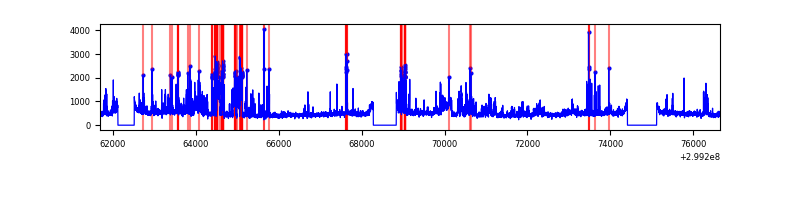 |
Top three noisy pixels from each quadrant. If the there are fewer than three noisy pixels in the level2.evt file, extra rows are filled as -1
| Pixel properties | Quadrant properties | ||||||
|---|---|---|---|---|---|---|---|
| Quadrant | DetID | PixID | Counts | Sigma | Mean | Median | Sigma |
| A | 3 | 137 | 14039 | 37.87 | 1627 | 1593 | 328.6 |
| A | 0 | 226 | 13893 | 37.43 | 1627 | 1593 | 328.6 |
| A | 4 | 2 | 12804 | 34.11 | 1627 | 1593 | 328.6 |
| B | 0 | 230 | 82500 | 258.57 | 1616 | 1574 | 313.0 |
| B | 12 | 111 | 39050 | 119.74 | 1616 | 1574 | 313.0 |
| B | 0 | 214 | 35929 | 109.77 | 1616 | 1574 | 313.0 |
| C | 9 | 54 | 294451 | 796.58 | 1560 | 1570 | 367.7 |
| C | 14 | 238 | 240425 | 649.64 | 1560 | 1570 | 367.7 |
| C | 3 | 233 | 105264 | 282.03 | 1560 | 1570 | 367.7 |
| D | 1 | 52 | 1599963 | 4140.82 | 1584 | 1536 | 386.0 |
| D | 7 | 238 | 226012 | 581.52 | 1584 | 1536 | 386.0 |
| D | 2 | 234 | 57519 | 145.03 | 1584 | 1536 | 386.0 |
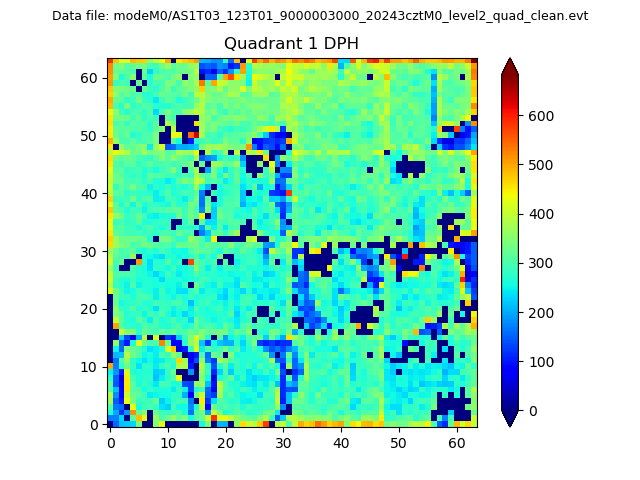
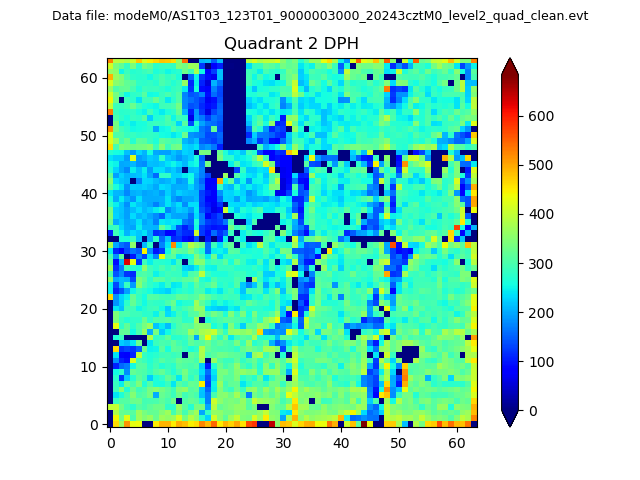
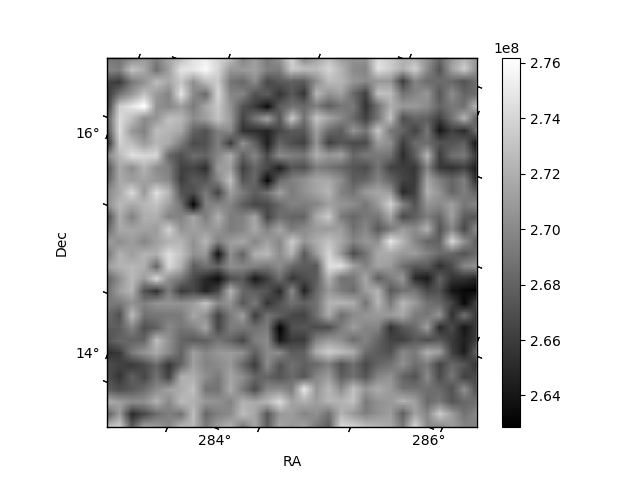
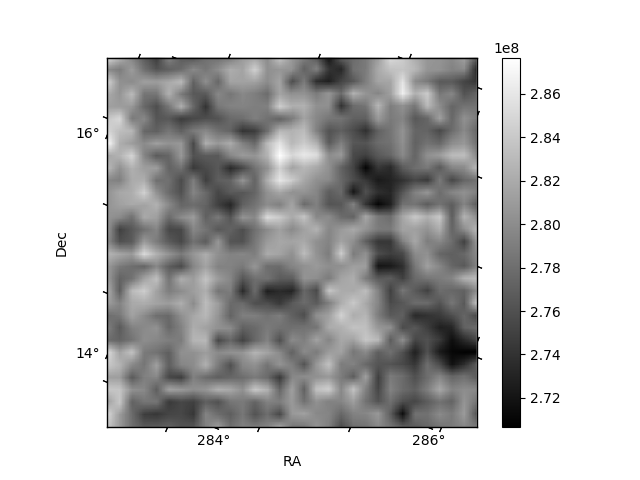
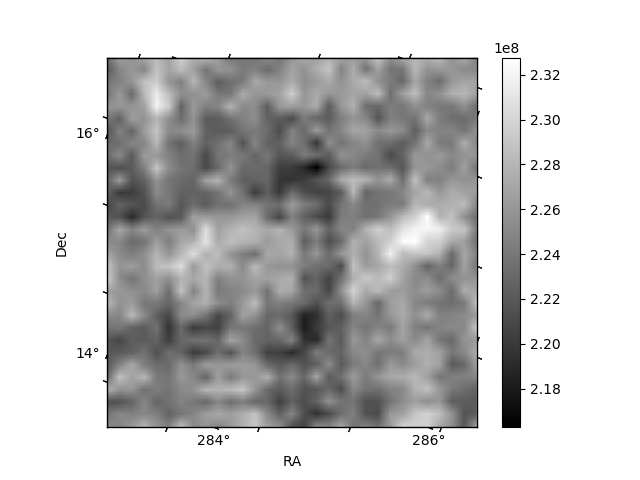
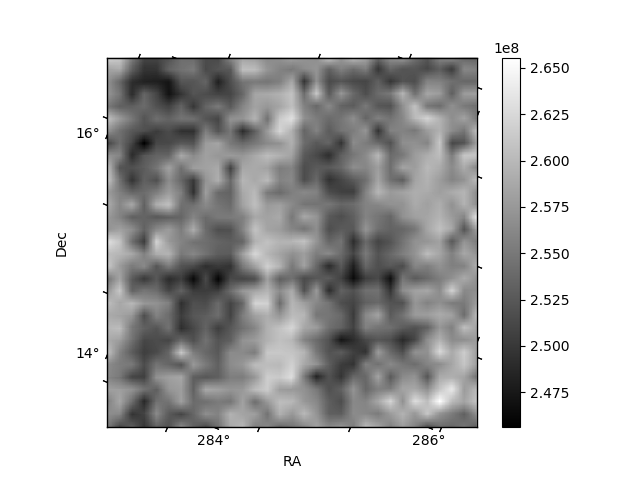
Histogram calculated using DETX and DETY for each event in the final _common_clean file
| Quadrant A |  |
 |
Quadrant B |
|---|---|---|---|
| Quadrant D | 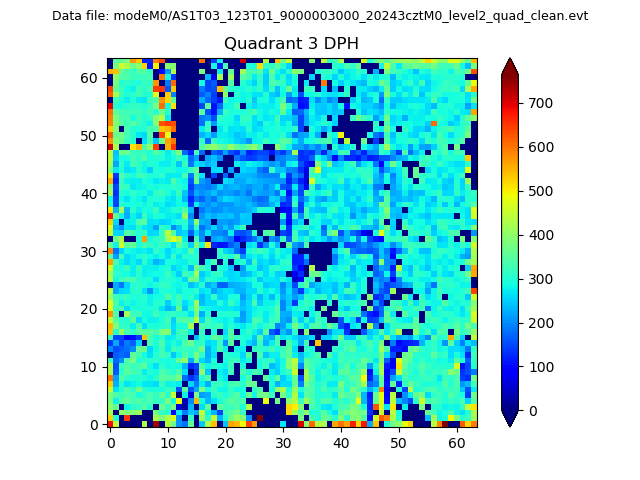 |
 |
Quadrant C |
| Plot type | Count rate plots | Images |
|---|---|---|
| Comparison with Poisson distribution Blue bars denote a histogram of data divided into 1 sec bins. Red curve is a Poisson curve with rate = median count rate of data. |
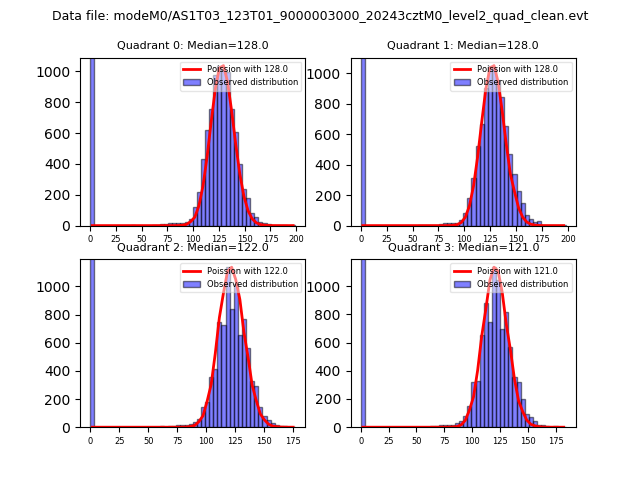 |
 |
| Quadrant-wise count rates Data is divided into 100 sec bins |
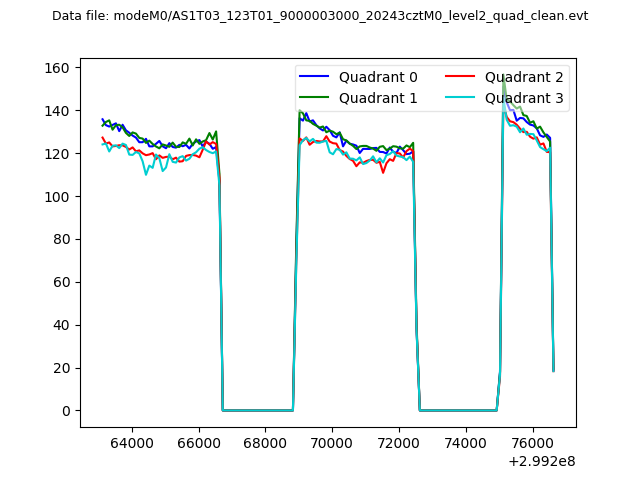 |
|
| Module-wise count rates for Quadrant A Data is divided into 100 sec bins |
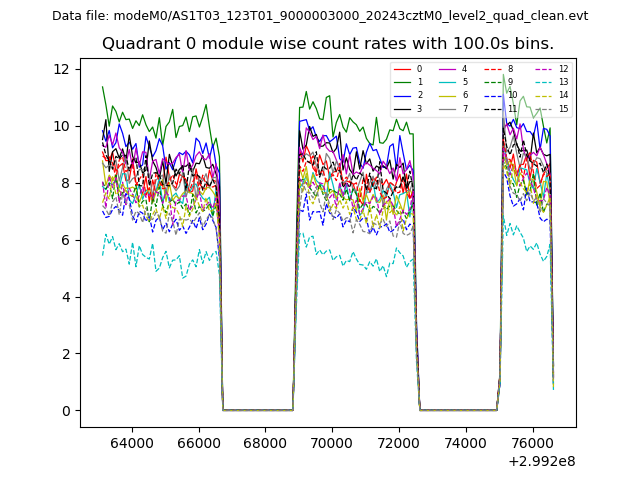 |
 |
| Module-wise count rates for Quadrant B Data is divided into 100 sec bins |
 |
 |
| Module-wise count rates for Quadrant C Data is divided into 100 sec bins |
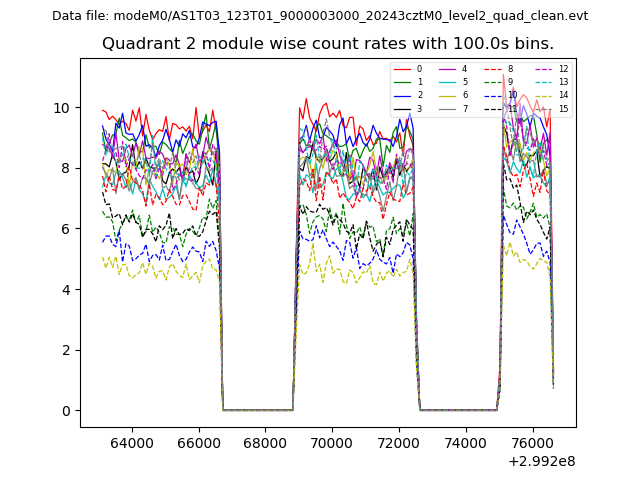 |
 |
| Module-wise count rates for Quadrant D Data is divided into 100 sec bins |
 |
 |
| Parameter | Plot |
|---|---|
| CZT HV Monitor | 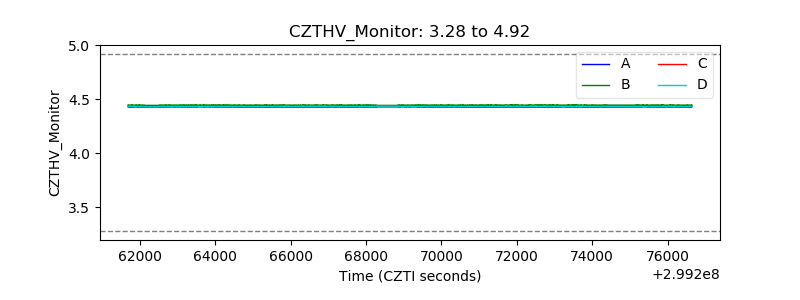 |
| D_VDD | 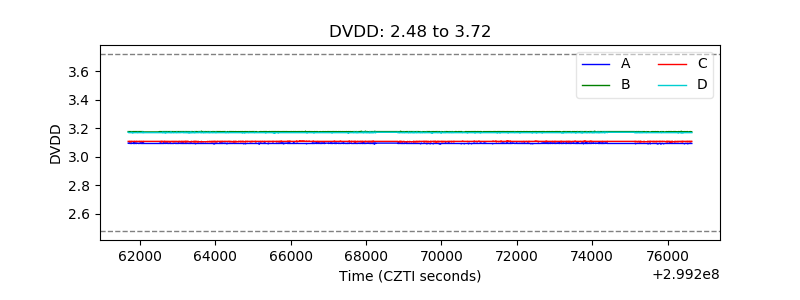 |
| Temperature 1 | 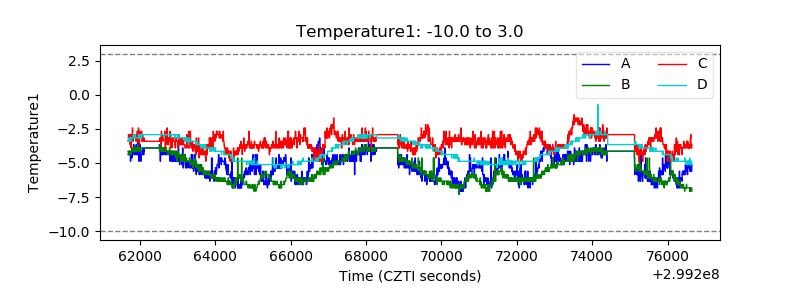 |
| Veto HV Monitor | 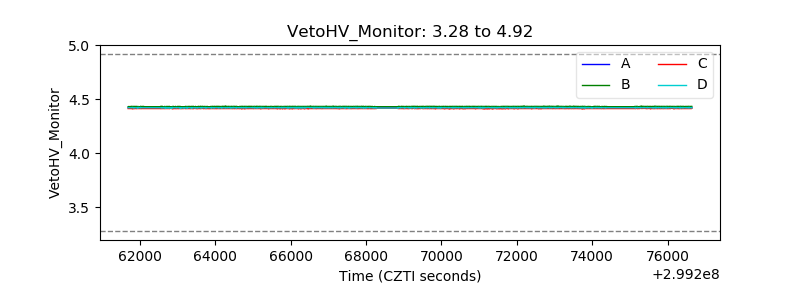 |
| Veto LLD |  |
| Alpha Counter | 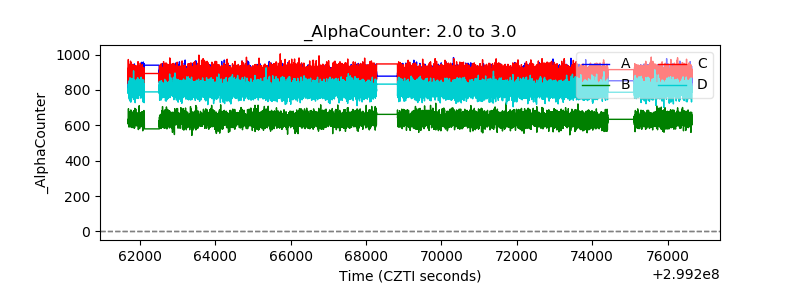 |
| _CPM_Rate | 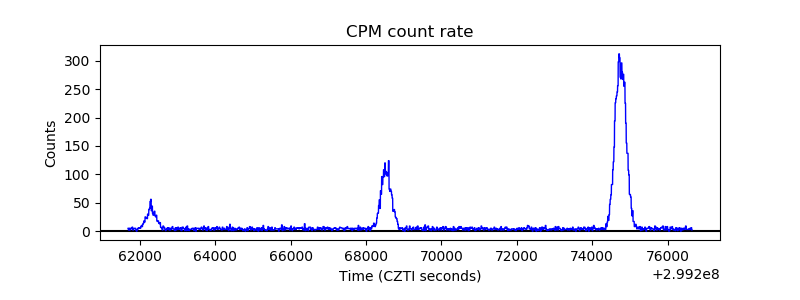 |
| CZT Counter |  |
| +2.5 Volts monitor |  |
| +5 Volts monitor |  |
| _ROLL_ROT |  |
| _Roll_DEC | 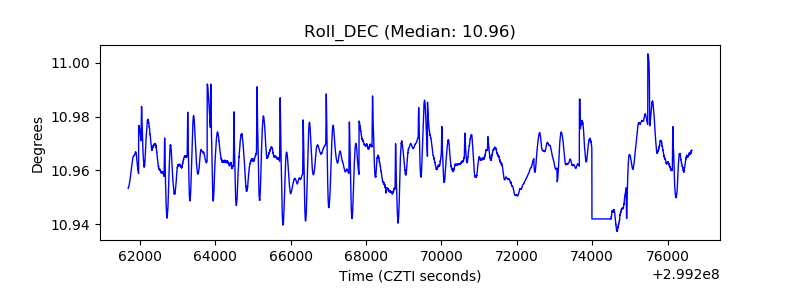 |
| _Roll_RA | 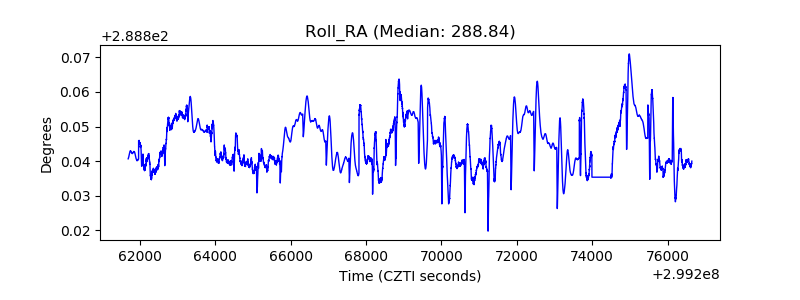 |
| Veto Counter | 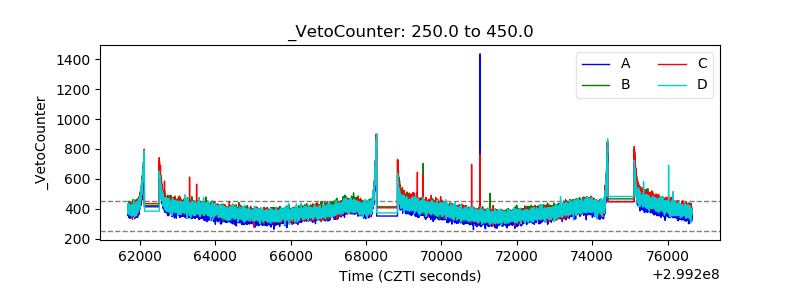 |