| Param | Original file | Final file |
|---|---|---|
| Filename | modeM0/AS1T03_123T01_9000003000_20244cztM0_level2.evt | modeM0/AS1T03_123T01_9000003000_20244cztM0_level2_quad_clean.evt |
| Size (bytes) | 462,948,480 | 94,176,000 |
| Size | 441.5 MB | 89.8 MB |
| Events in quadrant A | 3,219,081 | 605,473 |
| Events in quadrant B | 3,281,499 | 614,693 |
| Events in quadrant C | 3,316,187 | 583,617 |
| Events in quadrant D | 3,743,069 | 575,891 |
| Mode M9 | |||
|---|---|---|---|
| Quadrant | BADHDUFLAG | Total packets | Discarded packets |
| A | 0 | 9 | 0 |
| B | 0 | 10 | 0 |
| C | 0 | 10 | 0 |
| D | 0 | 10 | 0 |
| Mode SS | |||
|---|---|---|---|
| Quadrant | BADHDUFLAG | Total packets | Discarded packets |
| A | 0 | 136 | 0 |
| B | 0 | 136 | 0 |
| C | 0 | 136 | 0 |
| D | 0 | 136 | 0 |
| Mode M0 | |||
|---|---|---|---|
| Quadrant | BADHDUFLAG | Total packets | Discarded packets |
| A | 0 | 14005 | 2 |
| B | 0 | 14132 | 2 |
| C | 0 | 14150 | 2 |
| D | 0 | 15630 | 3 |
| Quadrant | Total seconds | Saturated seconds | Saturation percentage |
|---|---|---|---|
| A | 6783 | 58 | 0.855079% |
| B | 6783 | 65 | 0.958278% |
| C | 6783 | 107 | 1.577473% |
| D | 6782 | 145 | 2.138012% |
Noise dominated data is calculated using 1-second bins in cleaned event files. If a bin has >2000 counts, and if more than 50% of those come from <1% of pixels, then it is considered to be noise-dominated and hence unusable.
| Quadrant | # 1 sec bins | Bins with >0 counts | Bins with >2000 counts | High rate bins dominated by noise | Noise dominated (total time) | Noise dominated (detector-on time) | Marked lightcurve |
|---|---|---|---|---|---|---|---|
| A | 7633 | 6784 | 6 | 6 | 0.08% | 0.09% | 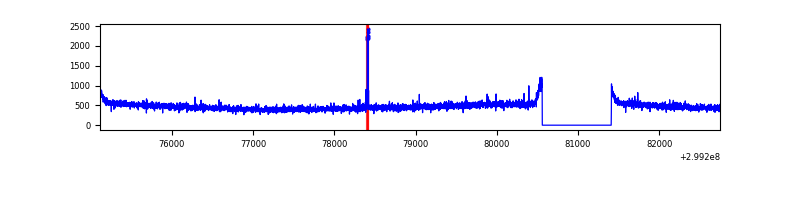 |
| B | 7633 | 6784 | 2 | 2 | 0.03% | 0.03% | 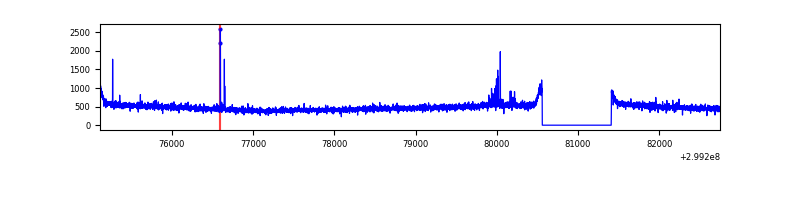 |
| C | 7633 | 6784 | 4 | 4 | 0.05% | 0.06% | 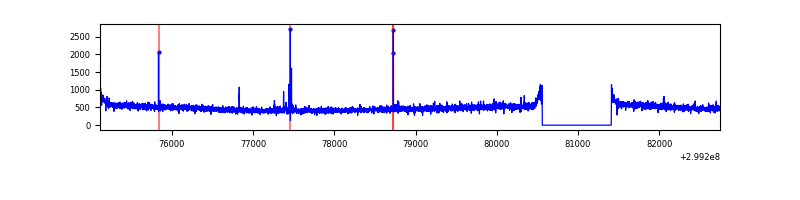 |
| D | 7632 | 6783 | 84 | 84 | 1.10% | 1.24% | 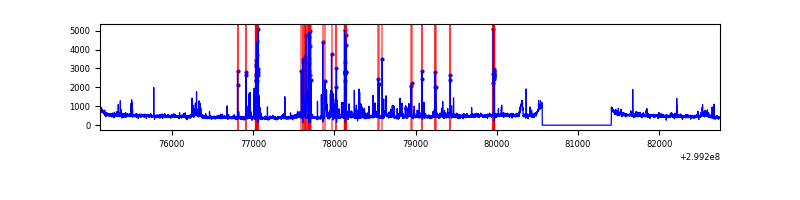 |
Top three noisy pixels from each quadrant. If the there are fewer than three noisy pixels in the level2.evt file, extra rows are filled as -1
| Pixel properties | Quadrant properties | ||||||
|---|---|---|---|---|---|---|---|
| Quadrant | DetID | PixID | Counts | Sigma | Mean | Median | Sigma |
| A | 9 | 143 | 26324 | 151.43 | 830 | 814 | 168.5 |
| A | 0 | 226 | 7011 | 36.79 | 830 | 814 | 168.5 |
| A | 3 | 137 | 6962 | 36.5 | 830 | 814 | 168.5 |
| B | 0 | 230 | 23867 | 145.52 | 825 | 804 | 158.5 |
| B | 12 | 111 | 19957 | 120.85 | 825 | 804 | 158.5 |
| B | 11 | 111 | 18002 | 108.51 | 825 | 804 | 158.5 |
| C | 14 | 238 | 125193 | 655.66 | 800 | 807 | 189.7 |
| C | 3 | 233 | 26449 | 135.16 | 800 | 807 | 189.7 |
| C | 9 | 54 | 24240 | 123.52 | 800 | 807 | 189.7 |
| D | 1 | 52 | 675600 | 3431.25 | 806 | 782 | 196.7 |
| D | 2 | 234 | 27499 | 135.85 | 806 | 782 | 196.7 |
| D | 9 | 85 | 18768 | 91.45 | 806 | 782 | 196.7 |
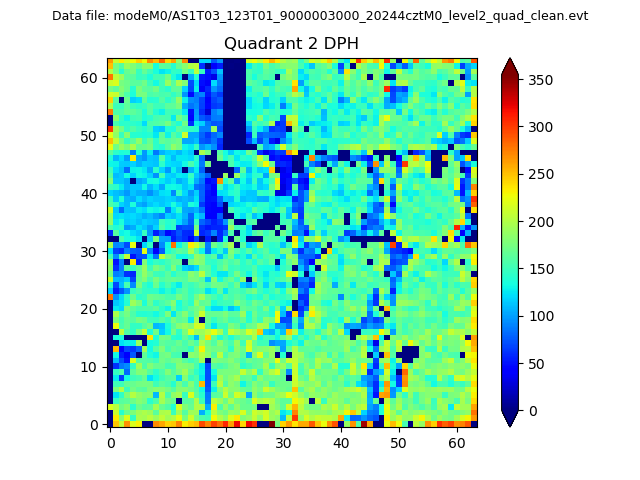
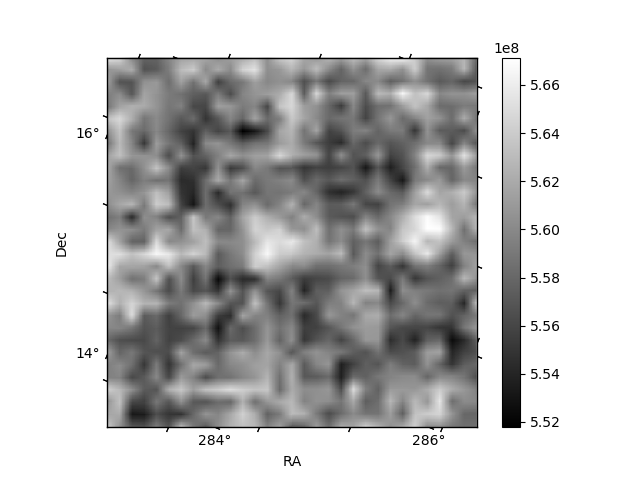
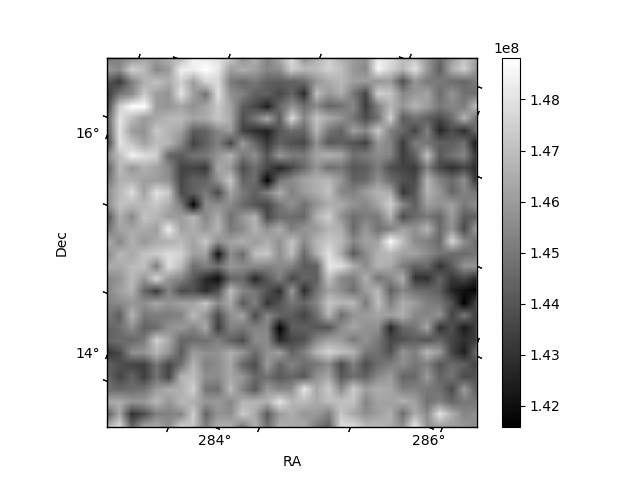
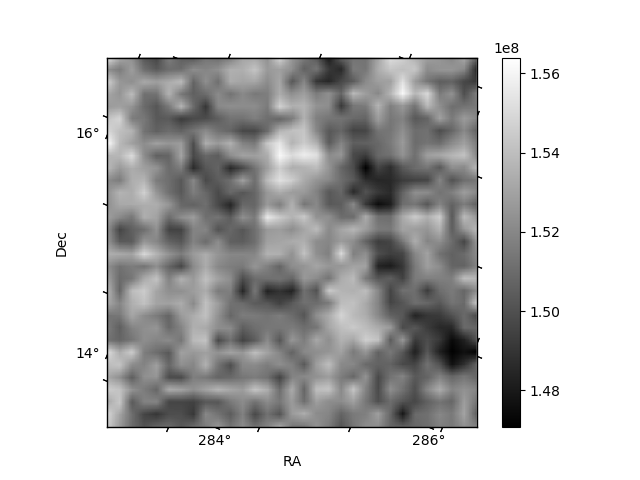
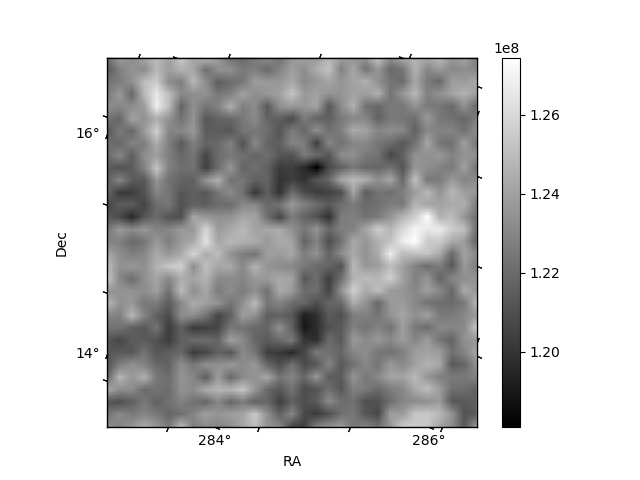
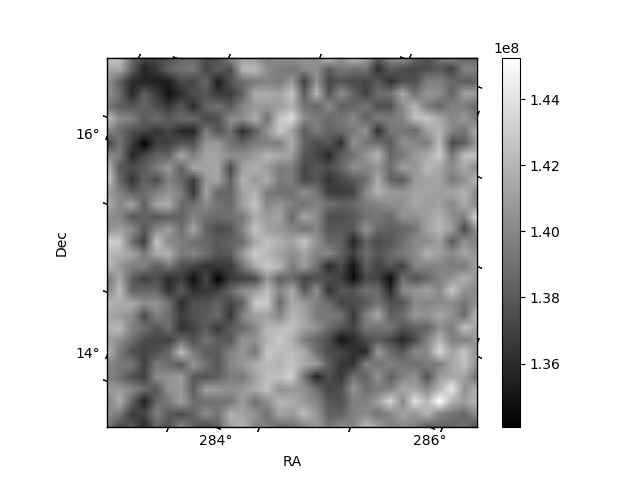
Histogram calculated using DETX and DETY for each event in the final _common_clean file
| Quadrant A | 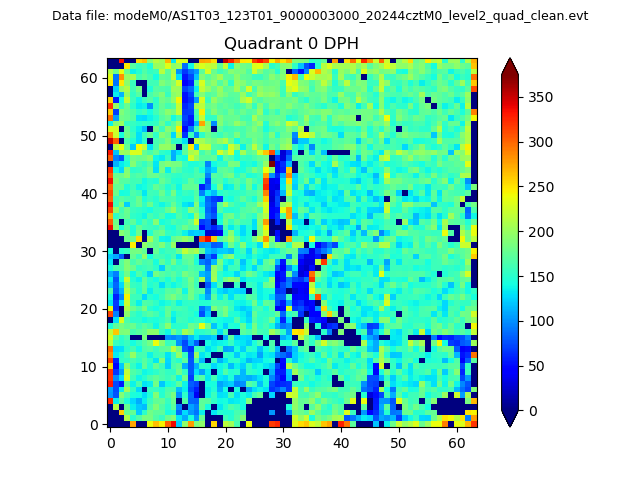 |
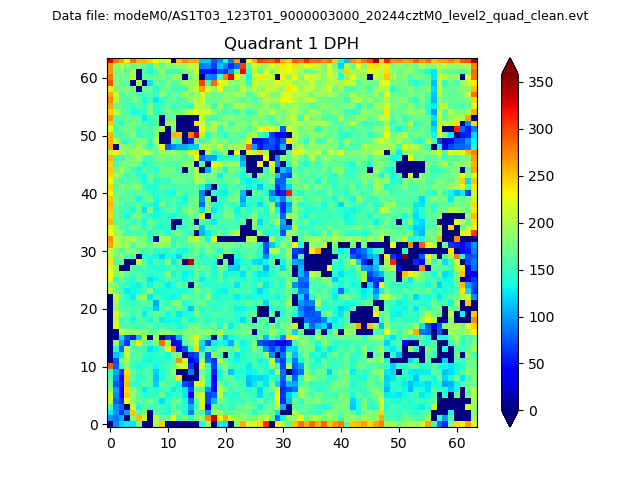 |
Quadrant B |
|---|---|---|---|
| Quadrant D | 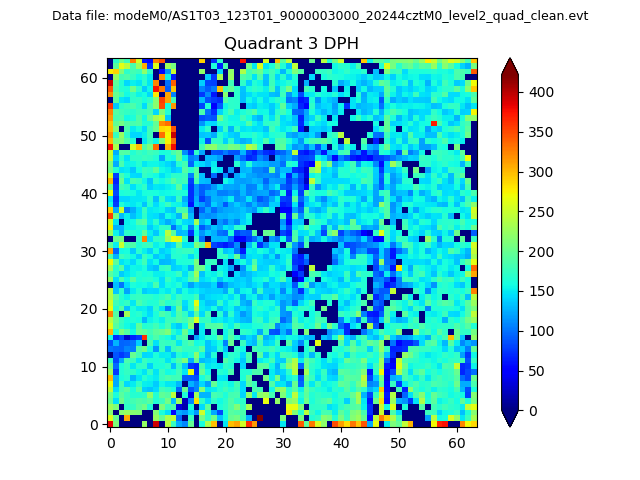 |
 |
Quadrant C |
| Plot type | Count rate plots | Images |
|---|---|---|
| Comparison with Poisson distribution Blue bars denote a histogram of data divided into 1 sec bins. Red curve is a Poisson curve with rate = median count rate of data. |
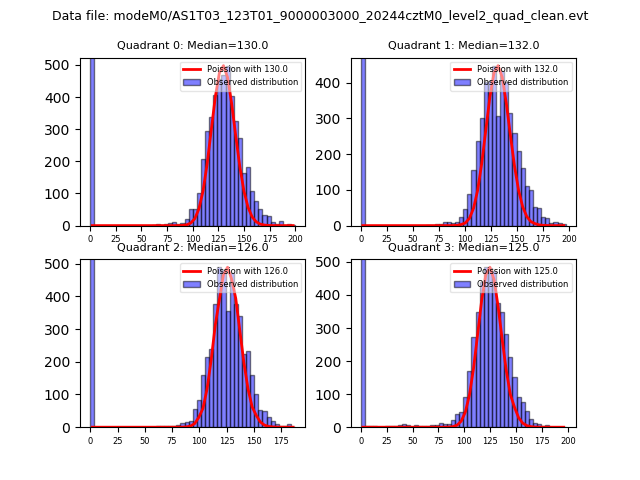 |
 |
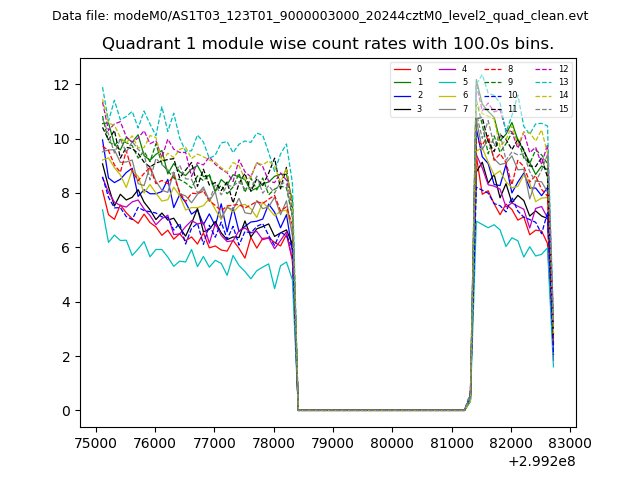
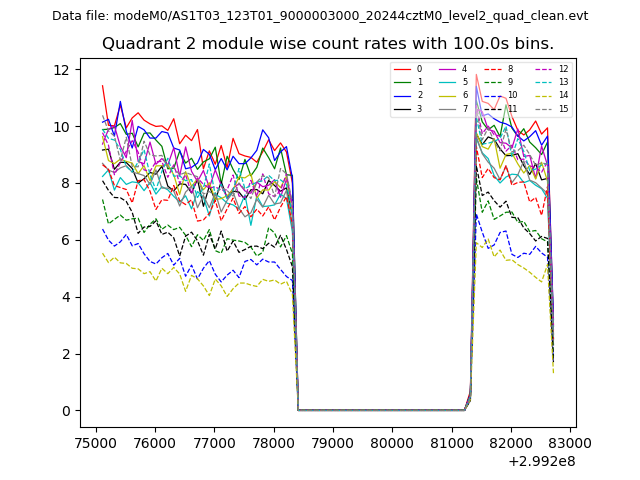
| Quadrant-wise count rates Data is divided into 100 sec bins |
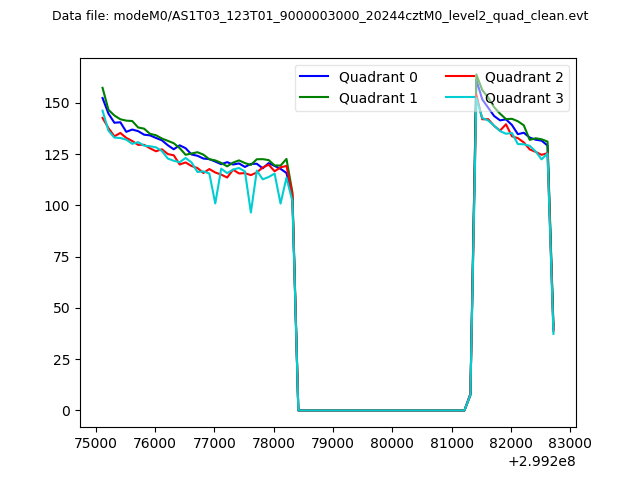 |
|
| Module-wise count rates for Quadrant A Data is divided into 100 sec bins |
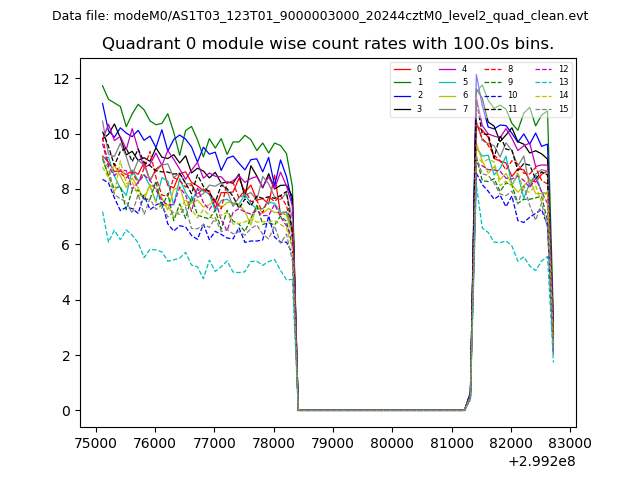 |
 |
| Module-wise count rates for Quadrant B Data is divided into 100 sec bins |
 |
 |
| Module-wise count rates for Quadrant C Data is divided into 100 sec bins |
 |
 |
| Module-wise count rates for Quadrant D Data is divided into 100 sec bins |
 |
 |
| Parameter | Plot |
|---|---|
| CZT HV Monitor | 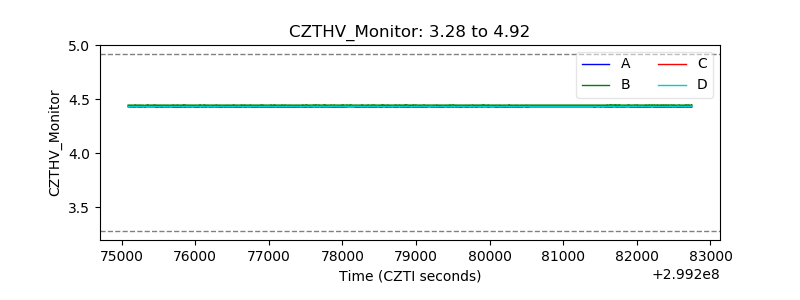 |
| D_VDD | 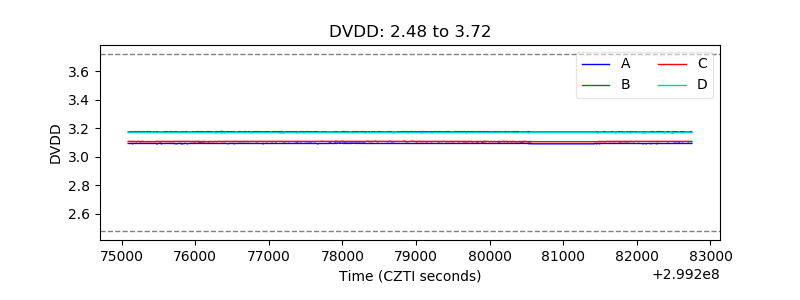 |
| Temperature 1 |  |
| Veto HV Monitor | 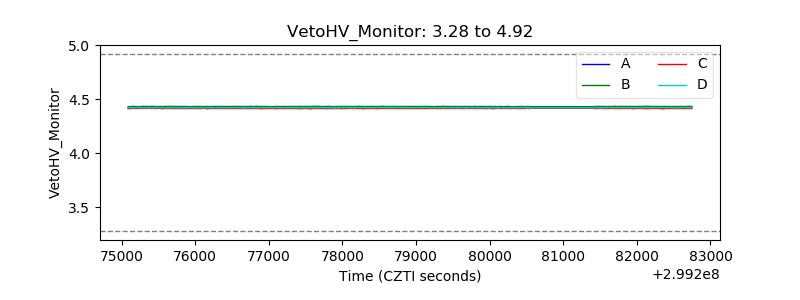 |
| Veto LLD | 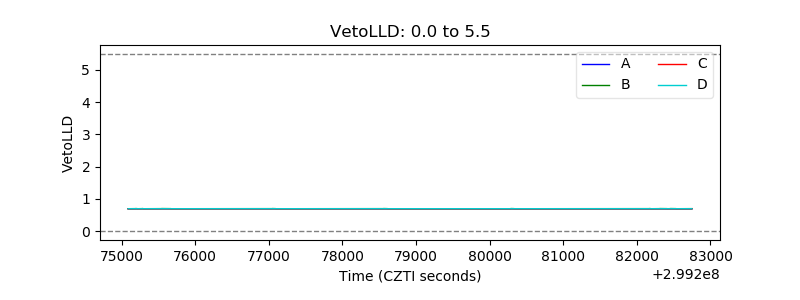 |
| Alpha Counter | 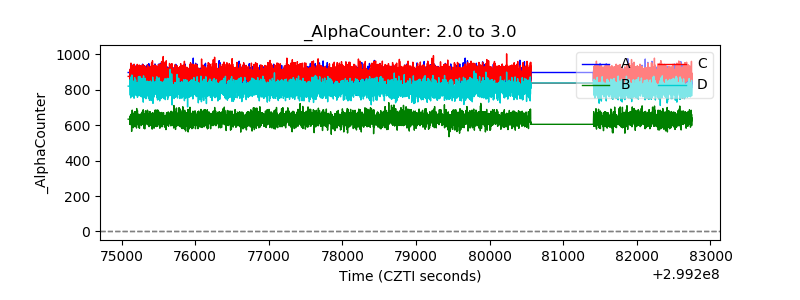 |
| _CPM_Rate | 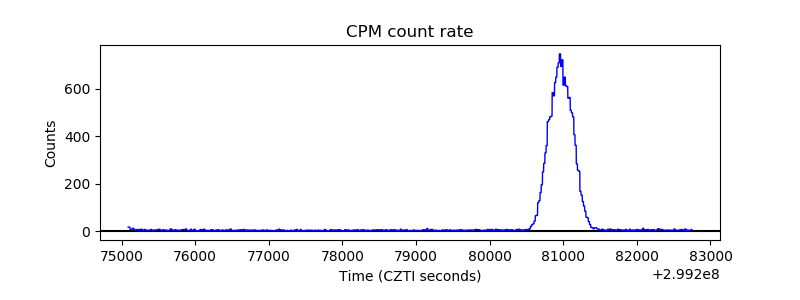 |
| CZT Counter | 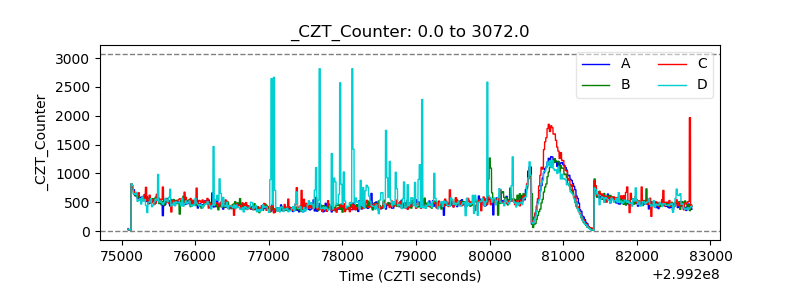 |
| +2.5 Volts monitor |  |
| +5 Volts monitor |  |
| _ROLL_ROT | 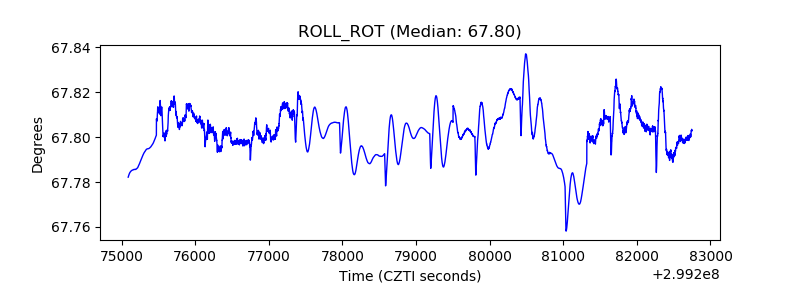 |
| _Roll_DEC |  |
| _Roll_RA | 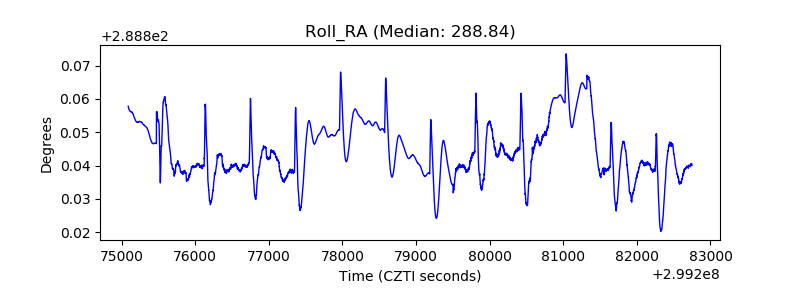 |
| Veto Counter | 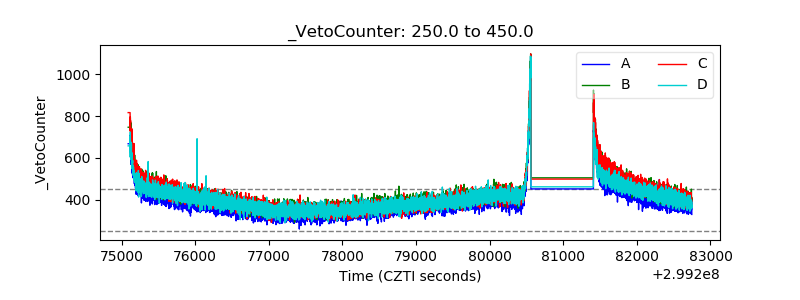 |