| Param | Original file | Final file |
|---|---|---|
| Filename | modeM0/AS1T03_123T01_9000003000_20245cztM0_level2.evt | modeM0/AS1T03_123T01_9000003000_20245cztM0_level2_quad_clean.evt |
| Size (bytes) | 444,859,200 | 92,407,680 |
| Size | 424.3 MB | 88.1 MB |
| Events in quadrant A | 3,126,144 | 593,789 |
| Events in quadrant B | 3,183,731 | 603,611 |
| Events in quadrant C | 3,232,191 | 571,654 |
| Events in quadrant D | 3,480,367 | 567,772 |
| Mode M9 | |||
|---|---|---|---|
| Quadrant | BADHDUFLAG | Total packets | Discarded packets |
| A | 0 | 16 | 0 |
| B | 0 | 17 | 0 |
| C | 0 | 17 | 0 |
| D | 0 | 17 | 0 |
| Mode SS | |||
|---|---|---|---|
| Quadrant | BADHDUFLAG | Total packets | Discarded packets |
| A | 0 | 134 | 0 |
| B | 0 | 134 | 0 |
| C | 0 | 134 | 0 |
| D | 0 | 134 | 0 |
| Mode M0 | |||
|---|---|---|---|
| Quadrant | BADHDUFLAG | Total packets | Discarded packets |
| A | 0 | 13614 | 2 |
| B | 0 | 13697 | 2 |
| C | 0 | 13829 | 2 |
| D | 0 | 14897 | 2 |
| Quadrant | Total seconds | Saturated seconds | Saturation percentage |
|---|---|---|---|
| A | 6622 | 39 | 0.588946% |
| B | 6622 | 52 | 0.785261% |
| C | 6622 | 74 | 1.117487% |
| D | 6622 | 46 | 0.694654% |
Noise dominated data is calculated using 1-second bins in cleaned event files. If a bin has >2000 counts, and if more than 50% of those come from <1% of pixels, then it is considered to be noise-dominated and hence unusable.
| Quadrant | # 1 sec bins | Bins with >0 counts | Bins with >2000 counts | High rate bins dominated by noise | Noise dominated (total time) | Noise dominated (detector-on time) | Marked lightcurve |
|---|---|---|---|---|---|---|---|
| A | 7637 | 6623 | 1 | 1 | 0.01% | 0.02% | 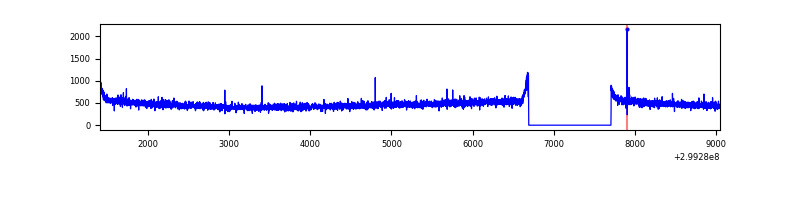 |
| B | 7637 | 6623 | 0 | 0 | 0.00% | 0.00% | 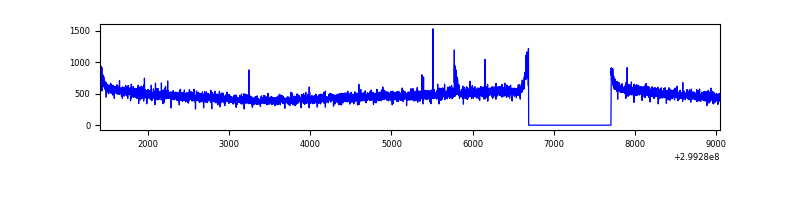 |
| C | 7637 | 6623 | 0 | 0 | 0.00% | 0.00% | 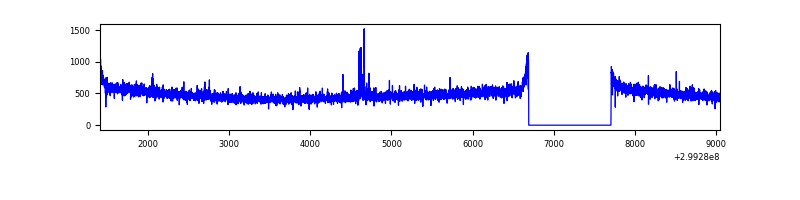 |
| D | 7637 | 6623 | 18 | 18 | 0.24% | 0.27% | 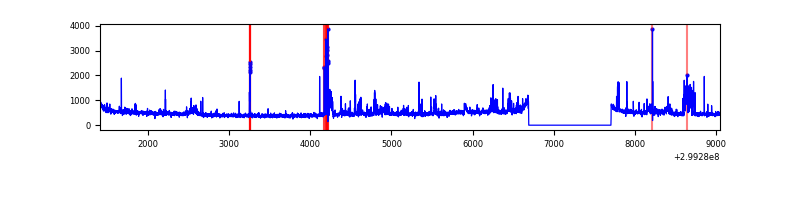 |
Top three noisy pixels from each quadrant. If the there are fewer than three noisy pixels in the level2.evt file, extra rows are filled as -1
| Pixel properties | Quadrant properties | ||||||
|---|---|---|---|---|---|---|---|
| Quadrant | DetID | PixID | Counts | Sigma | Mean | Median | Sigma |
| A | 0 | 226 | 6799 | 36.65 | 812 | 798 | 163.7 |
| A | 3 | 137 | 6769 | 36.47 | 812 | 798 | 163.7 |
| A | 12 | 194 | 5671 | 29.76 | 812 | 798 | 163.7 |
| B | 12 | 111 | 19058 | 116.92 | 810 | 791 | 156.2 |
| B | 11 | 111 | 17231 | 105.23 | 810 | 791 | 156.2 |
| B | 14 | 111 | 15927 | 96.88 | 810 | 791 | 156.2 |
| C | 14 | 238 | 122462 | 664.65 | 781 | 786 | 183.1 |
| C | 9 | 54 | 25865 | 136.99 | 781 | 786 | 183.1 |
| C | 3 | 233 | 21634 | 113.88 | 781 | 786 | 183.1 |
| D | 1 | 52 | 462086 | 2438.42 | 788 | 766 | 189.2 |
| D | 2 | 234 | 28084 | 144.4 | 788 | 766 | 189.2 |
| D | 2 | 184 | 21072 | 107.33 | 788 | 766 | 189.2 |
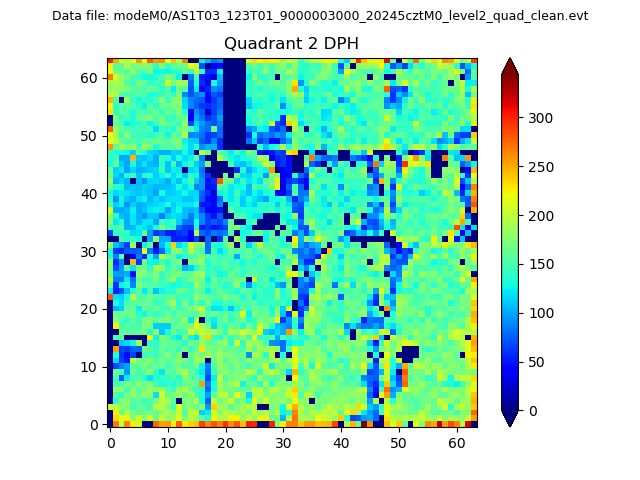
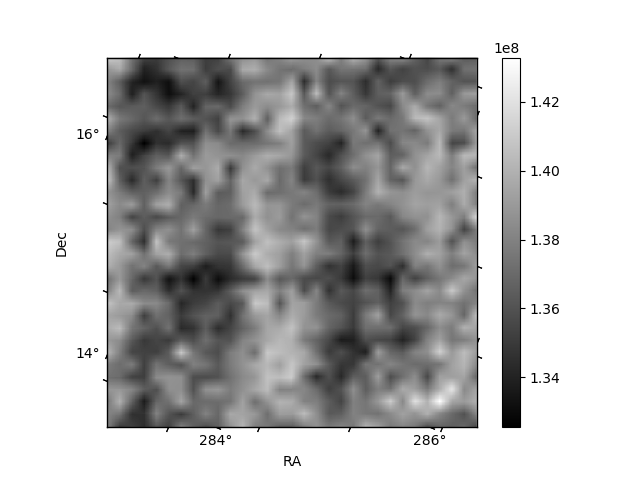
Histogram calculated using DETX and DETY for each event in the final _common_clean file
| Quadrant A | 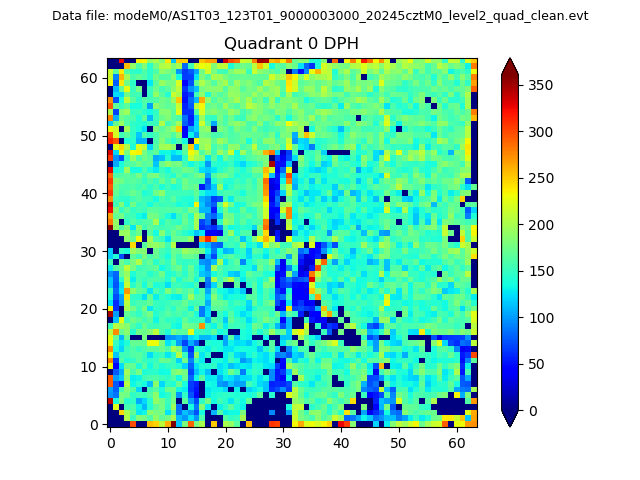 |
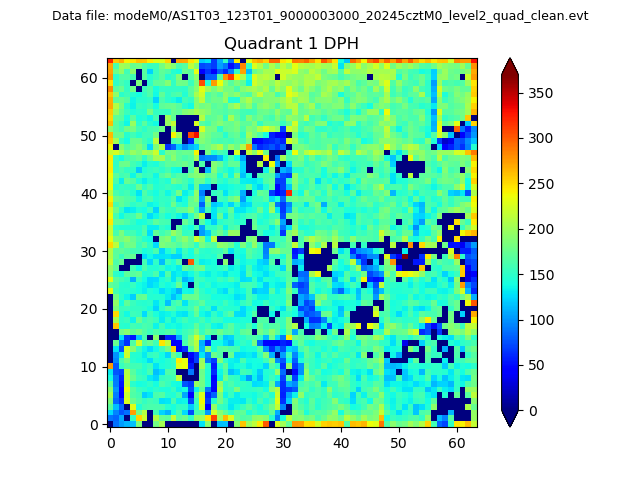 |
Quadrant B |
|---|---|---|---|
| Quadrant D | 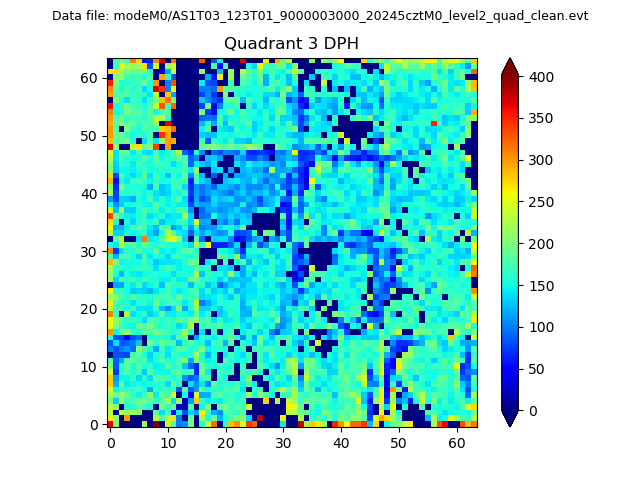 |
 |
Quadrant C |
| Plot type | Count rate plots | Images |
|---|---|---|
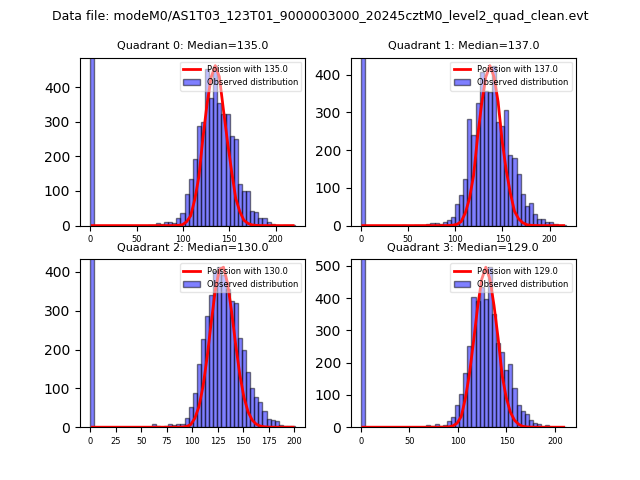
| Comparison with Poisson distribution Blue bars denote a histogram of data divided into 1 sec bins. Red curve is a Poisson curve with rate = median count rate of data. |
 |
 |
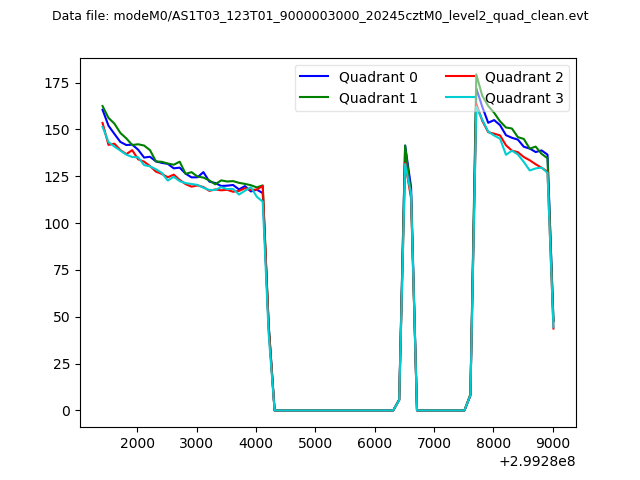
| Quadrant-wise count rates Data is divided into 100 sec bins |
 |
|
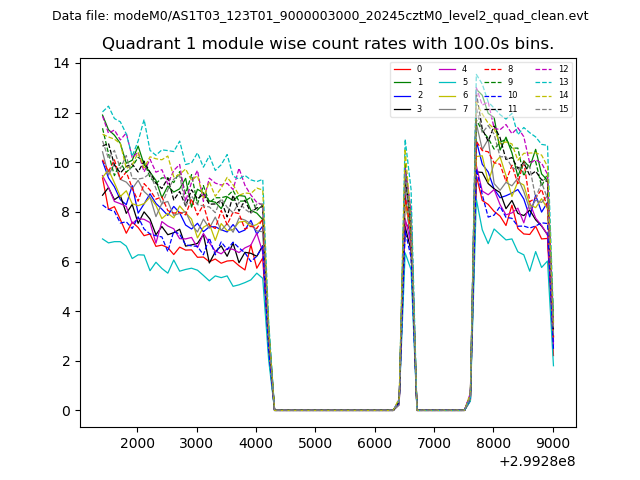
| Module-wise count rates for Quadrant A Data is divided into 100 sec bins |
 |
 |
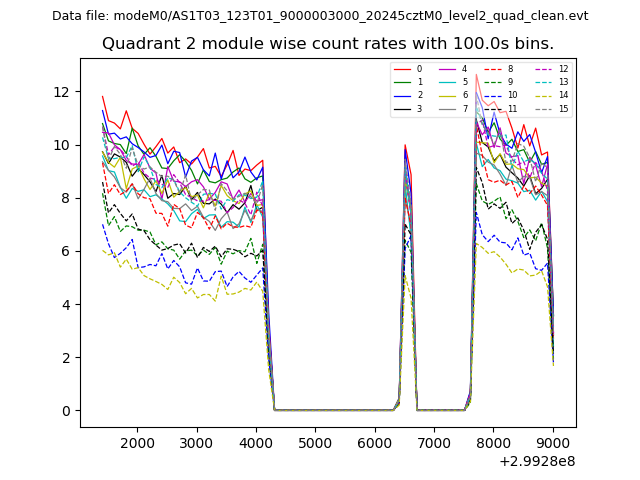
| Module-wise count rates for Quadrant B Data is divided into 100 sec bins |
 |
 |
| Module-wise count rates for Quadrant C Data is divided into 100 sec bins |
 |
 |
| Module-wise count rates for Quadrant D Data is divided into 100 sec bins |
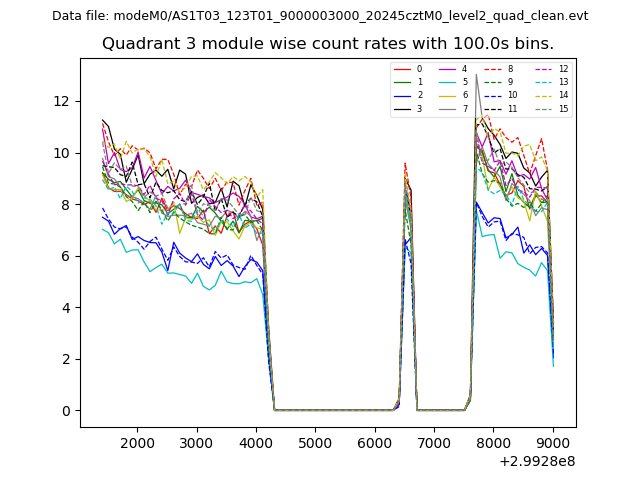 |
 |
| Parameter | Plot |
|---|---|
| CZT HV Monitor | 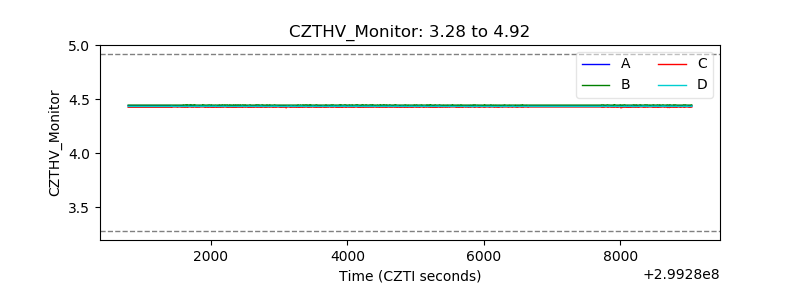 |
| D_VDD | 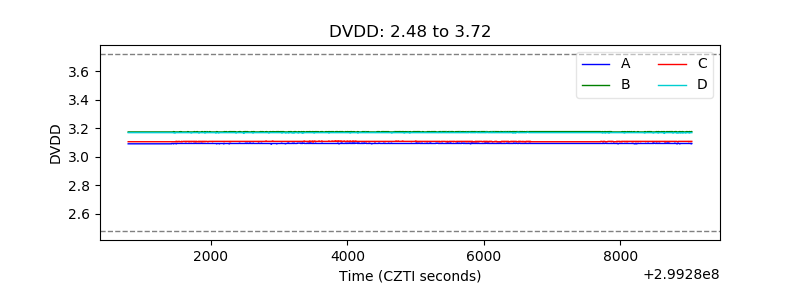 |
| Temperature 1 | 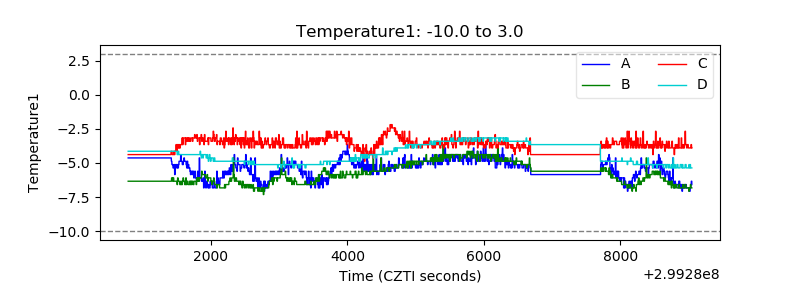 |
| Veto HV Monitor | 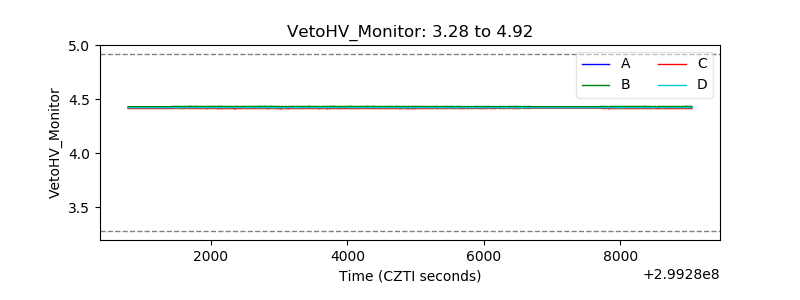 |
| Veto LLD | 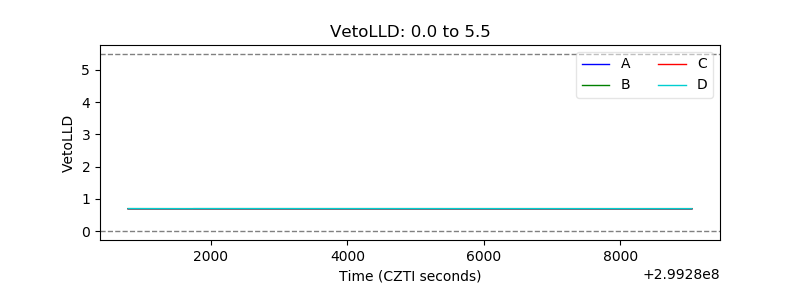 |
| Alpha Counter | 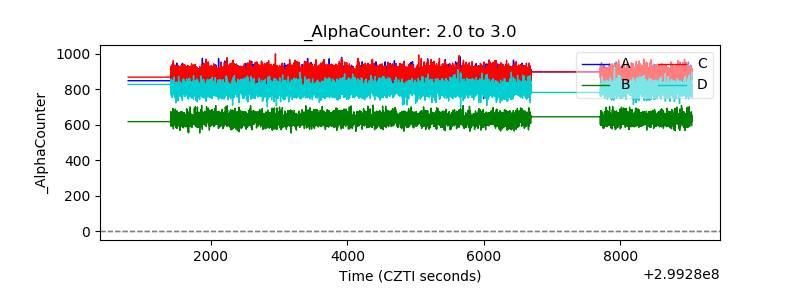 |
| _CPM_Rate | 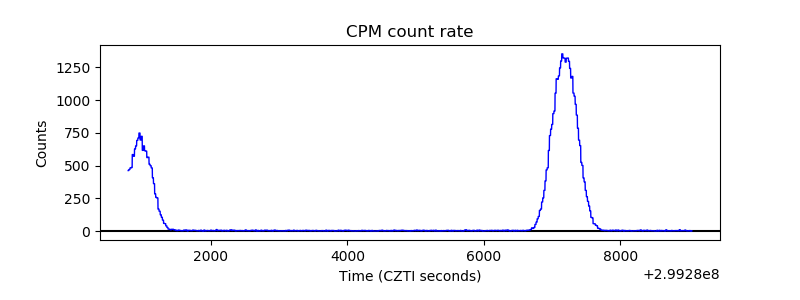 |
| CZT Counter | 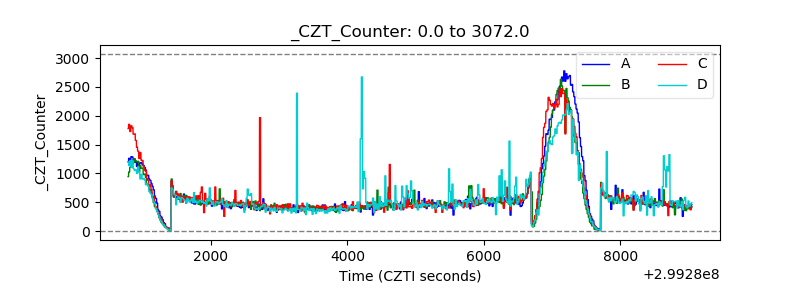 |
| +2.5 Volts monitor |  |
| +5 Volts monitor |  |
| _ROLL_ROT |  |
| _Roll_DEC | 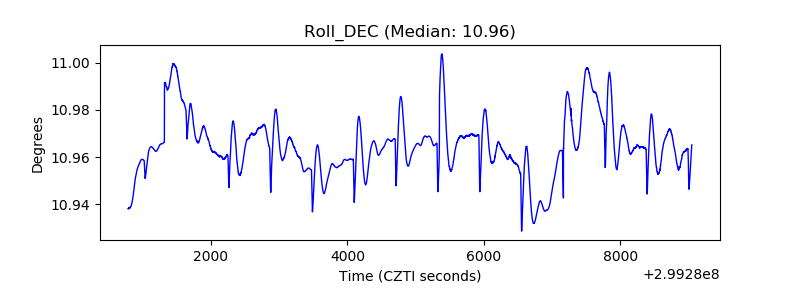 |
| _Roll_RA | 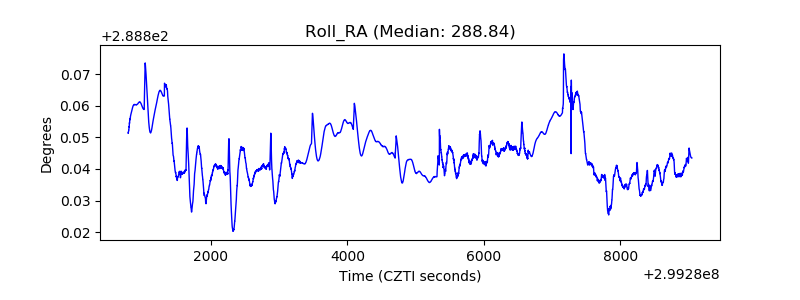 |
| Veto Counter |  |