| Param | Original file | Final file |
|---|---|---|
| Filename | modeM0/AS1T03_123T01_9000003000_20247cztM0_level2.evt | modeM0/AS1T03_123T01_9000003000_20247cztM0_level2_quad_clean.evt |
| Size (bytes) | 475,787,520 | 96,667,200 |
| Size | 453.7 MB | 92.2 MB |
| Events in quadrant A | 3,251,102 | 631,186 |
| Events in quadrant B | 3,260,886 | 643,588 |
| Events in quadrant C | 3,255,148 | 601,658 |
| Events in quadrant D | 4,193,883 | 590,857 |
| Mode M9 | |||
|---|---|---|---|
| Quadrant | BADHDUFLAG | Total packets | Discarded packets |
| A | 0 | 22 | 0 |
| B | 0 | 22 | 0 |
| C | 0 | 22 | 0 |
| D | 0 | 22 | 0 |
| Mode SS | |||
|---|---|---|---|
| Quadrant | BADHDUFLAG | Total packets | Discarded packets |
| A | 0 | 136 | 0 |
| B | 0 | 136 | 0 |
| C | 0 | 136 | 0 |
| D | 0 | 136 | 0 |
| Mode M0 | |||
|---|---|---|---|
| Quadrant | BADHDUFLAG | Total packets | Discarded packets |
| A | 0 | 13832 | 2 |
| B | 0 | 13794 | 2 |
| C | 0 | 13889 | 2 |
| D | 0 | 16823 | 2 |
| Quadrant | Total seconds | Saturated seconds | Saturation percentage |
|---|---|---|---|
| A | 6601 | 58 | 0.878655% |
| B | 6601 | 73 | 1.105893% |
| C | 6601 | 95 | 1.439176% |
| D | 6601 | 196 | 2.969247% |
Noise dominated data is calculated using 1-second bins in cleaned event files. If a bin has >2000 counts, and if more than 50% of those come from <1% of pixels, then it is considered to be noise-dominated and hence unusable.
| Quadrant | # 1 sec bins | Bins with >0 counts | Bins with >2000 counts | High rate bins dominated by noise | Noise dominated (total time) | Noise dominated (detector-on time) | Marked lightcurve |
|---|---|---|---|---|---|---|---|
| A | 8771 | 6603 | 7 | 7 | 0.08% | 0.11% | 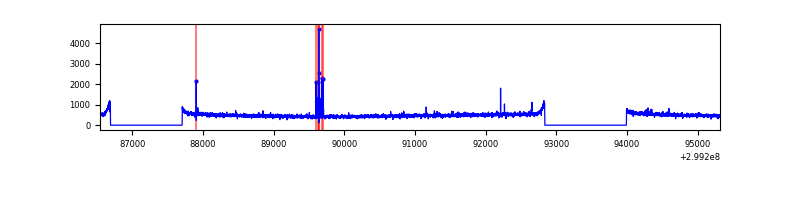 |
| B | 8771 | 6603 | 0 | 0 | 0.00% | 0.00% | 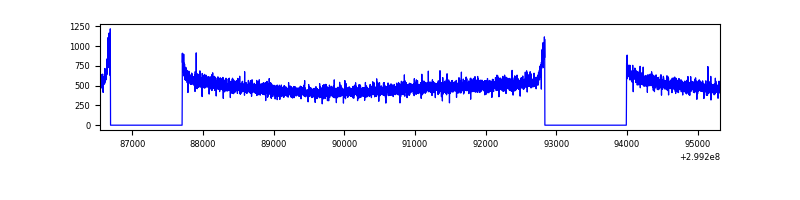 |
| C | 8771 | 6603 | 1 | 1 | 0.01% | 0.02% | 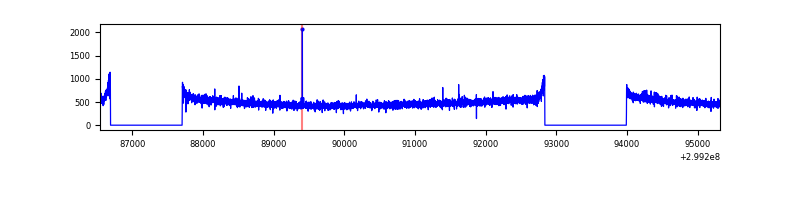 |
| D | 8771 | 6603 | 176 | 176 | 2.01% | 2.67% | 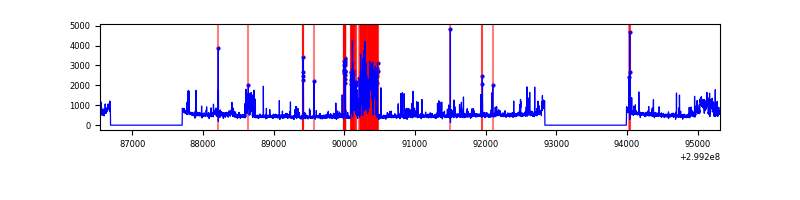 |
Top three noisy pixels from each quadrant. If the there are fewer than three noisy pixels in the level2.evt file, extra rows are filled as -1
| Pixel properties | Quadrant properties | ||||||
|---|---|---|---|---|---|---|---|
| Quadrant | DetID | PixID | Counts | Sigma | Mean | Median | Sigma |
| A | 15 | 191 | 25361 | 146.95 | 836 | 822 | 167.0 |
| A | 12 | 96 | 10371 | 57.18 | 836 | 822 | 167.0 |
| A | 0 | 226 | 7145 | 37.87 | 836 | 822 | 167.0 |
| B | 12 | 111 | 19601 | 119.01 | 831 | 811 | 157.9 |
| B | 11 | 111 | 17566 | 106.12 | 831 | 811 | 157.9 |
| B | 14 | 111 | 16454 | 99.08 | 831 | 811 | 157.9 |
| C | 14 | 238 | 125416 | 667.48 | 796 | 802 | 186.7 |
| C | 1 | 16 | 7213 | 34.34 | 796 | 802 | 186.7 |
| C | 3 | 233 | 7192 | 34.23 | 796 | 802 | 186.7 |
| D | 1 | 52 | 1115381 | 5733.51 | 803 | 783 | 194.4 |
| D | 2 | 184 | 37511 | 188.93 | 803 | 783 | 194.4 |
| D | 2 | 234 | 28793 | 144.08 | 803 | 783 | 194.4 |
Histogram calculated using DETX and DETY for each event in the final _common_clean file
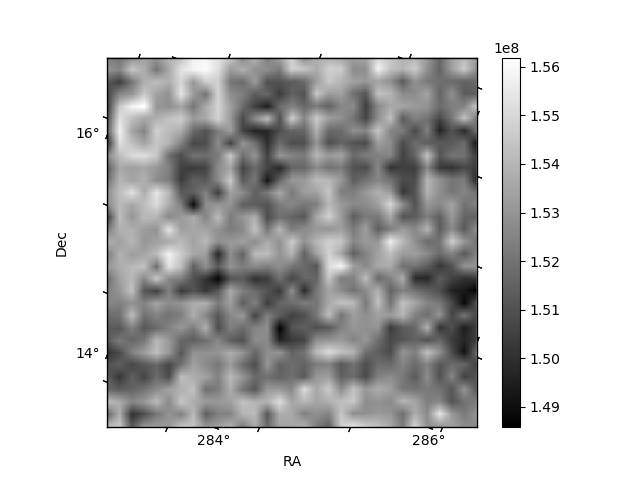
| Quadrant A |  |
 |
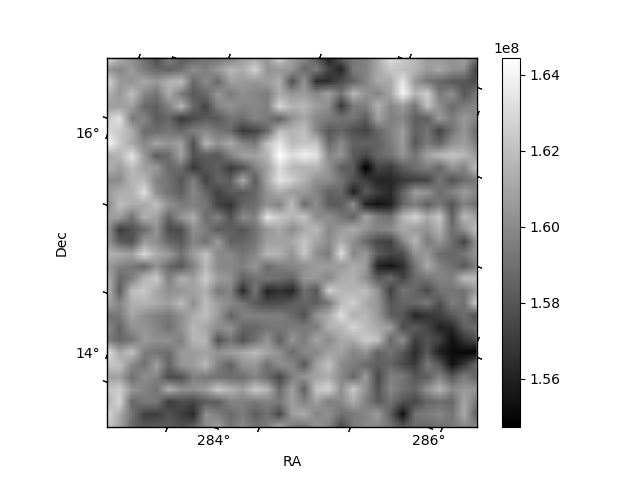
Quadrant B |
|---|---|---|---|
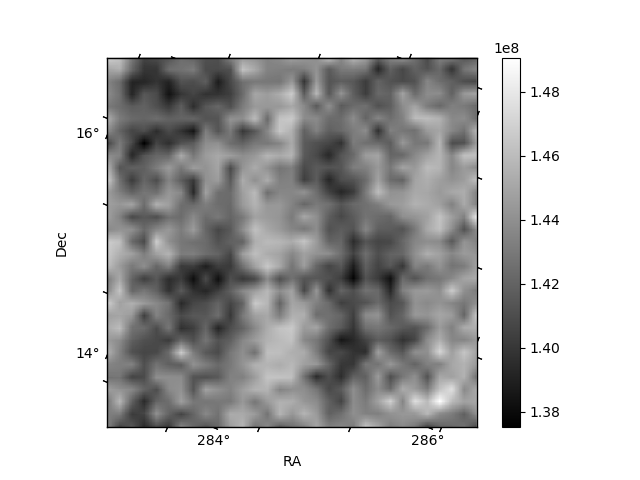
| Quadrant D |  |
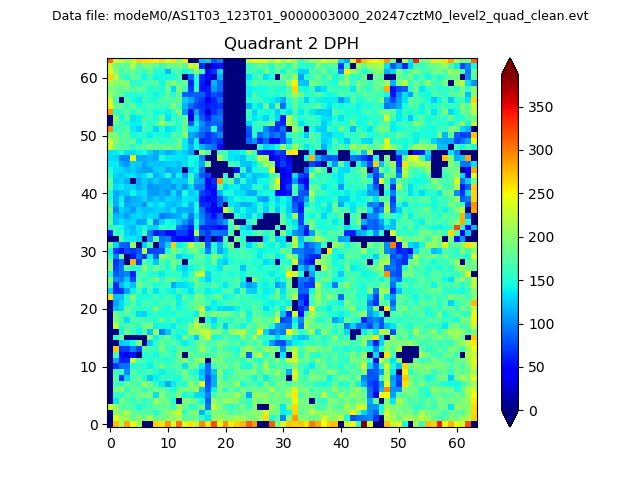 |
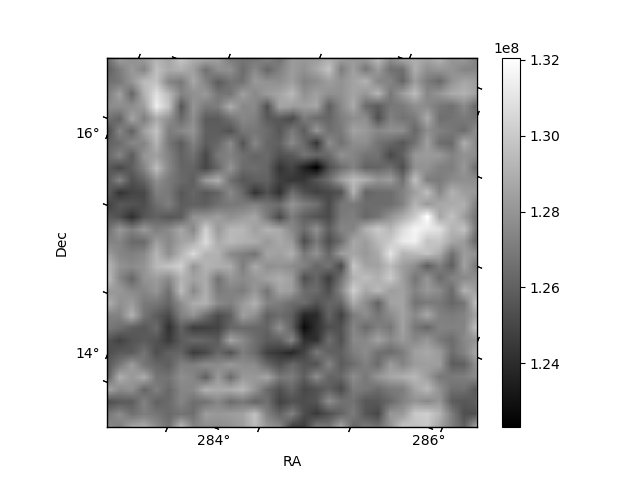
Quadrant C |
| Plot type | Count rate plots | Images |
|---|---|---|
| Comparison with Poisson distribution Blue bars denote a histogram of data divided into 1 sec bins. Red curve is a Poisson curve with rate = median count rate of data. |
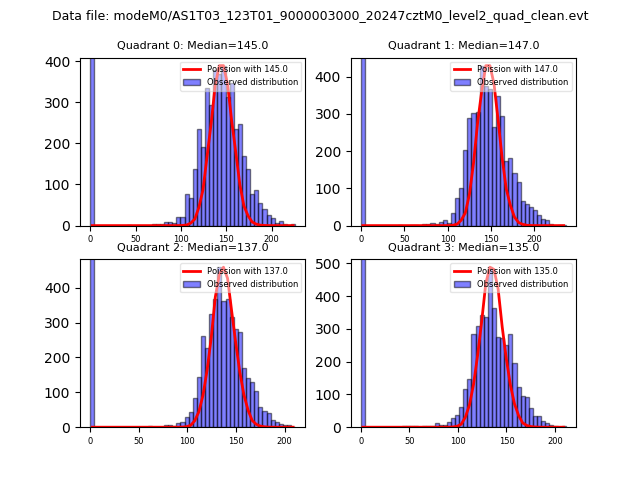 |
 |
| Quadrant-wise count rates Data is divided into 100 sec bins |
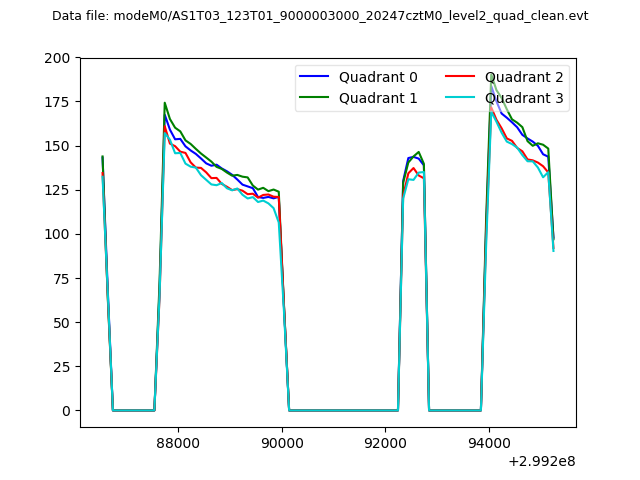 |
|
| Module-wise count rates for Quadrant A Data is divided into 100 sec bins |
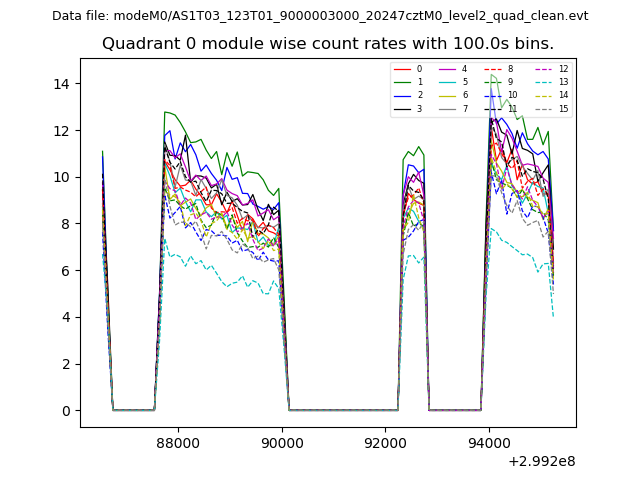 |
 |
| Module-wise count rates for Quadrant B Data is divided into 100 sec bins |
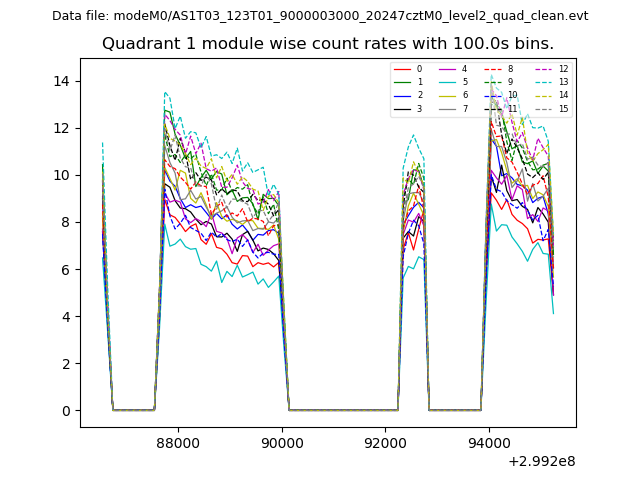 |
 |
| Module-wise count rates for Quadrant C Data is divided into 100 sec bins |
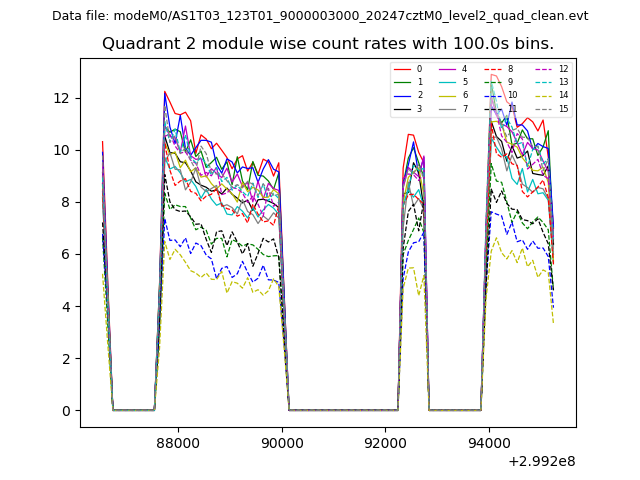 |
 |
| Module-wise count rates for Quadrant D Data is divided into 100 sec bins |
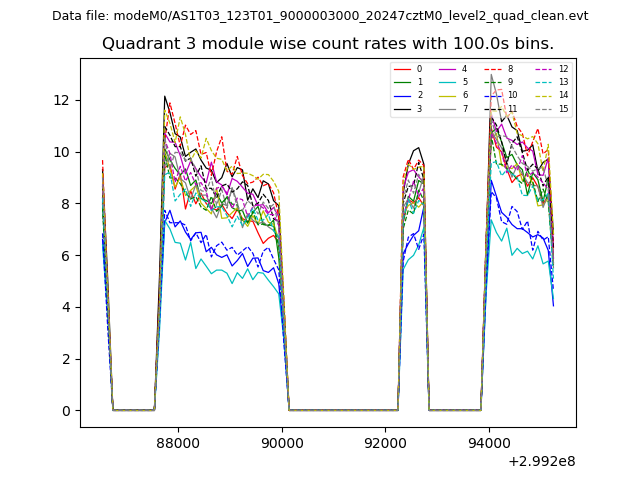 |
 |
| Parameter | Plot |
|---|---|
| CZT HV Monitor | 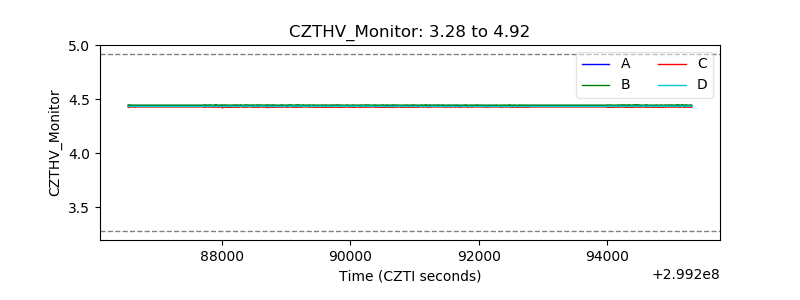 |
| D_VDD | 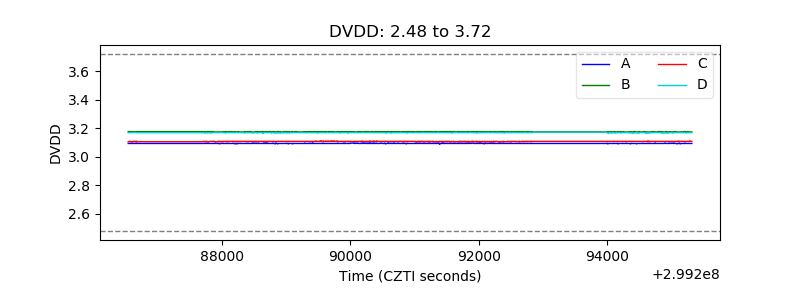 |
| Temperature 1 | 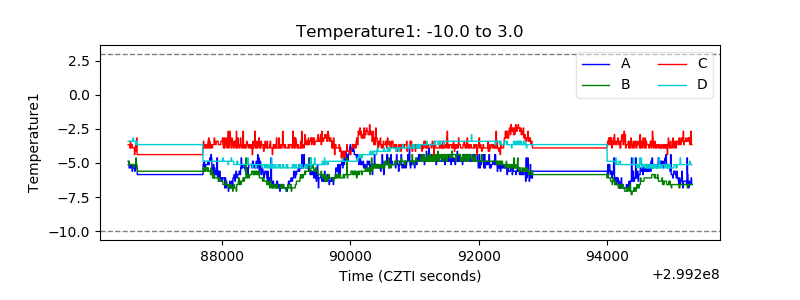 |
| Veto HV Monitor | 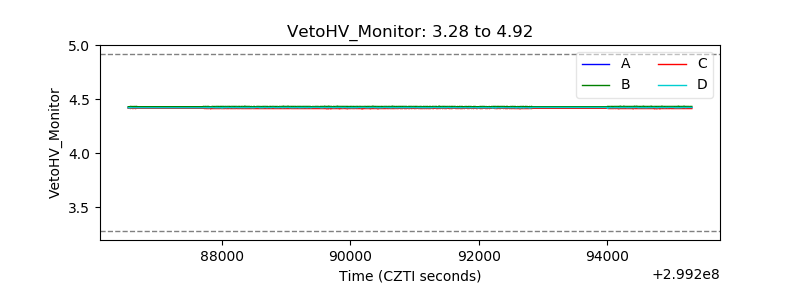 |
| Veto LLD |  |
| Alpha Counter | 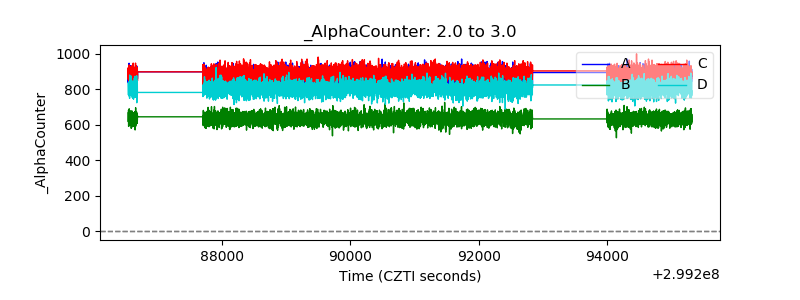 |
| _CPM_Rate | 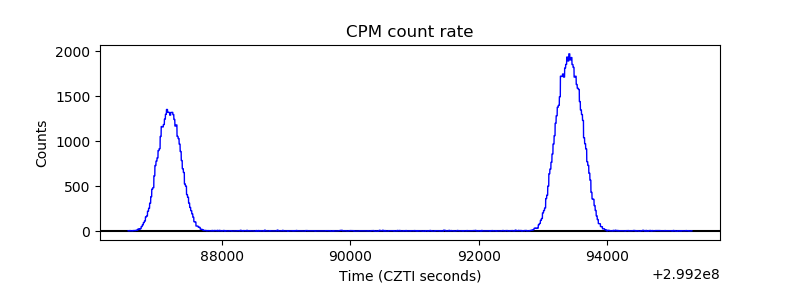 |
| CZT Counter | 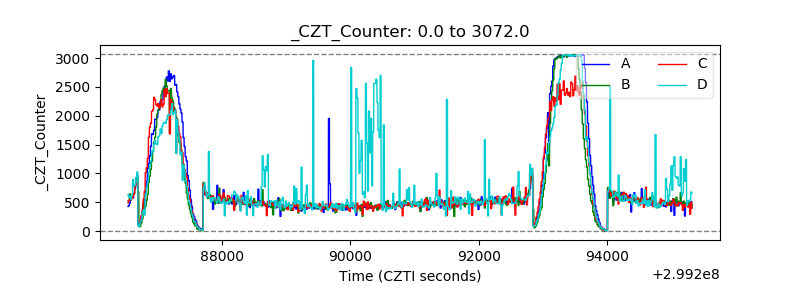 |
| +2.5 Volts monitor |  |
| +5 Volts monitor | 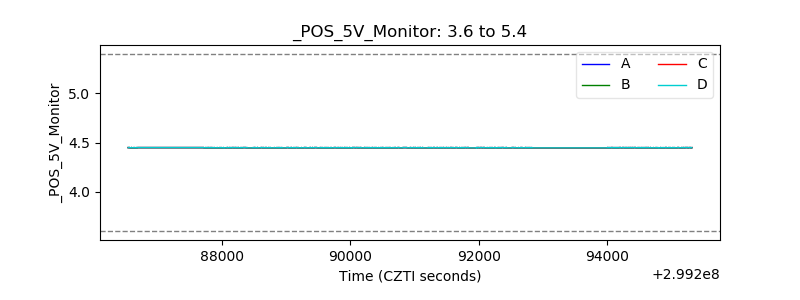 |
| _ROLL_ROT | 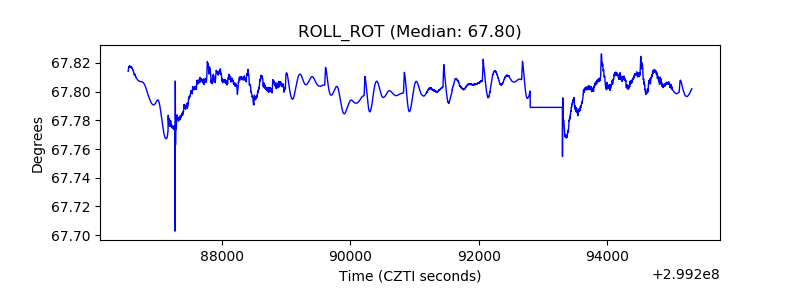 |
| _Roll_DEC | 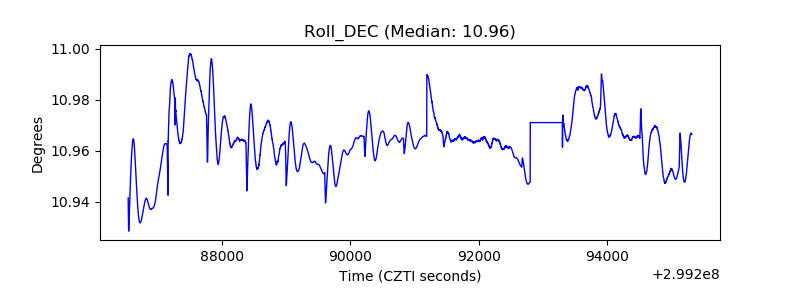 |
| _Roll_RA | 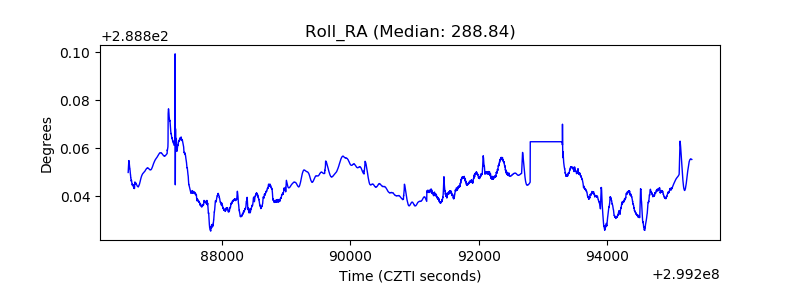 |
| Veto Counter | 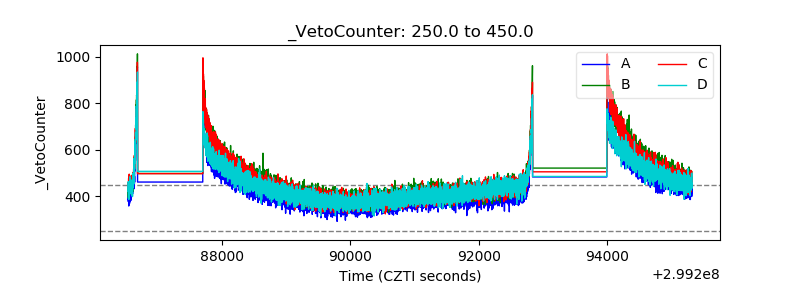 |