| Param | Original file | Final file |
|---|---|---|
| Filename | modeM0/AS1T03_123T01_9000003000_20248cztM0_level2.evt | modeM0/AS1T03_123T01_9000003000_20248cztM0_level2_quad_clean.evt |
| Size (bytes) | 572,702,400 | 95,016,960 |
| Size | 546.2 MB | 90.6 MB |
| Events in quadrant A | 3,284,108 | 632,584 |
| Events in quadrant B | 3,224,705 | 645,967 |
| Events in quadrant C | 3,177,868 | 594,414 |
| Events in quadrant D | 7,230,898 | 564,899 |
| Mode M9 | |||
|---|---|---|---|
| Quadrant | BADHDUFLAG | Total packets | Discarded packets |
| A | 0 | 18 | 0 |
| B | 0 | 19 | 0 |
| C | 0 | 19 | 0 |
| D | 0 | 19 | 0 |
| Mode SS | |||
|---|---|---|---|
| Quadrant | BADHDUFLAG | Total packets | Discarded packets |
| A | 0 | 128 | 0 |
| B | 0 | 128 | 0 |
| C | 0 | 128 | 0 |
| D | 0 | 128 | 0 |
| Mode M0 | |||
|---|---|---|---|
| Quadrant | BADHDUFLAG | Total packets | Discarded packets |
| A | 0 | 13561 | 2 |
| B | 0 | 13365 | 2 |
| C | 0 | 13326 | 2 |
| D | 0 | 25746 | 2 |
| Quadrant | Total seconds | Saturated seconds | Saturation percentage |
|---|---|---|---|
| A | 6299 | 55 | 0.873154% |
| B | 6299 | 71 | 1.127163% |
| C | 6298 | 97 | 1.540171% |
| D | 6298 | 1070 | 16.989520% |
Noise dominated data is calculated using 1-second bins in cleaned event files. If a bin has >2000 counts, and if more than 50% of those come from <1% of pixels, then it is considered to be noise-dominated and hence unusable.
| Quadrant | # 1 sec bins | Bins with >0 counts | Bins with >2000 counts | High rate bins dominated by noise | Noise dominated (total time) | Noise dominated (detector-on time) | Marked lightcurve |
|---|---|---|---|---|---|---|---|
| A | 7514 | 6300 | 0 | 0 | 0.00% | 0.00% | 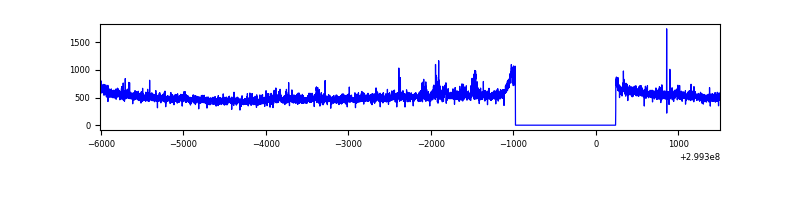 |
| B | 7514 | 6300 | 0 | 0 | 0.00% | 0.00% | 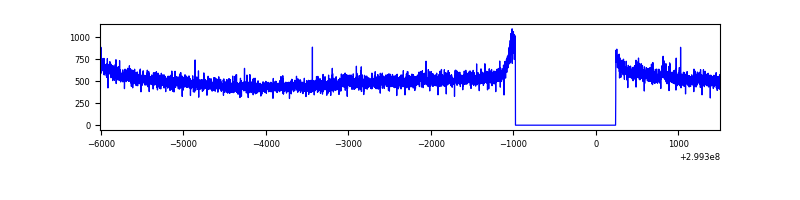 |
| C | 7513 | 6299 | 0 | 0 | 0.00% | 0.00% | 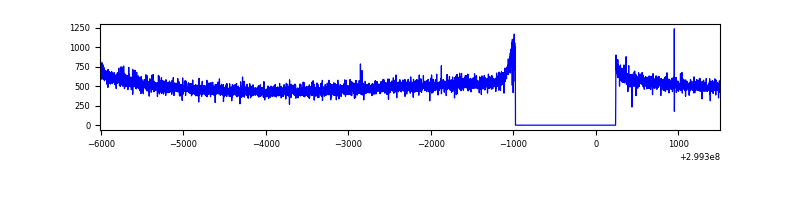 |
| D | 7513 | 6299 | 1433 | 1433 | 19.07% | 22.75% | 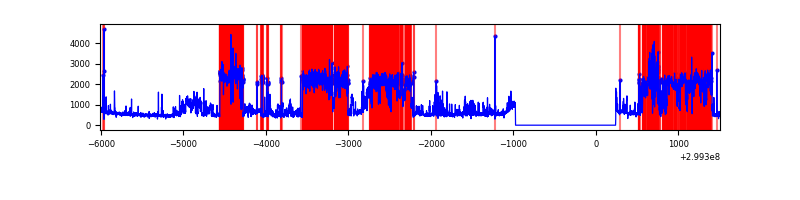 |
Top three noisy pixels from each quadrant. If the there are fewer than three noisy pixels in the level2.evt file, extra rows are filled as -1
| Pixel properties | Quadrant properties | ||||||
|---|---|---|---|---|---|---|---|
| Quadrant | DetID | PixID | Counts | Sigma | Mean | Median | Sigma |
| A | 10 | 253 | 97834 | 590.32 | 828 | 814 | 164.4 |
| A | 0 | 226 | 7252 | 39.17 | 828 | 814 | 164.4 |
| A | 3 | 137 | 6496 | 34.57 | 828 | 814 | 164.4 |
| B | 12 | 111 | 19046 | 117.97 | 821 | 804 | 154.6 |
| B | 11 | 111 | 16891 | 104.04 | 821 | 804 | 154.6 |
| B | 14 | 111 | 15778 | 96.84 | 821 | 804 | 154.6 |
| C | 14 | 238 | 123265 | 678.07 | 778 | 787 | 180.6 |
| C | 1 | 16 | 9306 | 47.16 | 778 | 787 | 180.6 |
| C | 13 | 61 | 5496 | 26.07 | 778 | 787 | 180.6 |
| D | 1 | 52 | 4151095 | 22165.76 | 771 | 749 | 187.2 |
| D | 11 | 176 | 130093 | 690.79 | 771 | 749 | 187.2 |
| D | 2 | 184 | 29597 | 154.07 | 771 | 749 | 187.2 |
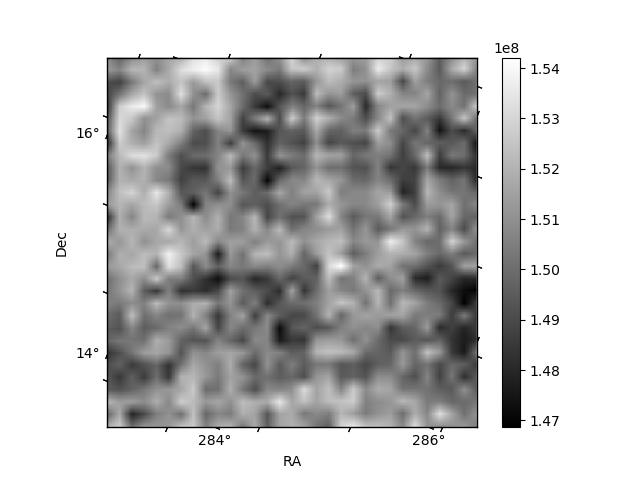
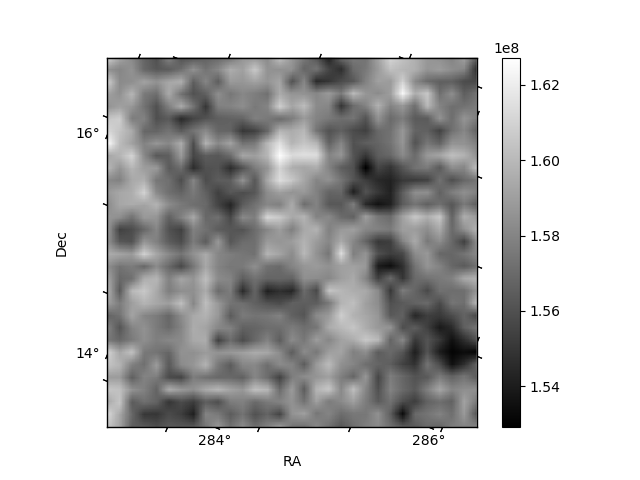
Histogram calculated using DETX and DETY for each event in the final _common_clean file
| Quadrant A |  |
 |
Quadrant B |
|---|---|---|---|
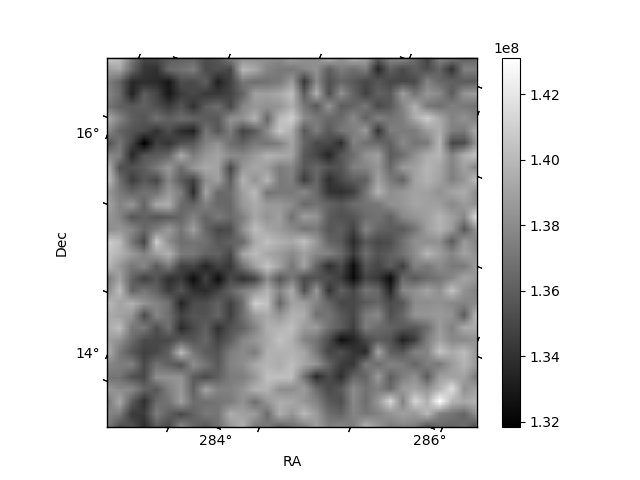
| Quadrant D | 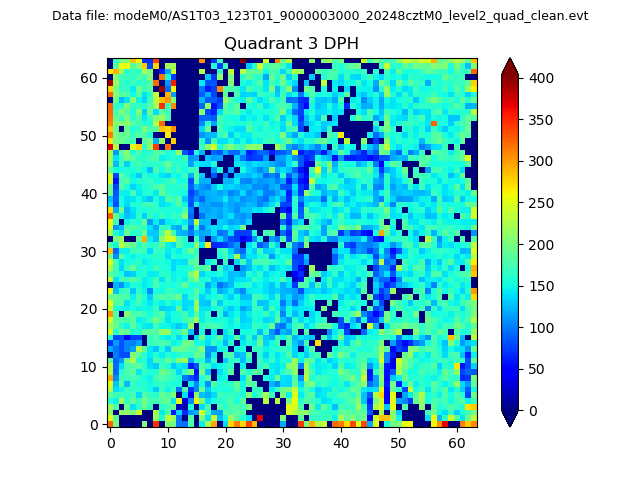 |
 |
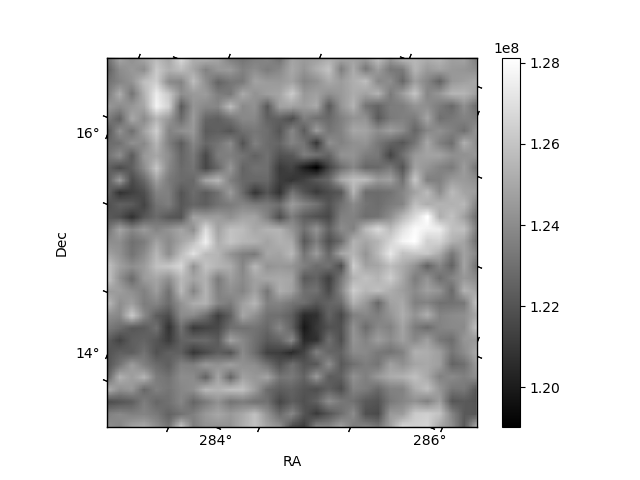
Quadrant C |
| Plot type | Count rate plots | Images |
|---|---|---|
| Comparison with Poisson distribution Blue bars denote a histogram of data divided into 1 sec bins. Red curve is a Poisson curve with rate = median count rate of data. |
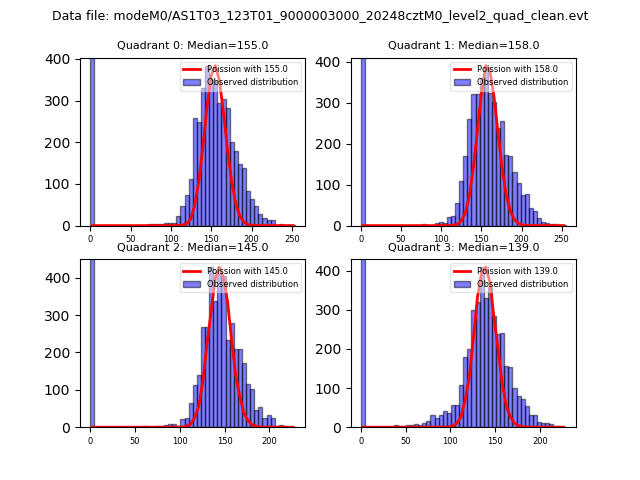 |
 |
| Quadrant-wise count rates Data is divided into 100 sec bins |
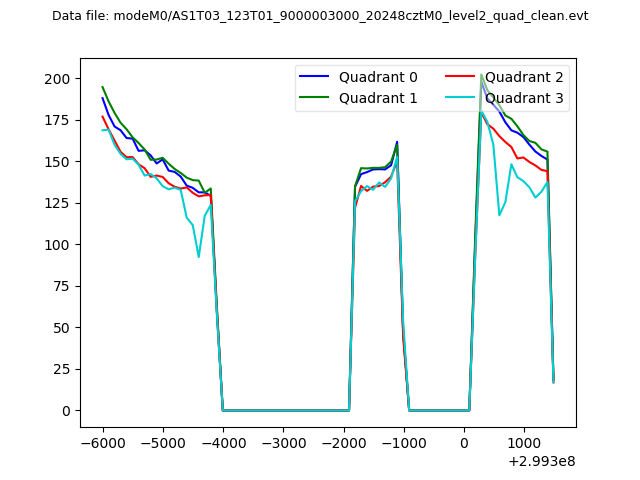 |
|
| Module-wise count rates for Quadrant A Data is divided into 100 sec bins |
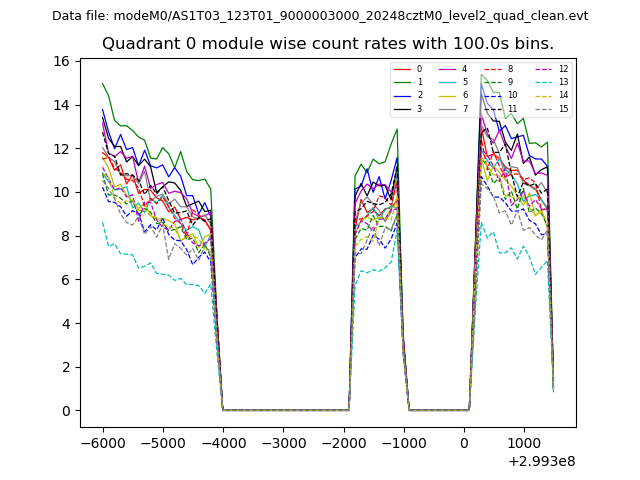 |
 |
| Module-wise count rates for Quadrant B Data is divided into 100 sec bins |
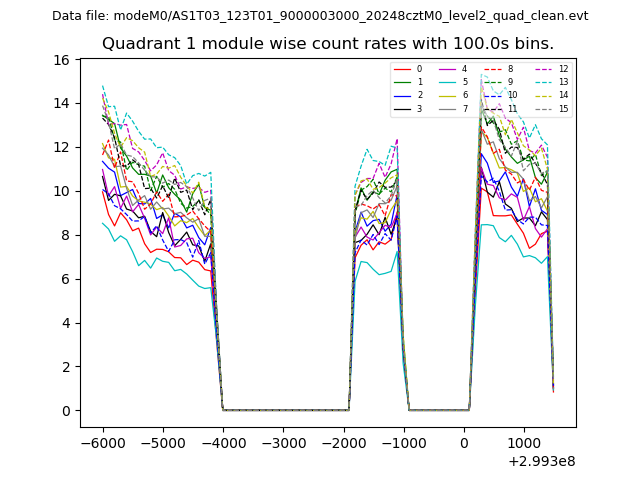 |
 |
| Module-wise count rates for Quadrant C Data is divided into 100 sec bins |
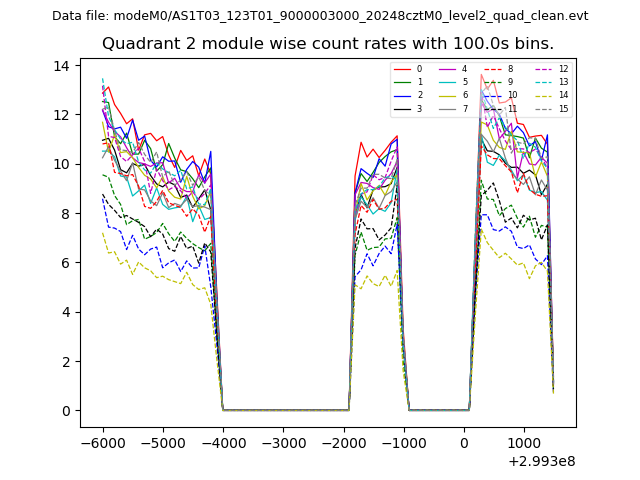 |
 |
| Module-wise count rates for Quadrant D Data is divided into 100 sec bins |
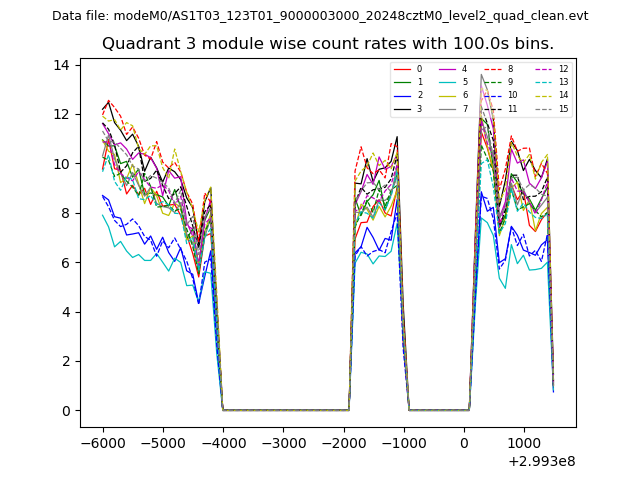 |
 |
| Parameter | Plot |
|---|---|
| CZT HV Monitor | 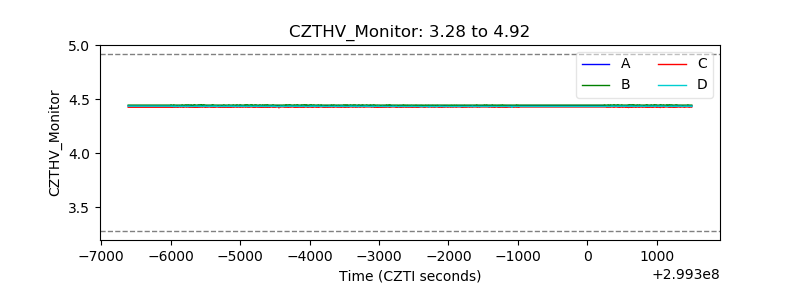 |
| D_VDD | 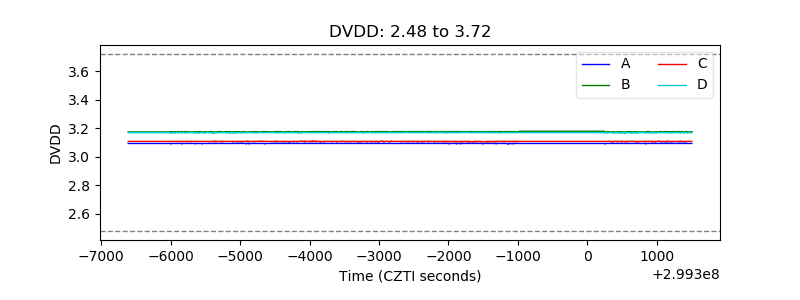 |
| Temperature 1 |  |
| Veto HV Monitor | 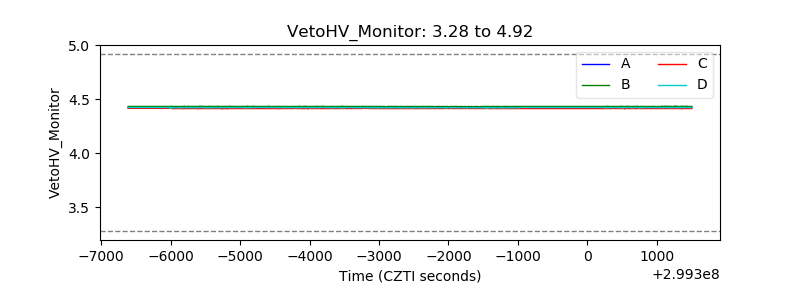 |
| Veto LLD | 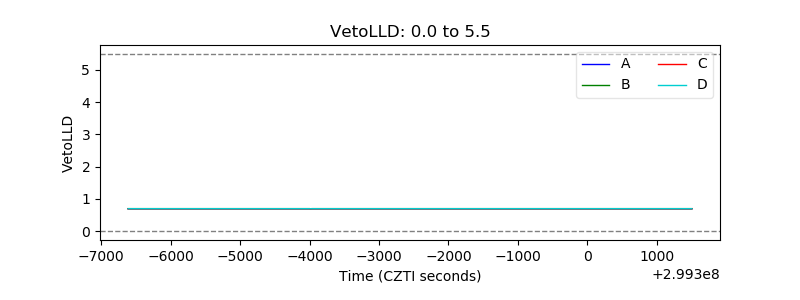 |
| Alpha Counter | 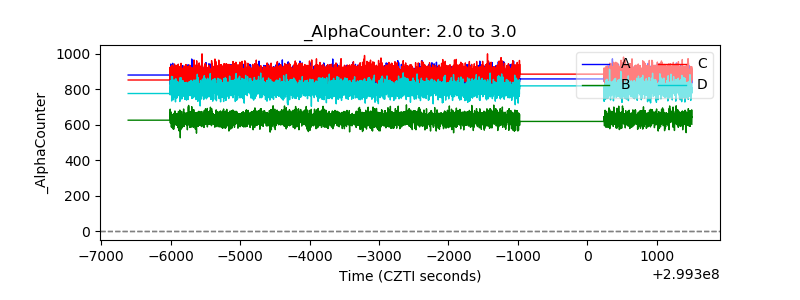 |
| _CPM_Rate | 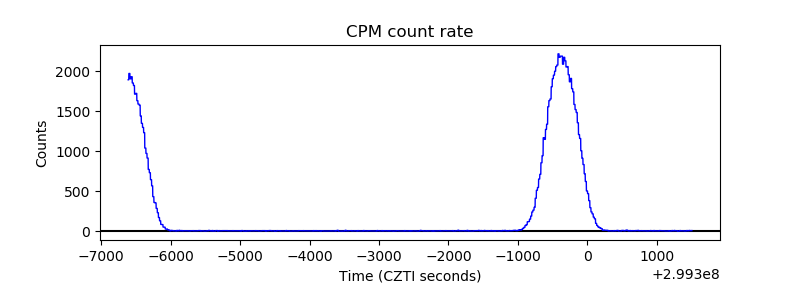 |
| CZT Counter |  |
| +2.5 Volts monitor |  |
| +5 Volts monitor | 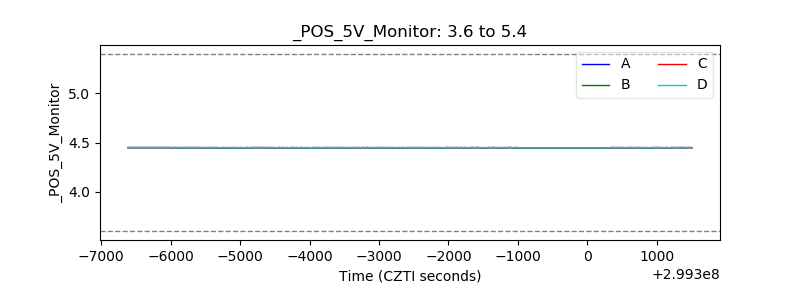 |
| _ROLL_ROT | 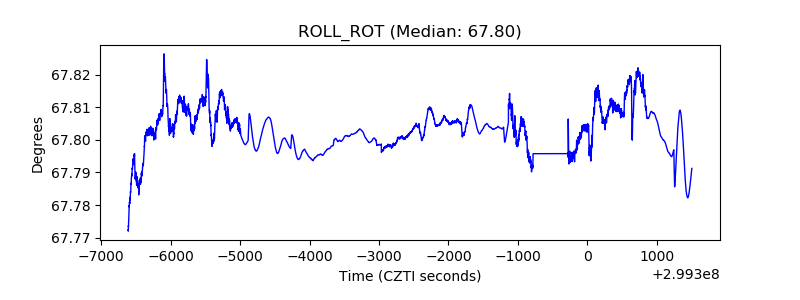 |
| _Roll_DEC | 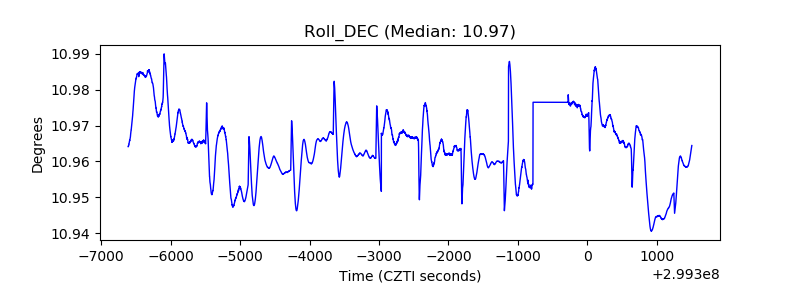 |
| _Roll_RA | 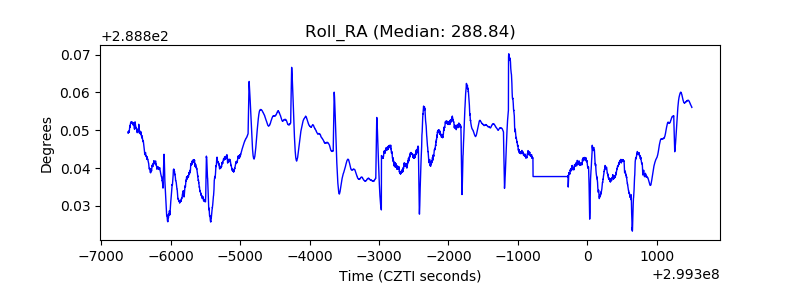 |
| Veto Counter | 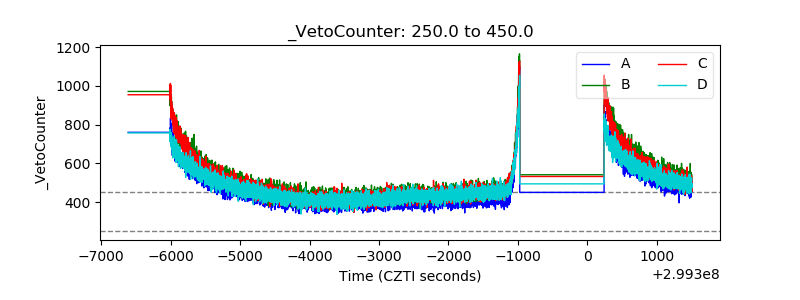 |