| Param | Original file | Final file |
|---|---|---|
| Filename | modeM0/AS1T03_123T01_9000003000_20250cztM0_level2.evt | modeM0/AS1T03_123T01_9000003000_20250cztM0_level2_quad_clean.evt |
| Size (bytes) | 317,280,960 | 54,221,760 |
| Size | 302.6 MB | 51.7 MB |
| Events in quadrant A | 2,294,861 | 345,050 |
| Events in quadrant B | 2,252,721 | 353,238 |
| Events in quadrant C | 2,224,622 | 321,286 |
| Events in quadrant D | 2,539,302 | 315,135 |
| Mode M9 | |||
|---|---|---|---|
| Quadrant | BADHDUFLAG | Total packets | Discarded packets |
| A | 0 | 2 | 0 |
| B | 0 | 3 | 0 |
| C | 0 | 3 | 0 |
| D | 0 | 3 | 0 |
| Mode SS | |||
|---|---|---|---|
| Quadrant | BADHDUFLAG | Total packets | Discarded packets |
| A | 0 | 88 | 0 |
| B | 0 | 88 | 0 |
| C | 0 | 88 | 0 |
| D | 0 | 88 | 0 |
| Mode M0 | |||
|---|---|---|---|
| Quadrant | BADHDUFLAG | Total packets | Discarded packets |
| A | 0 | 9279 | 1 |
| B | 0 | 9131 | 1 |
| C | 0 | 9075 | 1 |
| D | 0 | 10229 | 1 |
| Quadrant | Total seconds | Saturated seconds | Saturation percentage |
|---|---|---|---|
| A | 4359 | 23 | 0.527644% |
| B | 4359 | 27 | 0.619408% |
| C | 4359 | 29 | 0.665290% |
| D | 4359 | 51 | 1.169993% |
Noise dominated data is calculated using 1-second bins in cleaned event files. If a bin has >2000 counts, and if more than 50% of those come from <1% of pixels, then it is considered to be noise-dominated and hence unusable.
| Quadrant | # 1 sec bins | Bins with >0 counts | Bins with >2000 counts | High rate bins dominated by noise | Noise dominated (total time) | Noise dominated (detector-on time) | Marked lightcurve |
|---|---|---|---|---|---|---|---|
| A | 4359 | 4359 | 1 | 1 | 0.02% | 0.02% | 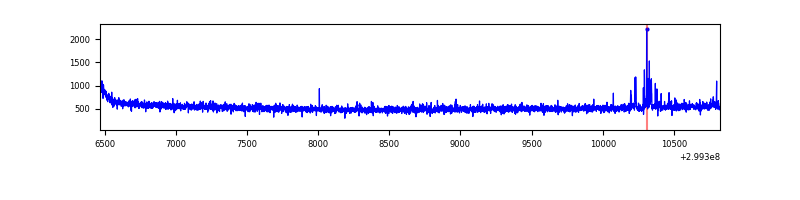 |
| B | 4359 | 4359 | 0 | 0 | 0.00% | 0.00% | 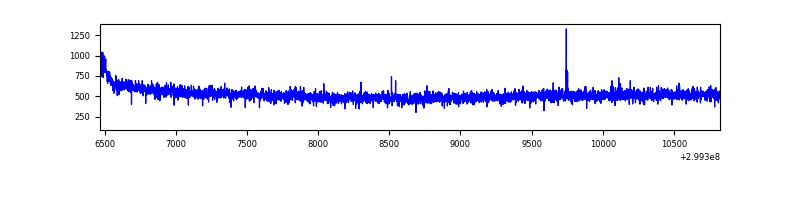 |
| C | 4359 | 4359 | 0 | 0 | 0.00% | 0.00% | 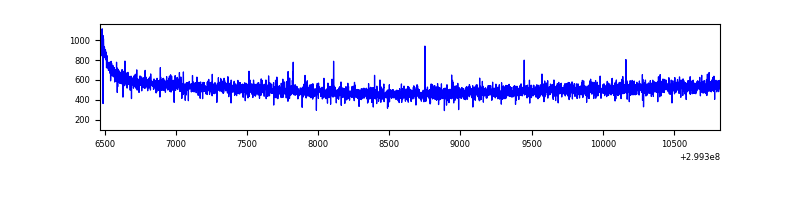 |
| D | 4359 | 4359 | 35 | 35 | 0.80% | 0.80% | 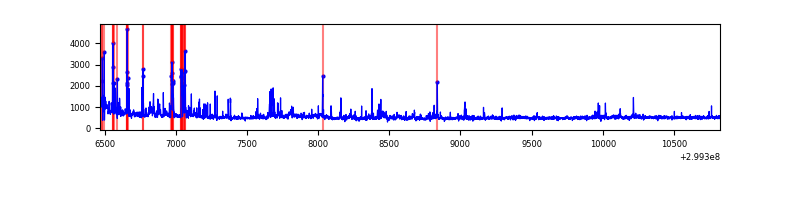 |
Top three noisy pixels from each quadrant. If the there are fewer than three noisy pixels in the level2.evt file, extra rows are filled as -1
| Pixel properties | Quadrant properties | ||||||
|---|---|---|---|---|---|---|---|
| Quadrant | DetID | PixID | Counts | Sigma | Mean | Median | Sigma |
| A | 10 | 253 | 19346 | 162.27 | 583 | 573 | 115.7 |
| A | 14 | 238 | 19102 | 160.16 | 583 | 573 | 115.7 |
| A | 4 | 2 | 11617 | 95.46 | 583 | 573 | 115.7 |
| B | 12 | 111 | 12806 | 112.22 | 576 | 564 | 109.1 |
| B | 11 | 111 | 11685 | 101.94 | 576 | 564 | 109.1 |
| B | 14 | 111 | 11031 | 95.95 | 576 | 564 | 109.1 |
| C | 14 | 238 | 87715 | 690.29 | 542 | 548 | 126.3 |
| C | 3 | 233 | 9425 | 70.3 | 542 | 548 | 126.3 |
| C | 1 | 16 | 7324 | 53.66 | 542 | 548 | 126.3 |
| D | 1 | 52 | 369389 | 2753.44 | 554 | 538 | 134.0 |
| D | 11 | 176 | 28083 | 205.62 | 554 | 538 | 134.0 |
| D | 2 | 16 | 22304 | 162.48 | 554 | 538 | 134.0 |
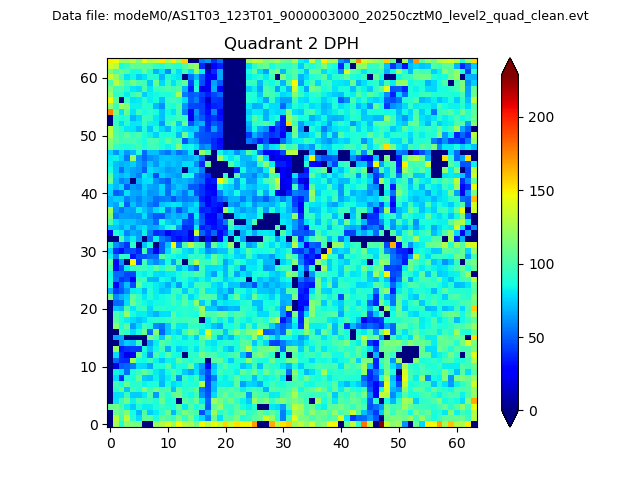
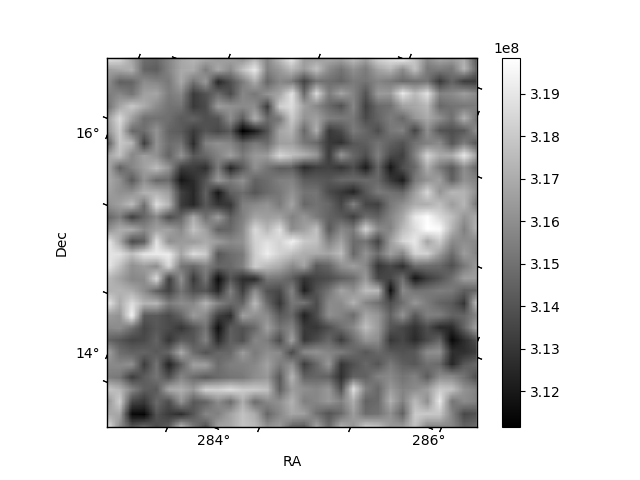
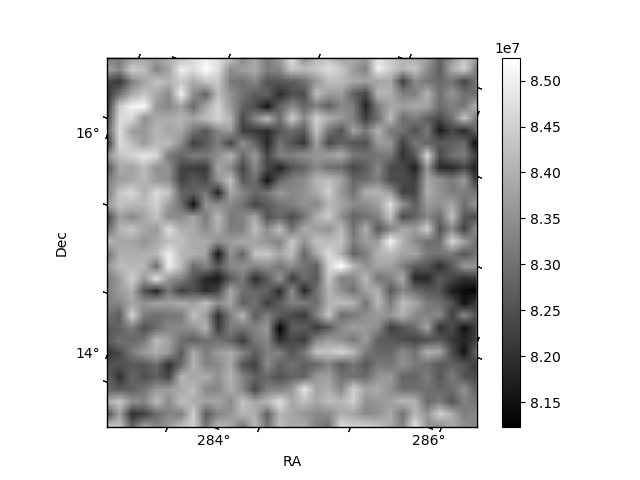
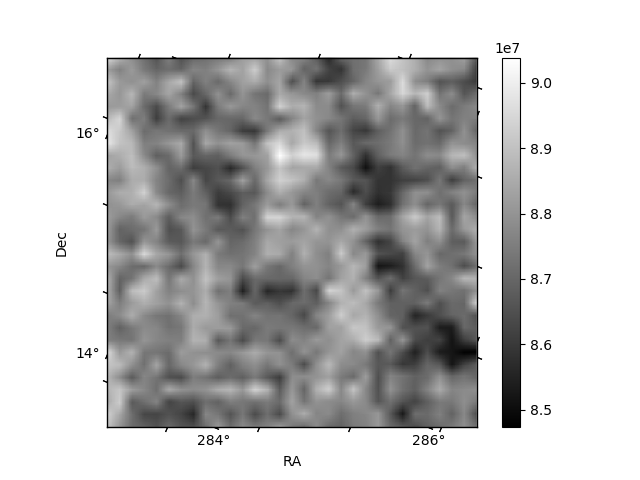
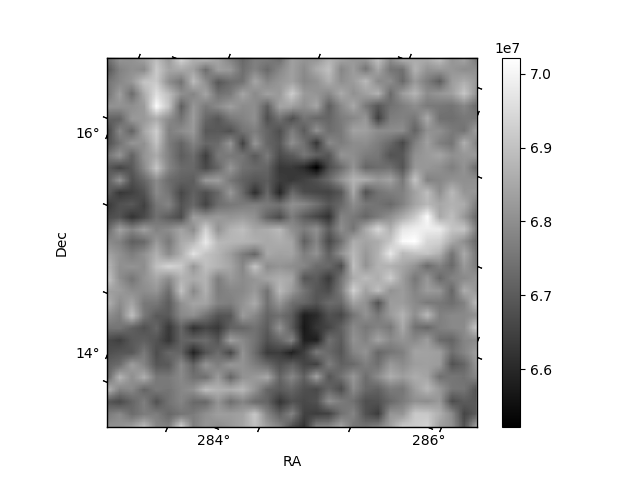
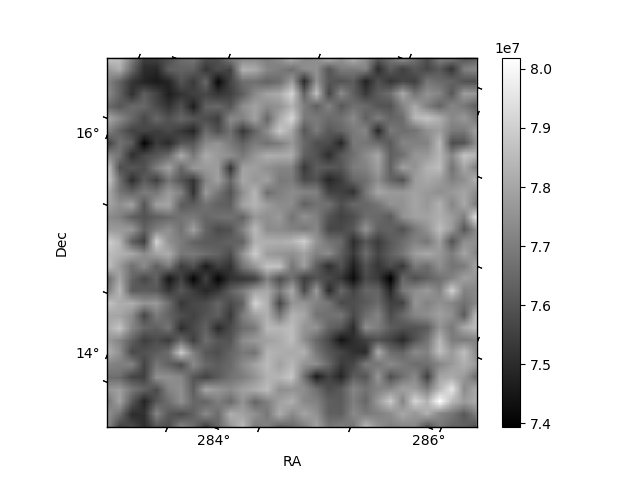
Histogram calculated using DETX and DETY for each event in the final _common_clean file
| Quadrant A | 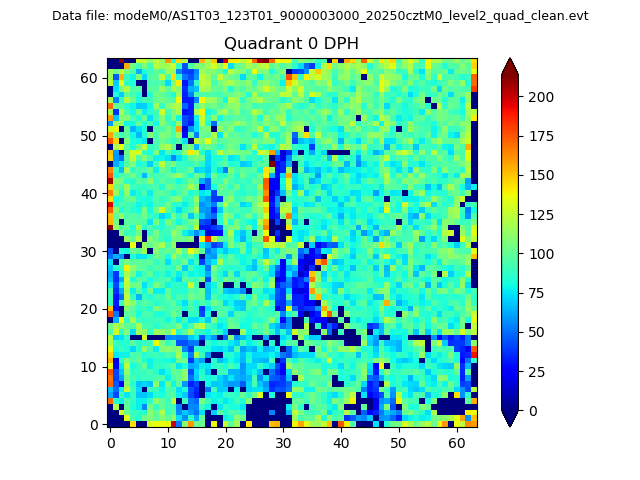 |
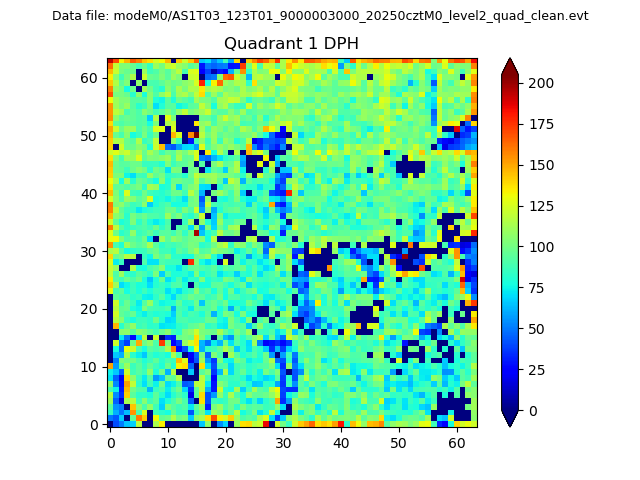 |
Quadrant B |
|---|---|---|---|
| Quadrant D | 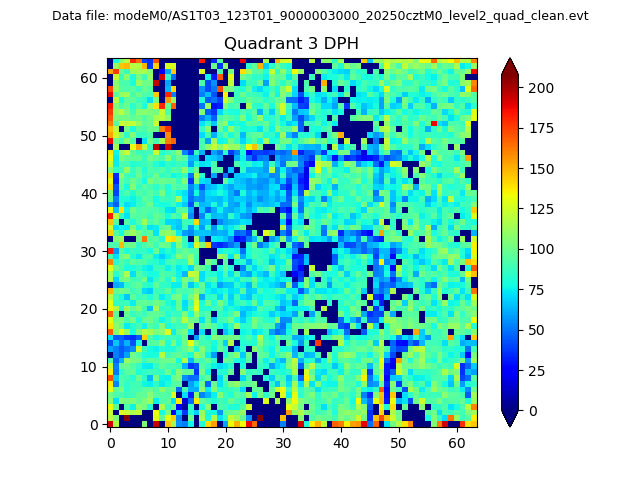 |
 |
Quadrant C |
| Plot type | Count rate plots | Images |
|---|---|---|
| Comparison with Poisson distribution Blue bars denote a histogram of data divided into 1 sec bins. Red curve is a Poisson curve with rate = median count rate of data. |
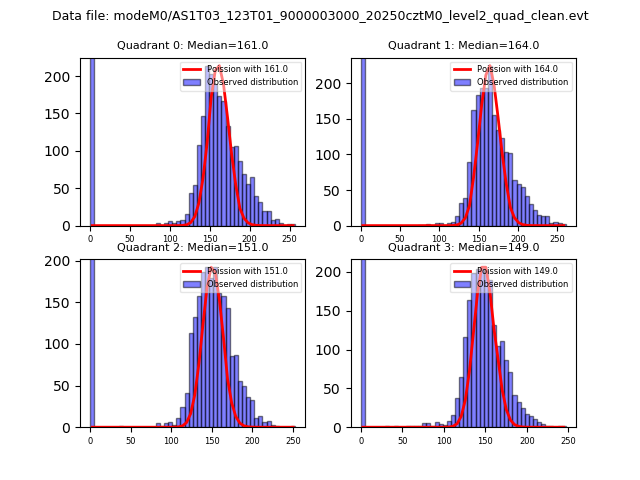 |
 |
| Quadrant-wise count rates Data is divided into 100 sec bins |
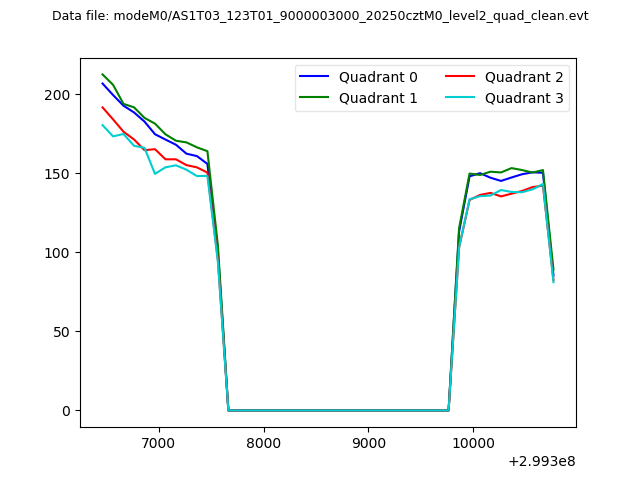 |
|
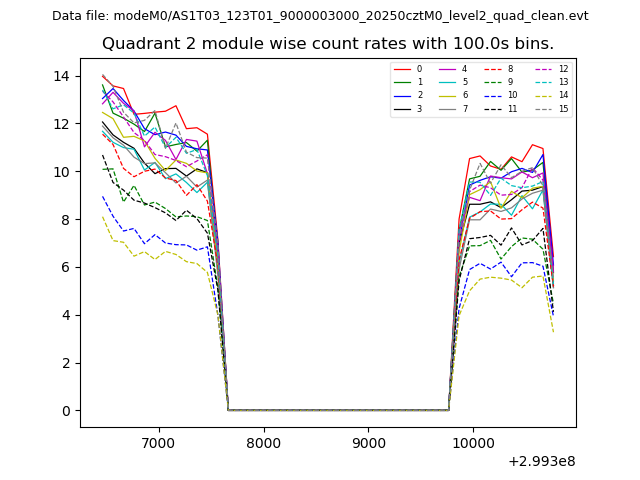
| Module-wise count rates for Quadrant A Data is divided into 100 sec bins |
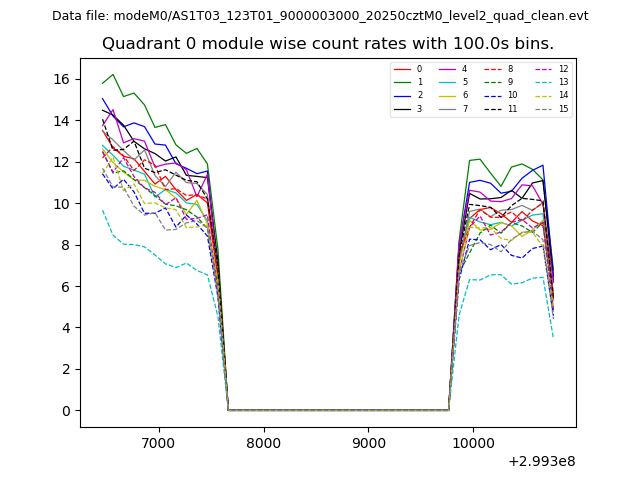 |
 |
| Module-wise count rates for Quadrant B Data is divided into 100 sec bins |
 |
 |
| Module-wise count rates for Quadrant C Data is divided into 100 sec bins |
 |
 |
| Module-wise count rates for Quadrant D Data is divided into 100 sec bins |
 |
 |
| Parameter | Plot |
|---|---|
| CZT HV Monitor | 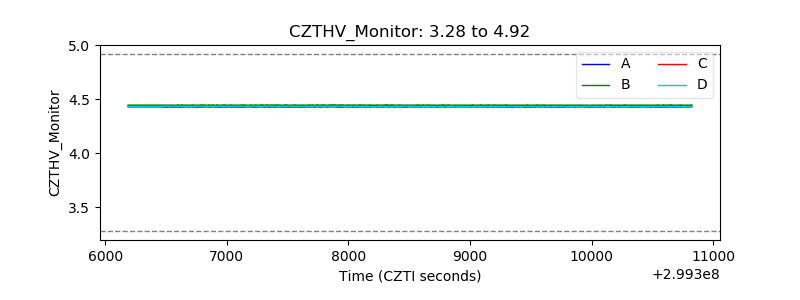 |
| D_VDD | 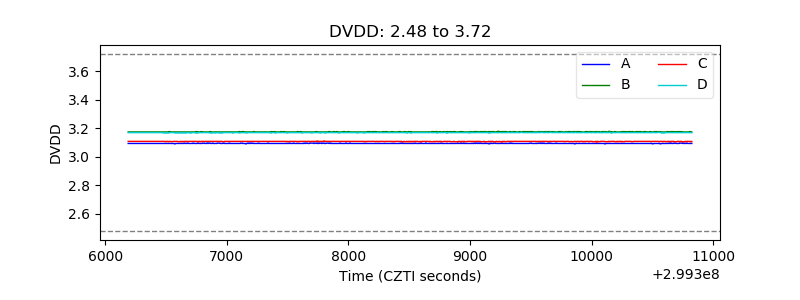 |
| Temperature 1 | 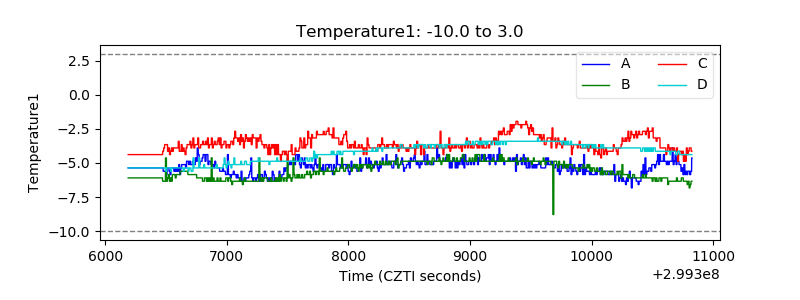 |
| Veto HV Monitor | 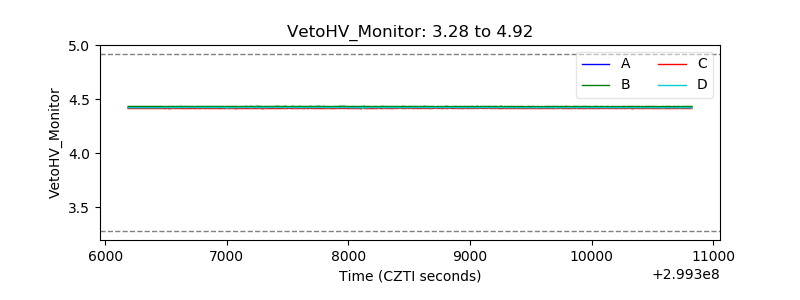 |
| Veto LLD |  |
| Alpha Counter | 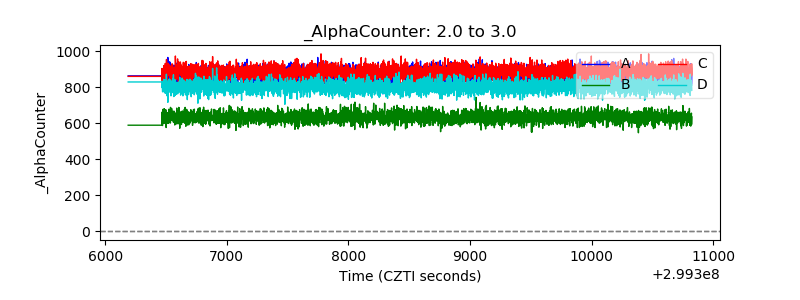 |
| _CPM_Rate | 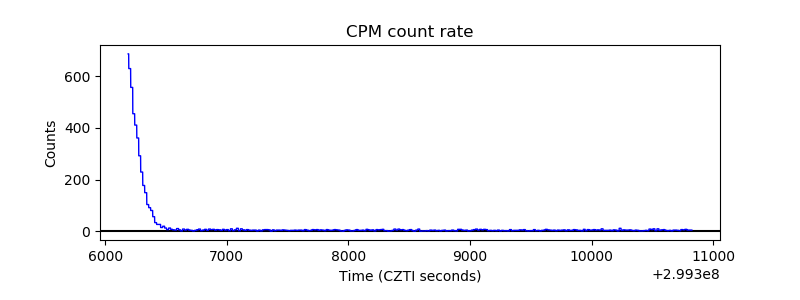 |
| CZT Counter | 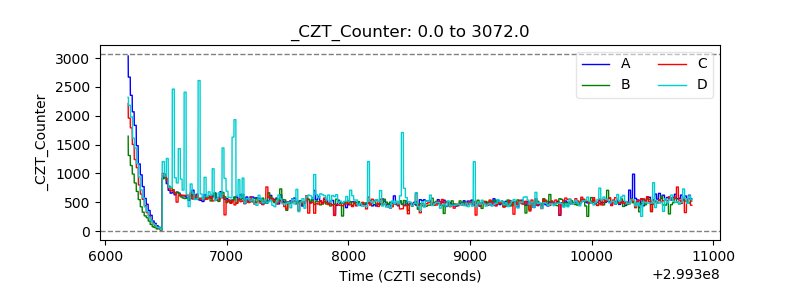 |
| +2.5 Volts monitor |  |
| +5 Volts monitor |  |
| _ROLL_ROT | 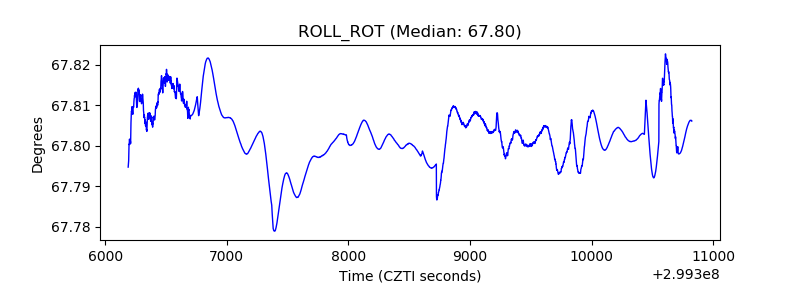 |
| _Roll_DEC | 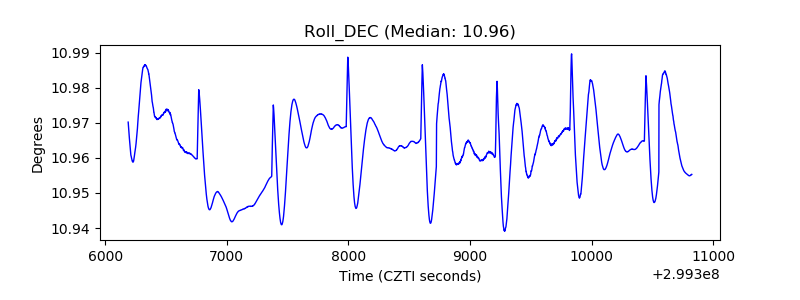 |
| _Roll_RA | 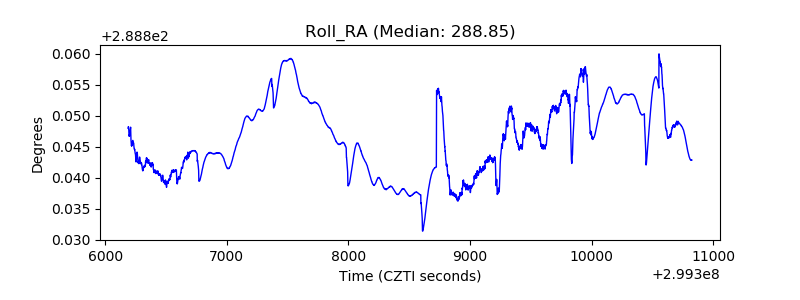 |
| Veto Counter |  |