| Param | Original file | Final file |
|---|---|---|
| Filename | modeM0/AS1A05_117T01_9000003002cztM0_level2.fits | modeM0/AS1A05_117T01_9000003002cztM0_level2_quad_clean.evt |
| Size (bytes) | 563,184,000 | 546,871,680 |
| Size | 537.1 MB | 521.5 MB |
| Events in quadrant A | 3,457,808 | 3,307,490 |
| Events in quadrant B | 3,298,678 | 3,290,980 |
| Events in quadrant C | 3,381,876 | 3,110,737 |
| Events in quadrant D | 2,925,818 | 2,862,406 |
| Mode SS | |||
|---|---|---|---|
| Quadrant | BADHDUFLAG | Total packets | Discarded packets |
| A | 0 | 1182 | 0 |
| B | 0 | 1182 | 0 |
| C | 0 | 1182 | 0 |
| D | 0 | 1182 | 0 |
| Mode M9 | |||
|---|---|---|---|
| Quadrant | BADHDUFLAG | Total packets | Discarded packets |
| A | 0 | 84 | 0 |
| B | 0 | 84 | 0 |
| C | 0 | 84 | 0 |
| D | 0 | 84 | 0 |
| Mode M0 | |||
|---|---|---|---|
| Quadrant | BADHDUFLAG | Total packets | Discarded packets |
| A | 0 | 129778 | 0 |
| B | 0 | 131861 | 0 |
| C | 0 | 123802 | 0 |
| D | 0 | 155629 | 0 |
| Quadrant | Total seconds | Saturated seconds | Saturation percentage |
|---|---|---|---|
| A | 58176 | 1577 | 2.710740% |
| B | 58176 | 1503 | 2.583540% |
| C | 58176 | 939 | 1.614068% |
| D | 58176 | 2533 | 4.354029% |
Noise dominated data is calculated using 1-second bins in cleaned event files. If a bin has >2000 counts, and if more than 50% of those come from <1% of pixels, then it is considered to be noise-dominated and hence unusable.
| Quadrant | # 1 sec bins | Bins with >0 counts | Bins with >2000 counts | High rate bins dominated by noise | Noise dominated (total time) | Noise dominated (detector-on time) | Marked lightcurve |
|---|---|---|---|---|---|---|---|
| A | 65760 | 58122 | 0 | 0 | 0.00% | 0.00% | 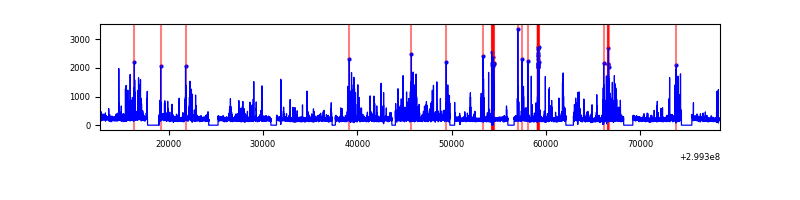 |
| B | 65760 | 58169 | 0 | 0 | 0.00% | 0.00% |  |
| C | 65760 | 58174 | 0 | 0 | 0.00% | 0.00% |  |
| D | 65760 | 58065 | 0 | 0 | 0.00% | 0.00% |  |
Top three noisy pixels from each quadrant. If the there are fewer than three noisy pixels in the level2.evt file, extra rows are filled as -1
| Pixel properties | Quadrant properties | ||||||
|---|---|---|---|---|---|---|---|
| Quadrant | DetID | PixID | Counts | Sigma | Mean | Median | Sigma |
| A | 0 | 29 | 3376 | 11.36 | 901 | 845 | 222.8 |
| A | 7 | 110 | 2850 | 9.0 | 901 | 845 | 222.8 |
| A | 0 | 30 | 2678 | 8.23 | 901 | 845 | 222.8 |
| B | 2 | 9 | 2695 | 10.65 | 872 | 830 | 175.2 |
| B | 2 | 8 | 2226 | 7.97 | 872 | 830 | 175.2 |
| B | 3 | 17 | 2198 | 7.81 | 872 | 830 | 175.2 |
| C | 12 | 241 | 2465 | 7.1 | 893 | 832 | 230.0 |
| C | 2 | 191 | 2287 | 6.33 | 893 | 832 | 230.0 |
| C | 12 | 249 | 2285 | 6.32 | 893 | 832 | 230.0 |
| D | 3 | 14 | 2099 | 5.96 | 837 | 763 | 224.2 |
| D | 7 | 3 | 2081 | 5.88 | 837 | 763 | 224.2 |
| D | 15 | 46 | 2052 | 5.75 | 837 | 763 | 224.2 |
Histogram calculated using DETX and DETY for each event in the final _common_clean file
| Quadrant A |  |
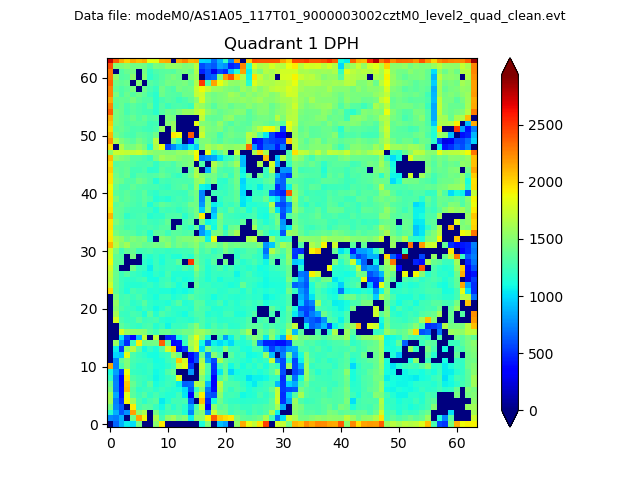 |
Quadrant B |
|---|---|---|---|
| Quadrant D |  |
 |
Quadrant C |
| Plot type | Count rate plots | Images |
|---|---|---|
| Comparison with Poisson distribution Blue bars denote a histogram of data divided into 1 sec bins. Red curve is a Poisson curve with rate = median count rate of data. |
 |
 |
| Quadrant-wise count rates Data is divided into 100 sec bins |
 |
|
| Module-wise count rates for Quadrant A Data is divided into 100 sec bins |
 |
 |
| Module-wise count rates for Quadrant B Data is divided into 100 sec bins |
 |
 |
| Module-wise count rates for Quadrant C Data is divided into 100 sec bins |
 |
 |
| Module-wise count rates for Quadrant D Data is divided into 100 sec bins |
 |
 |
| Parameter | Plot |
|---|---|
| CZT HV Monitor |  |
| D_VDD |  |
| Temperature 1 | 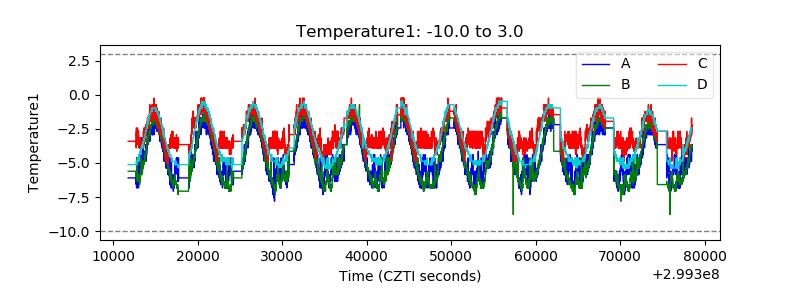 |
| Veto HV Monitor |  |
| Veto LLD | 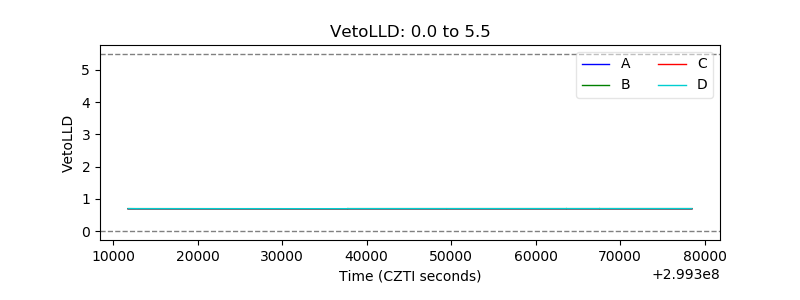 |
| Alpha Counter | 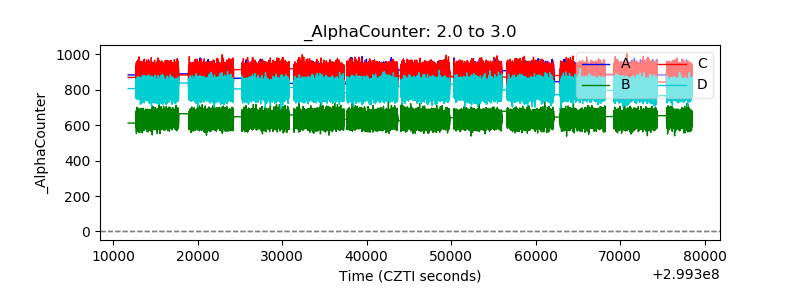 |
| _CPM_Rate |  |
| CZT Counter |  |
| +2.5 Volts monitor |  |
| +5 Volts monitor |  |
| _ROLL_ROT | 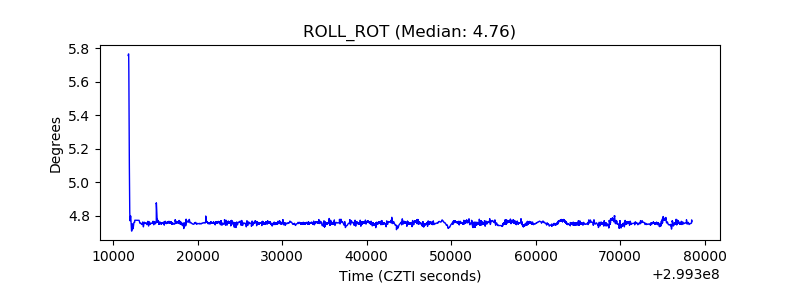 |
| _Roll_DEC | 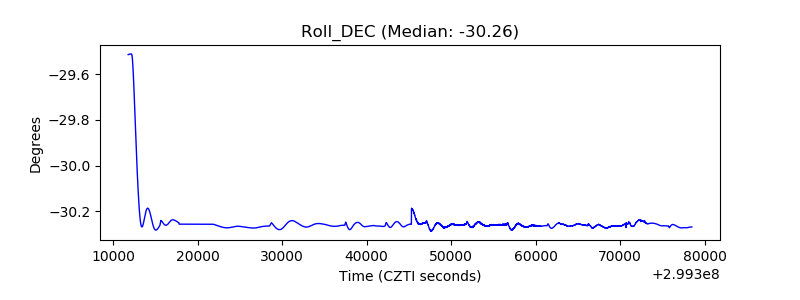 |
| _Roll_RA |  |
| Veto Counter | 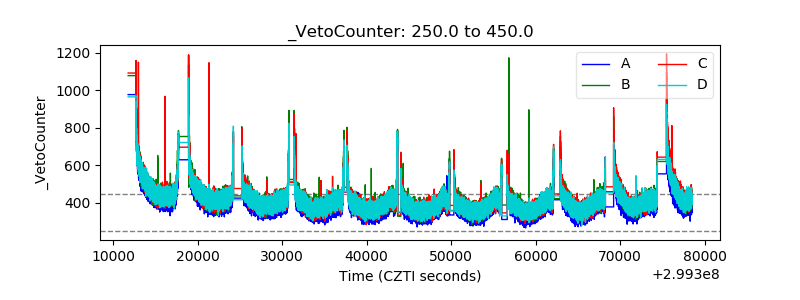 |