| Param | Original file | Final file |
|---|---|---|
| Filename | modeM0/AS1A05_117T01_9000003002_20250cztM0_level2.evt | modeM0/AS1A05_117T01_9000003002_20250cztM0_level2_quad_clean.evt |
| Size (bytes) | 103,959,360 | 31,325,760 |
| Size | 99.1 MB | 29.9 MB |
| Events in quadrant A | 735,129 | 219,655 |
| Events in quadrant B | 723,515 | 221,121 |
| Events in quadrant C | 728,488 | 205,158 |
| Events in quadrant D | 869,391 | 204,248 |
| Mode SS | |||
|---|---|---|---|
| Quadrant | BADHDUFLAG | Total packets | Discarded packets |
| A | 0 | 26 | 0 |
| B | 0 | 26 | 0 |
| C | 0 | 26 | 0 |
| D | 0 | 26 | 0 |
| Mode M9 | |||
|---|---|---|---|
| Quadrant | BADHDUFLAG | Total packets | Discarded packets |
| A | 0 | 10 | 0 |
| B | 0 | 10 | 0 |
| C | 0 | 10 | 0 |
| D | 0 | 10 | 0 |
| Mode M0 | |||
|---|---|---|---|
| Quadrant | BADHDUFLAG | Total packets | Discarded packets |
| A | 0 | 2896 | 1 |
| B | 0 | 2859 | 1 |
| C | 0 | 2889 | 1 |
| D | 0 | 3374 | 2 |
| Quadrant | Total seconds | Saturated seconds | Saturation percentage |
|---|---|---|---|
| A | 1310 | 23 | 1.755725% |
| B | 1310 | 26 | 1.984733% |
| C | 1310 | 32 | 2.442748% |
| D | 1309 | 43 | 3.284950% |
Noise dominated data is calculated using 1-second bins in cleaned event files. If a bin has >2000 counts, and if more than 50% of those come from <1% of pixels, then it is considered to be noise-dominated and hence unusable.
| Quadrant | # 1 sec bins | Bins with >0 counts | Bins with >2000 counts | High rate bins dominated by noise | Noise dominated (total time) | Noise dominated (detector-on time) | Marked lightcurve |
|---|---|---|---|---|---|---|---|
| A | 1310 | 1310 | 0 | 0 | 0.00% | 0.00% | 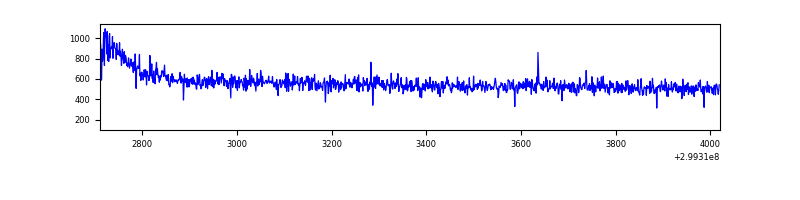 |
| B | 1310 | 1310 | 0 | 0 | 0.00% | 0.00% | 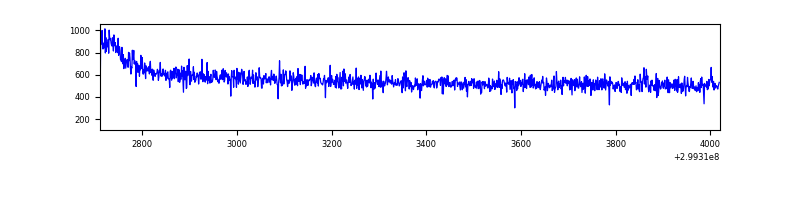 |
| C | 1310 | 1310 | 0 | 0 | 0.00% | 0.00% | 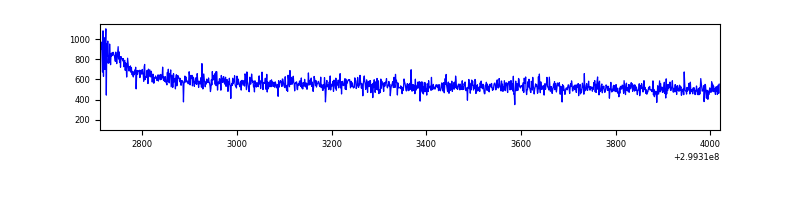 |
| D | 1309 | 1309 | 16 | 16 | 1.22% | 1.22% | 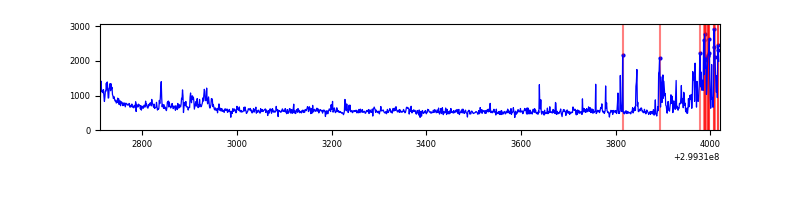 |
Top three noisy pixels from each quadrant. If the there are fewer than three noisy pixels in the level2.evt file, extra rows are filled as -1
| Pixel properties | Quadrant properties | ||||||
|---|---|---|---|---|---|---|---|
| Quadrant | DetID | PixID | Counts | Sigma | Mean | Median | Sigma |
| A | 10 | 253 | 7575 | 188.43 | 189 | 185 | 39.2 |
| A | 0 | 226 | 1603 | 36.15 | 189 | 185 | 39.2 |
| A | 13 | 254 | 1385 | 30.59 | 189 | 185 | 39.2 |
| B | 12 | 111 | 3981 | 103.67 | 184 | 180 | 36.7 |
| B | 11 | 111 | 3613 | 93.63 | 184 | 180 | 36.7 |
| B | 14 | 111 | 3413 | 88.18 | 184 | 180 | 36.7 |
| C | 14 | 238 | 28252 | 665.53 | 178 | 179 | 42.2 |
| C | 3 | 233 | 4610 | 105.05 | 178 | 179 | 42.2 |
| C | 13 | 61 | 1262 | 25.67 | 178 | 179 | 42.2 |
| D | 1 | 52 | 114777 | 2538.12 | 184 | 179 | 45.2 |
| D | 7 | 238 | 29187 | 642.47 | 184 | 179 | 45.2 |
| D | 11 | 176 | 25495 | 560.7 | 184 | 179 | 45.2 |
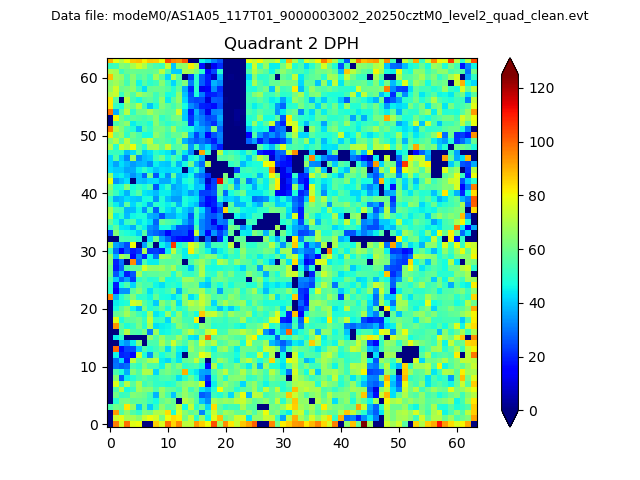
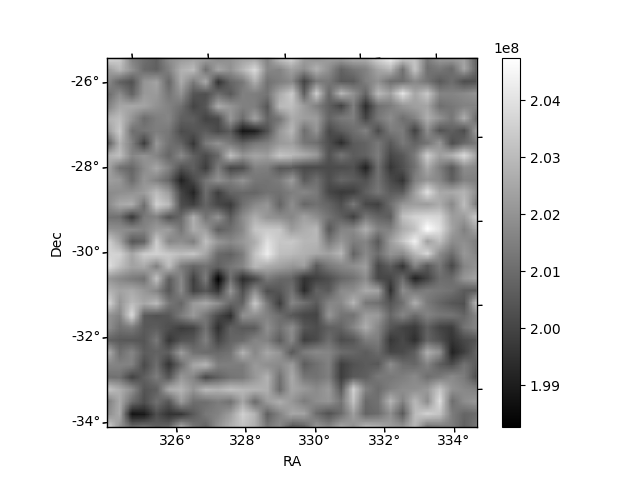
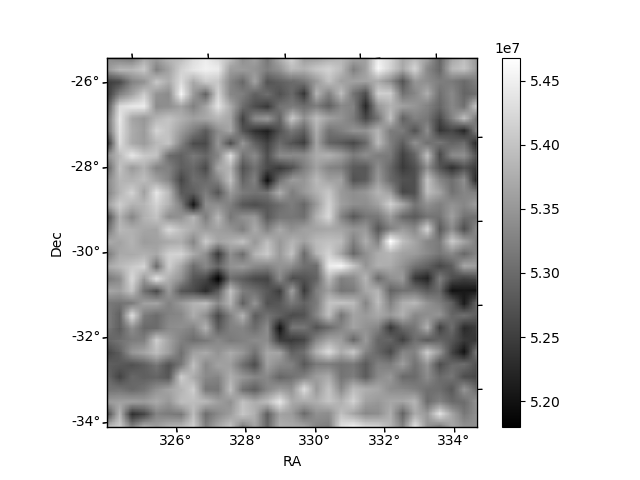
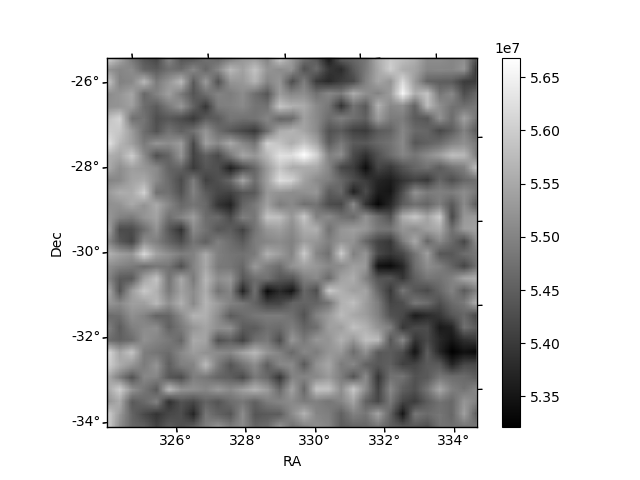
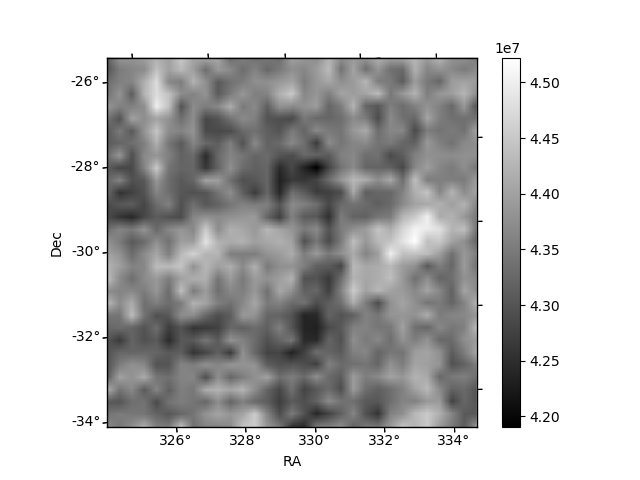
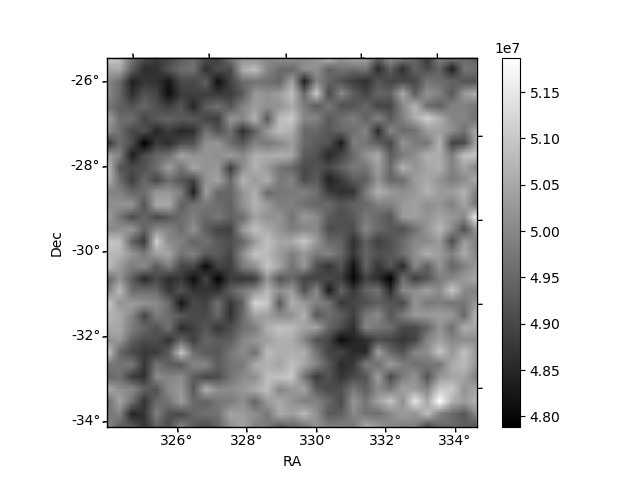
Histogram calculated using DETX and DETY for each event in the final _common_clean file
| Quadrant A | 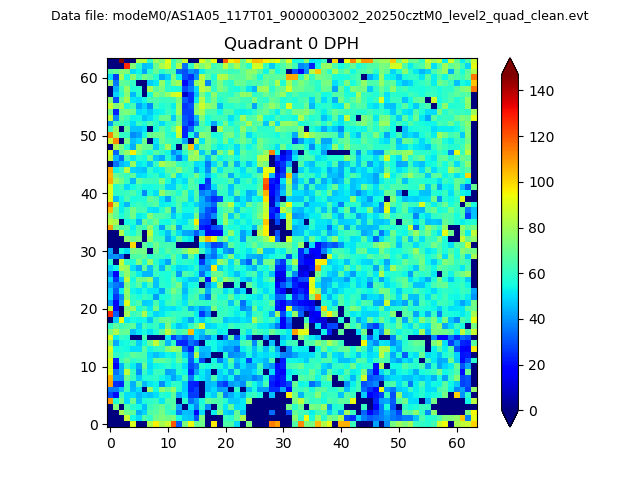 |
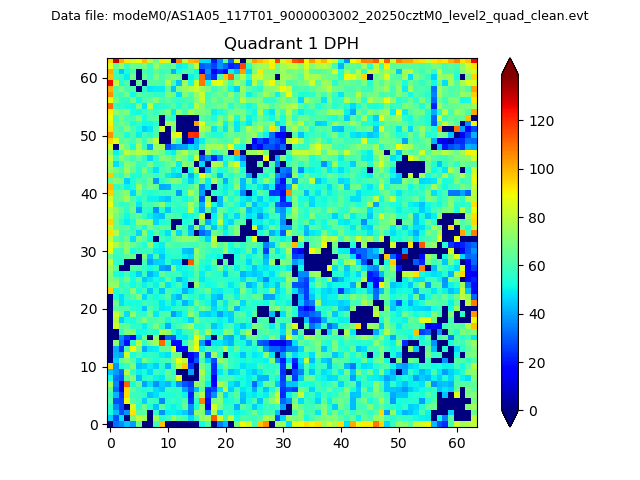 |
Quadrant B |
|---|---|---|---|
| Quadrant D | 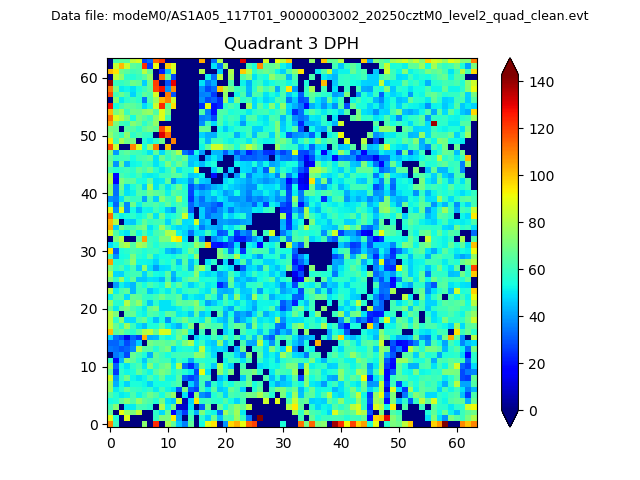 |
 |
Quadrant C |
| Plot type | Count rate plots | Images |
|---|---|---|
| Comparison with Poisson distribution Blue bars denote a histogram of data divided into 1 sec bins. Red curve is a Poisson curve with rate = median count rate of data. |
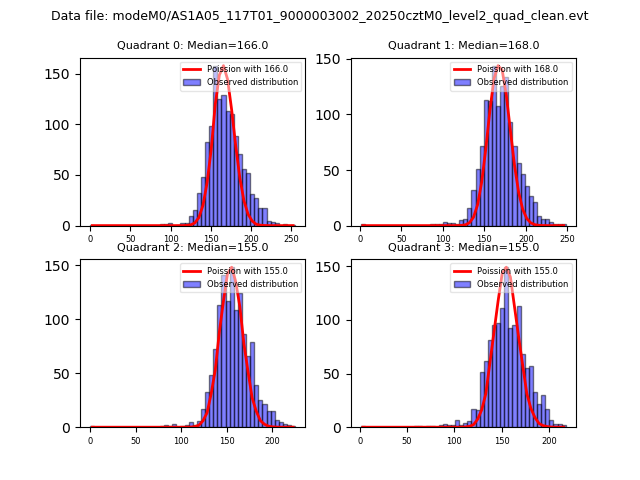 |
 |
| Quadrant-wise count rates Data is divided into 100 sec bins |
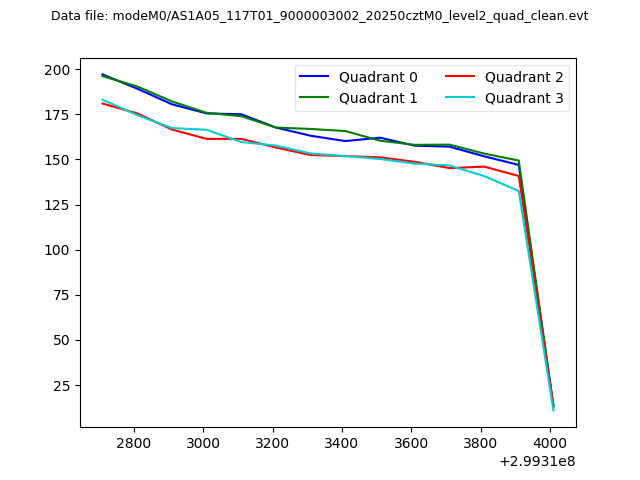 |
|
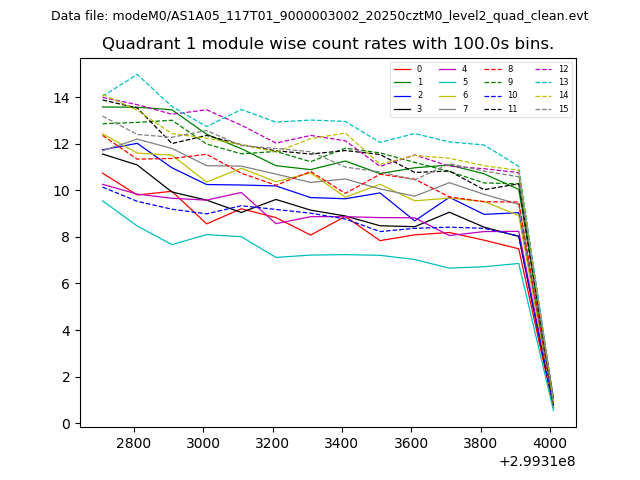
| Module-wise count rates for Quadrant A Data is divided into 100 sec bins |
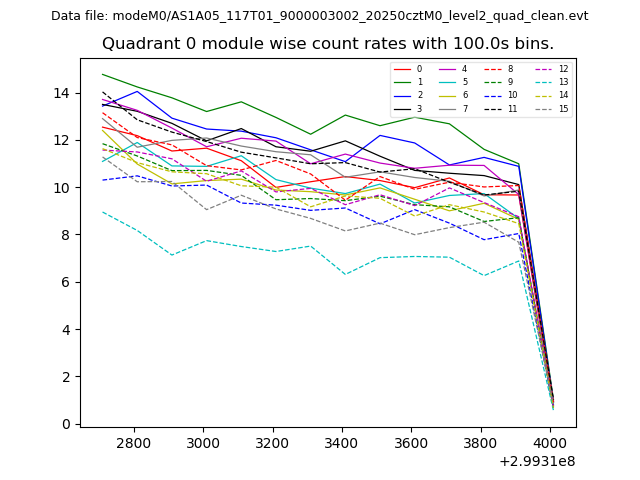 |
 |
| Module-wise count rates for Quadrant B Data is divided into 100 sec bins |
 |
 |
| Module-wise count rates for Quadrant C Data is divided into 100 sec bins |
 |
 |
| Module-wise count rates for Quadrant D Data is divided into 100 sec bins |
 |
 |
| Parameter | Plot |
|---|---|
| CZT HV Monitor | 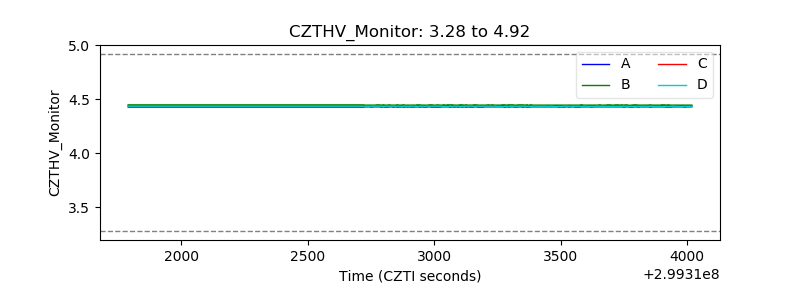 |
| D_VDD | 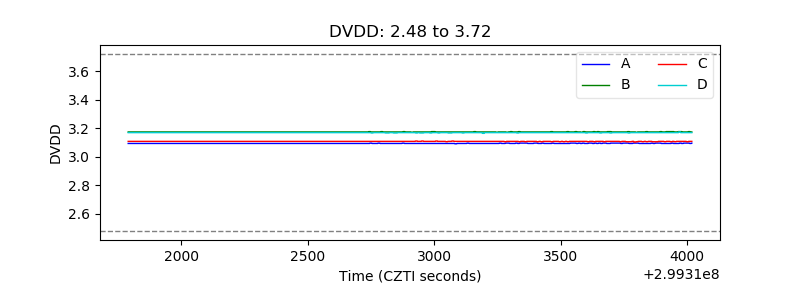 |
| Temperature 1 | 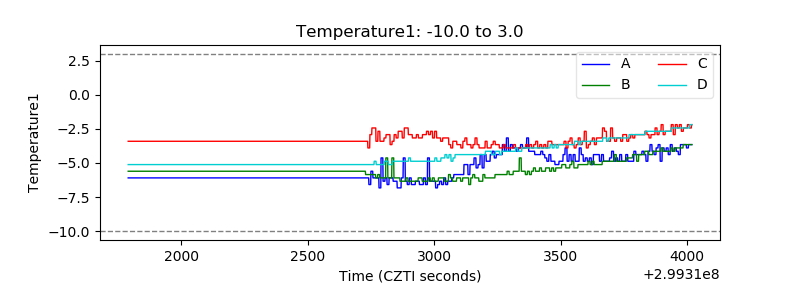 |
| Veto HV Monitor | 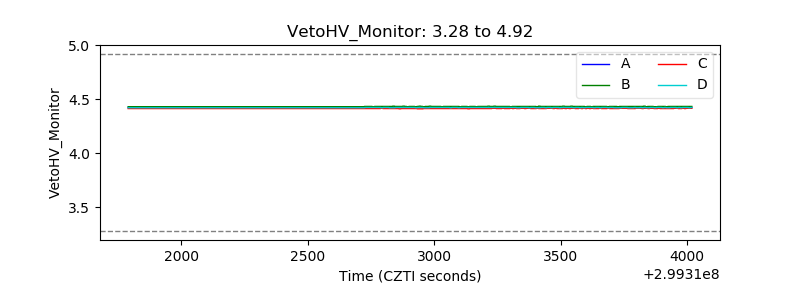 |
| Veto LLD | 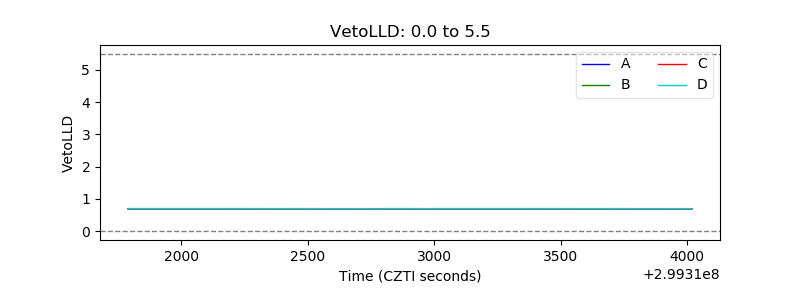 |
| Alpha Counter | 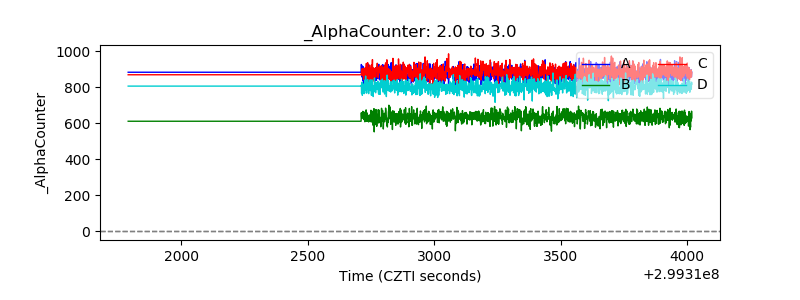 |
| _CPM_Rate | 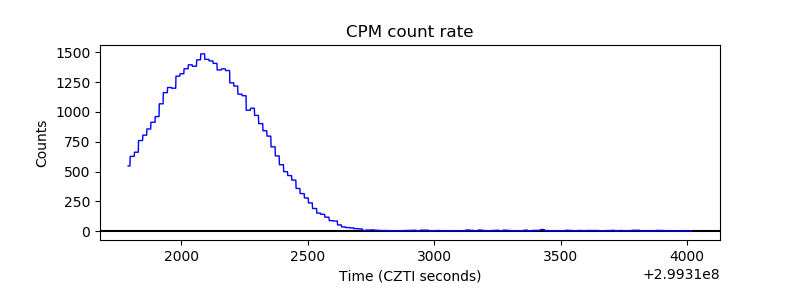 |
| CZT Counter | 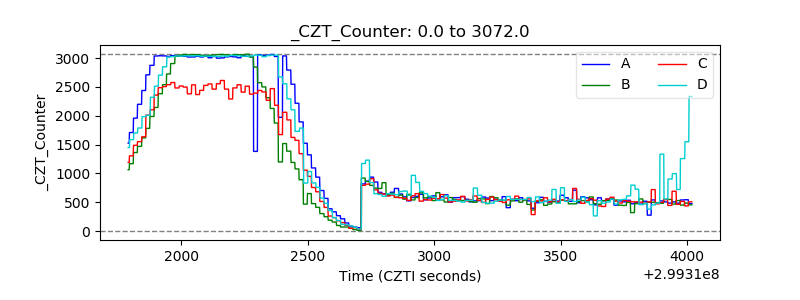 |
| +2.5 Volts monitor |  |
| +5 Volts monitor |  |
| _ROLL_ROT | 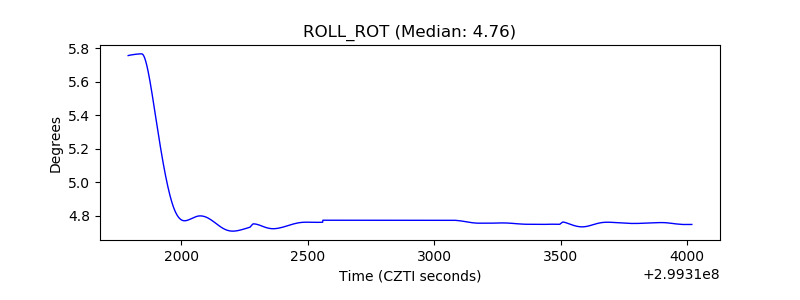 |
| _Roll_DEC | 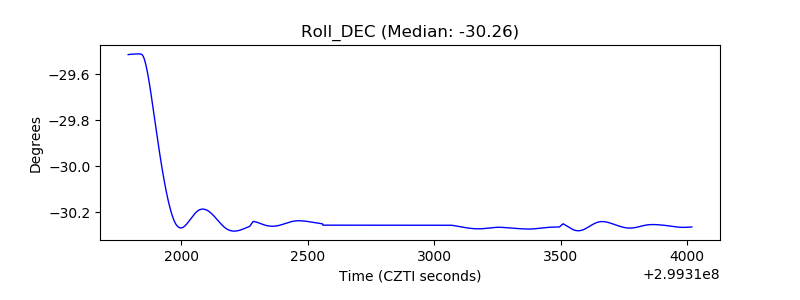 |
| _Roll_RA | 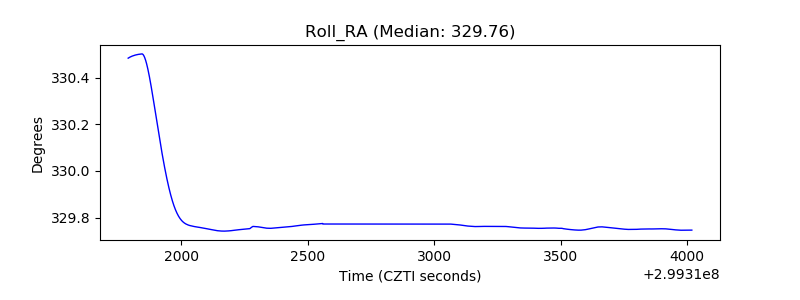 |
| Veto Counter |  |