| Param | Original file | Final file |
|---|---|---|
| Filename | modeM0/AS1A05_117T01_9000003002_20252cztM0_level2.evt | modeM0/AS1A05_117T01_9000003002_20252cztM0_level2_quad_clean.evt |
| Size (bytes) | 554,944,320 | 80,159,040 |
| Size | 529.2 MB | 76.4 MB |
| Events in quadrant A | 3,559,057 | 503,490 |
| Events in quadrant B | 3,838,049 | 504,668 |
| Events in quadrant C | 3,863,236 | 476,176 |
| Events in quadrant D | 5,085,060 | 469,002 |
| Mode SS | |||
|---|---|---|---|
| Quadrant | BADHDUFLAG | Total packets | Discarded packets |
| A | 0 | 138 | 0 |
| B | 0 | 138 | 0 |
| C | 0 | 138 | 0 |
| D | 0 | 138 | 0 |
| Mode M9 | |||
|---|---|---|---|
| Quadrant | BADHDUFLAG | Total packets | Discarded packets |
| A | 0 | 8 | 0 |
| B | 0 | 8 | 0 |
| C | 0 | 8 | 0 |
| D | 0 | 8 | 0 |
| Mode M0 | |||
|---|---|---|---|
| Quadrant | BADHDUFLAG | Total packets | Discarded packets |
| A | 0 | 14567 | 1 |
| B | 0 | 15391 | 1 |
| C | 0 | 15474 | 1 |
| D | 0 | 19445 | 1 |
| Quadrant | Total seconds | Saturated seconds | Saturation percentage |
|---|---|---|---|
| A | 6800 | 92 | 1.352941% |
| B | 6801 | 162 | 2.382003% |
| C | 6801 | 118 | 1.735039% |
| D | 6801 | 611 | 8.983973% |
Noise dominated data is calculated using 1-second bins in cleaned event files. If a bin has >2000 counts, and if more than 50% of those come from <1% of pixels, then it is considered to be noise-dominated and hence unusable.
| Quadrant | # 1 sec bins | Bins with >0 counts | Bins with >2000 counts | High rate bins dominated by noise | Noise dominated (total time) | Noise dominated (detector-on time) | Marked lightcurve |
|---|---|---|---|---|---|---|---|
| A | 7790 | 6801 | 3 | 3 | 0.04% | 0.04% | 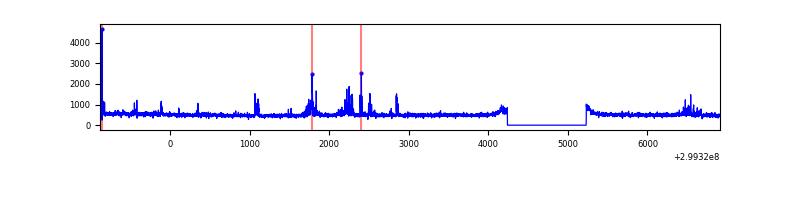 |
| B | 7791 | 6802 | 44 | 44 | 0.56% | 0.65% | 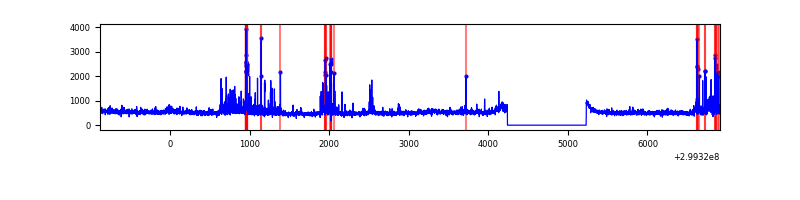 |
| C | 7791 | 6802 | 0 | 0 | 0.00% | 0.00% | 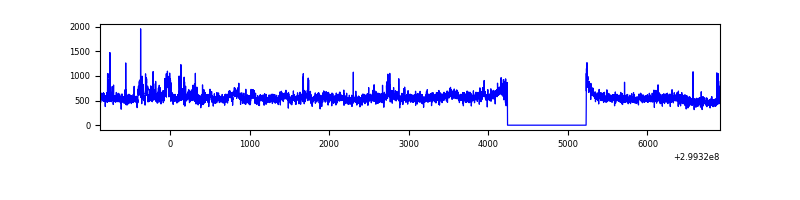 |
| D | 7791 | 6802 | 414 | 414 | 5.31% | 6.09% | 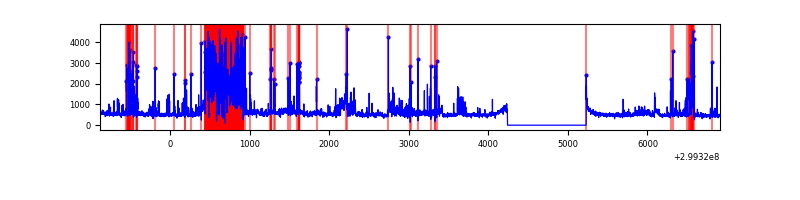 |
Top three noisy pixels from each quadrant. If the there are fewer than three noisy pixels in the level2.evt file, extra rows are filled as -1
| Pixel properties | Quadrant properties | ||||||
|---|---|---|---|---|---|---|---|
| Quadrant | DetID | PixID | Counts | Sigma | Mean | Median | Sigma |
| A | 10 | 253 | 104404 | 590.16 | 869 | 851 | 175.5 |
| A | 4 | 2 | 65997 | 371.28 | 869 | 851 | 175.5 |
| A | 14 | 238 | 37021 | 206.14 | 869 | 851 | 175.5 |
| B | 7 | 220 | 327036 | 2029.27 | 853 | 832 | 160.7 |
| B | 0 | 85 | 51800 | 317.06 | 853 | 832 | 160.7 |
| B | 0 | 197 | 25109 | 151.02 | 853 | 832 | 160.7 |
| C | 3 | 9 | 470510 | 2435.34 | 822 | 828 | 192.9 |
| C | 14 | 238 | 128848 | 663.8 | 822 | 828 | 192.9 |
| C | 3 | 233 | 46000 | 234.22 | 822 | 828 | 192.9 |
| D | 1 | 52 | 1351693 | 6933.15 | 804 | 785 | 194.8 |
| D | 7 | 238 | 199497 | 1019.83 | 804 | 785 | 194.8 |
| D | 15 | 0 | 183614 | 938.32 | 804 | 785 | 194.8 |
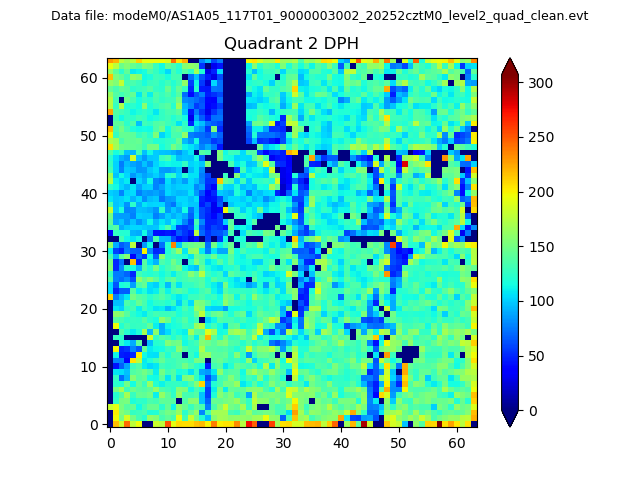
Histogram calculated using DETX and DETY for each event in the final _common_clean file
| Quadrant A | 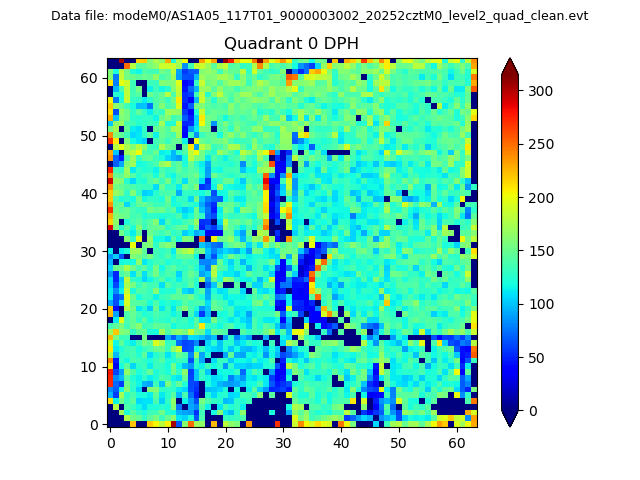 |
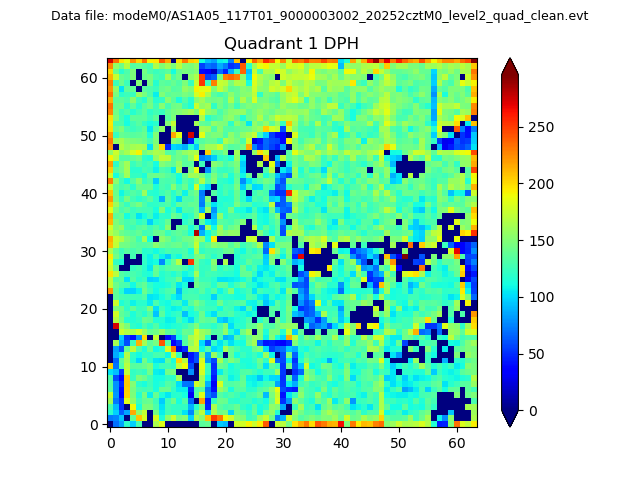 |
Quadrant B |
|---|---|---|---|
| Quadrant D | 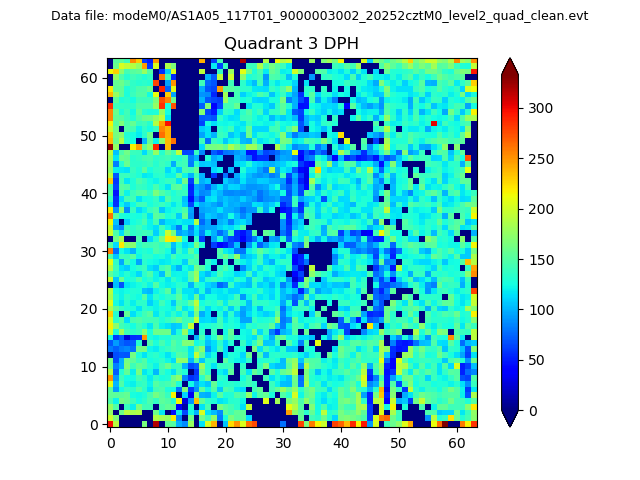 |
 |
Quadrant C |
| Plot type | Count rate plots | Images |
|---|---|---|
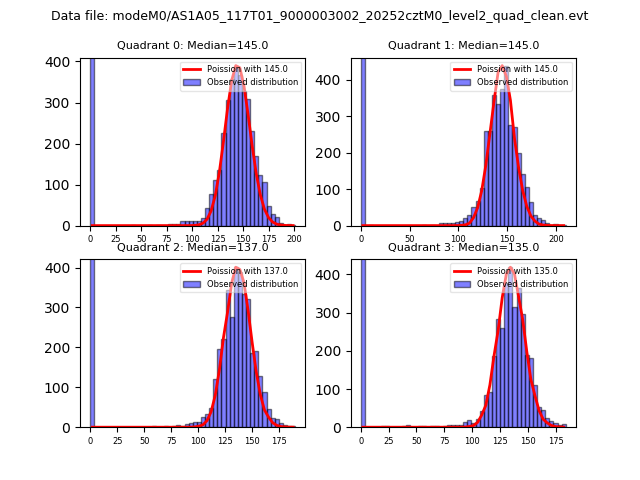
| Comparison with Poisson distribution Blue bars denote a histogram of data divided into 1 sec bins. Red curve is a Poisson curve with rate = median count rate of data. |
 |
 |
| Quadrant-wise count rates Data is divided into 100 sec bins |
 |
|
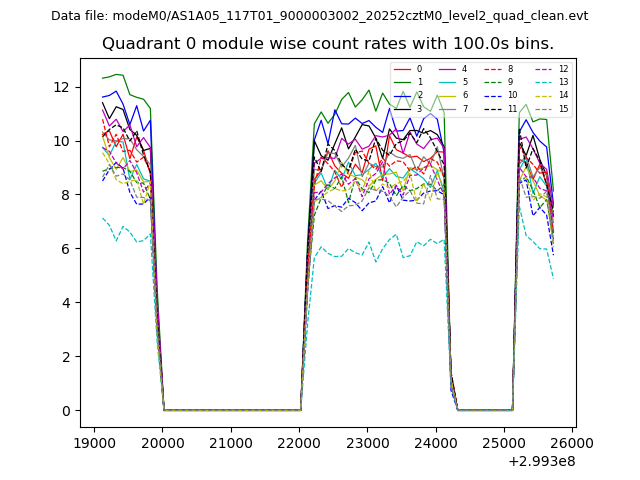
| Module-wise count rates for Quadrant A Data is divided into 100 sec bins |
 |
 |
| Module-wise count rates for Quadrant B Data is divided into 100 sec bins |
 |
 |
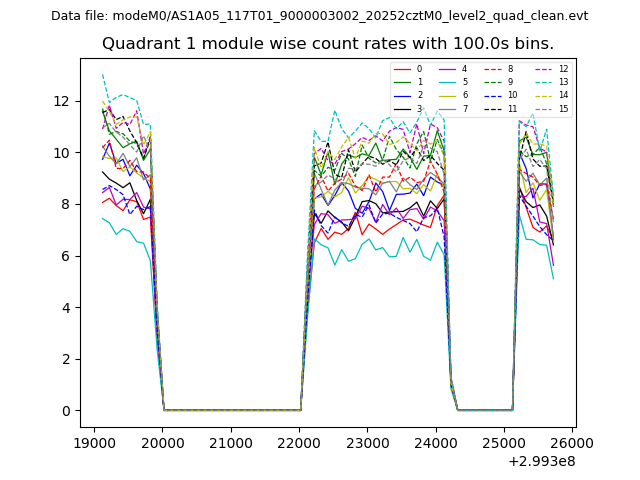
| Module-wise count rates for Quadrant C Data is divided into 100 sec bins |
 |
 |
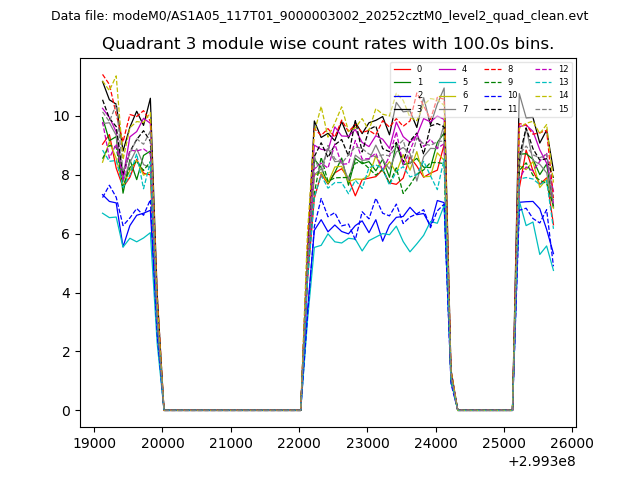
| Module-wise count rates for Quadrant D Data is divided into 100 sec bins |
 |
 |
| Parameter | Plot |
|---|---|
| CZT HV Monitor |  |
| D_VDD | 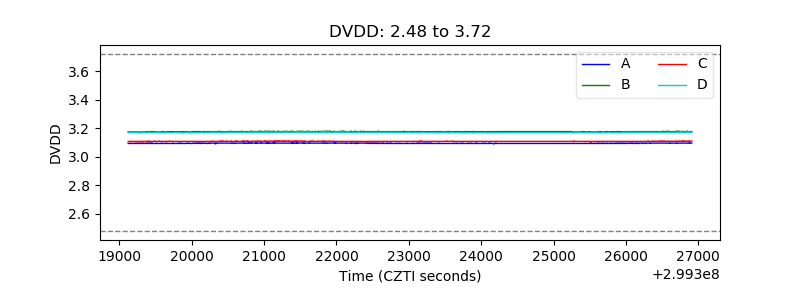 |
| Temperature 1 | 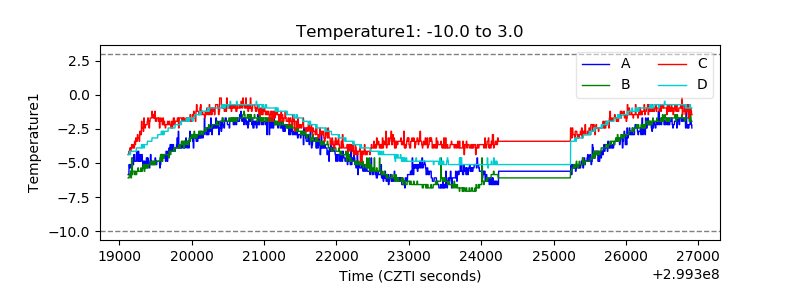 |
| Veto HV Monitor | 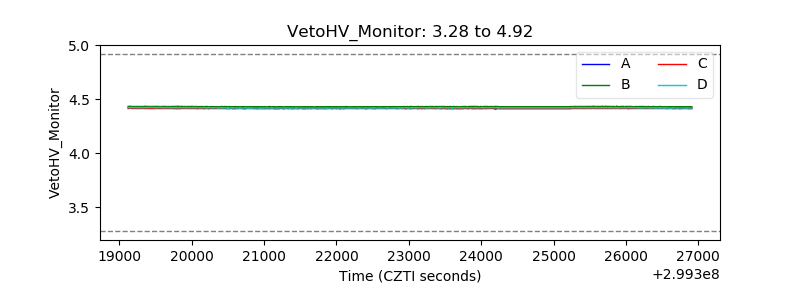 |
| Veto LLD | 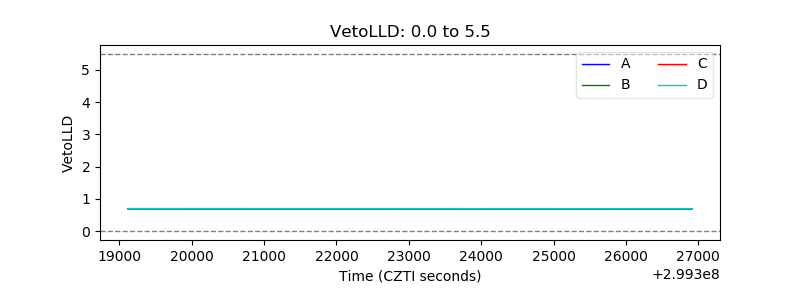 |
| Alpha Counter | 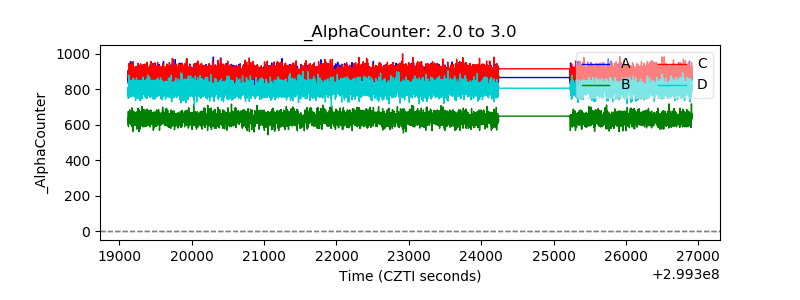 |
| _CPM_Rate | 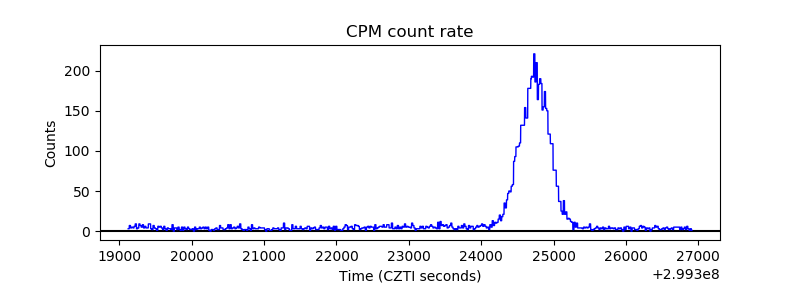 |
| CZT Counter | 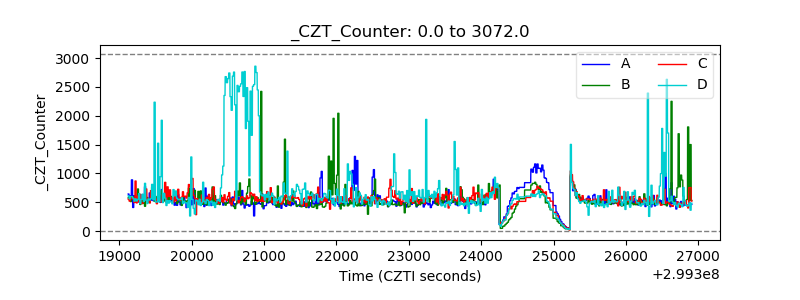 |
| +2.5 Volts monitor |  |
| +5 Volts monitor |  |
| _ROLL_ROT | 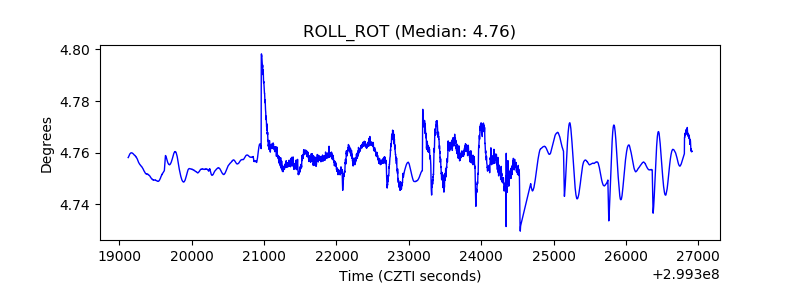 |
| _Roll_DEC | 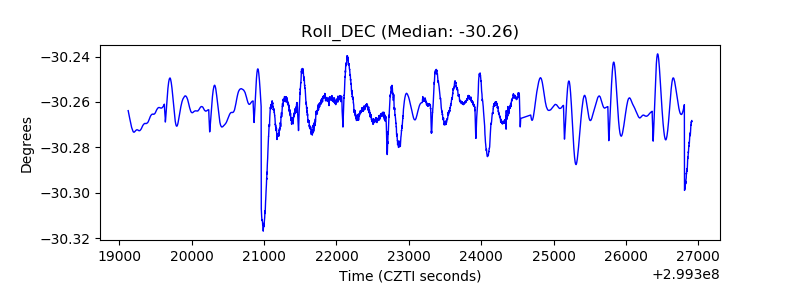 |
| _Roll_RA | 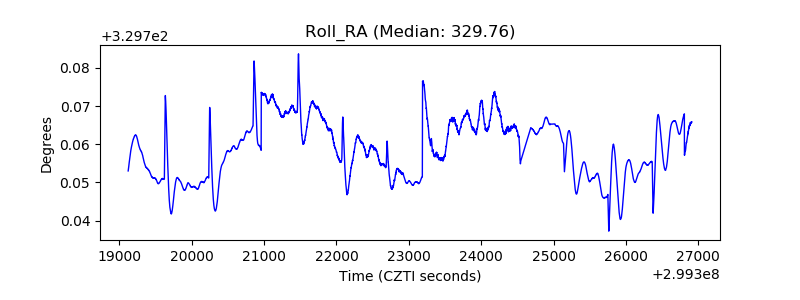 |
| Veto Counter | 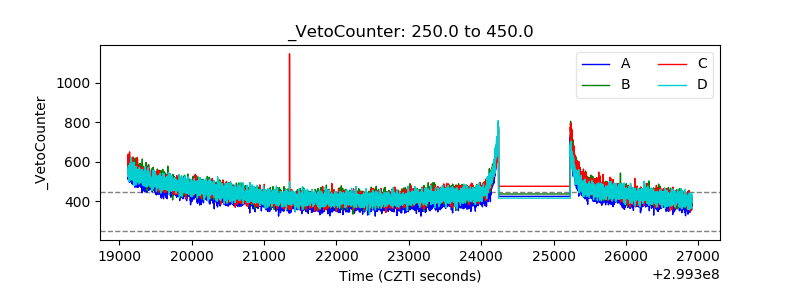 |