| Param | Original file | Final file |
|---|---|---|
| Filename | modeM0/AS1A05_117T01_9000003002_20253cztM0_level2.evt | modeM0/AS1A05_117T01_9000003002_20253cztM0_level2_quad_clean.evt |
| Size (bytes) | 905,417,280 | 129,533,760 |
| Size | 863.5 MB | 123.5 MB |
| Events in quadrant A | 5,958,630 | 803,492 |
| Events in quadrant B | 6,471,498 | 799,526 |
| Events in quadrant C | 6,547,265 | 760,632 |
| Events in quadrant D | 7,661,546 | 759,195 |
| Mode SS | |||
|---|---|---|---|
| Quadrant | BADHDUFLAG | Total packets | Discarded packets |
| A | 0 | 234 | 0 |
| B | 0 | 234 | 0 |
| C | 0 | 234 | 0 |
| D | 0 | 234 | 0 |
| Mode M9 | |||
|---|---|---|---|
| Quadrant | BADHDUFLAG | Total packets | Discarded packets |
| A | 0 | 16 | 0 |
| B | 0 | 16 | 0 |
| C | 0 | 16 | 0 |
| D | 0 | 16 | 0 |
| Mode M0 | |||
|---|---|---|---|
| Quadrant | BADHDUFLAG | Total packets | Discarded packets |
| A | 0 | 24739 | 2 |
| B | 0 | 26244 | 2 |
| C | 0 | 26651 | 2 |
| D | 0 | 29994 | 2 |
| Quadrant | Total seconds | Saturated seconds | Saturation percentage |
|---|---|---|---|
| A | 11562 | 273 | 2.361183% |
| B | 11563 | 344 | 2.975006% |
| C | 11563 | 263 | 2.274496% |
| D | 11563 | 707 | 6.114330% |
Noise dominated data is calculated using 1-second bins in cleaned event files. If a bin has >2000 counts, and if more than 50% of those come from <1% of pixels, then it is considered to be noise-dominated and hence unusable.
| Quadrant | # 1 sec bins | Bins with >0 counts | Bins with >2000 counts | High rate bins dominated by noise | Noise dominated (total time) | Noise dominated (detector-on time) | Marked lightcurve |
|---|---|---|---|---|---|---|---|
| A | 13152 | 11564 | 13 | 13 | 0.10% | 0.11% | 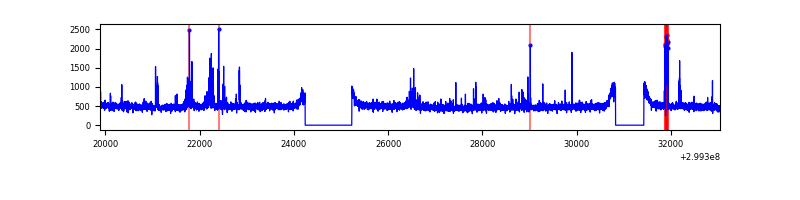 |
| B | 13153 | 11565 | 68 | 68 | 0.52% | 0.59% | 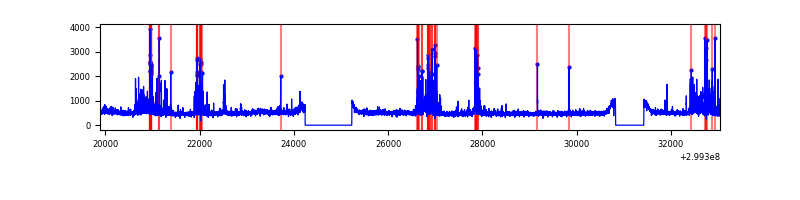 |
| C | 13153 | 11565 | 0 | 0 | 0.00% | 0.00% | 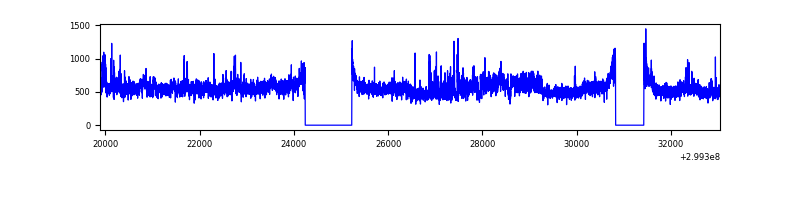 |
| D | 13153 | 11565 | 435 | 435 | 3.31% | 3.76% | 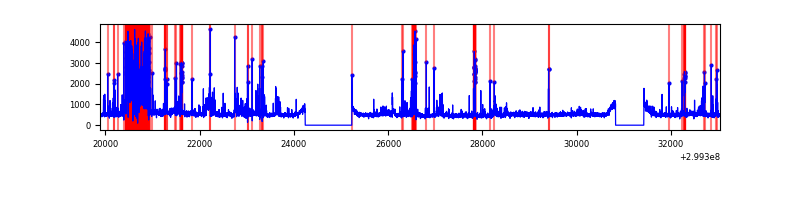 |
Top three noisy pixels from each quadrant. If the there are fewer than three noisy pixels in the level2.evt file, extra rows are filled as -1
| Pixel properties | Quadrant properties | ||||||
|---|---|---|---|---|---|---|---|
| Quadrant | DetID | PixID | Counts | Sigma | Mean | Median | Sigma |
| A | 14 | 111 | 109098 | 367.99 | 1457 | 1422 | 292.6 |
| A | 10 | 253 | 104967 | 353.88 | 1457 | 1422 | 292.6 |
| A | 4 | 2 | 74958 | 251.32 | 1457 | 1422 | 292.6 |
| B | 7 | 220 | 573519 | 2110.24 | 1437 | 1400 | 271.1 |
| B | 0 | 197 | 51332 | 184.17 | 1437 | 1400 | 271.1 |
| B | 0 | 85 | 35067 | 124.18 | 1437 | 1400 | 271.1 |
| C | 3 | 9 | 783388 | 2414.67 | 1386 | 1392 | 323.9 |
| C | 14 | 238 | 216671 | 664.74 | 1386 | 1392 | 323.9 |
| C | 3 | 233 | 114453 | 349.11 | 1386 | 1392 | 323.9 |
| D | 1 | 52 | 1245927 | 3701.24 | 1383 | 1347 | 336.3 |
| D | 2 | 16 | 407637 | 1208.26 | 1383 | 1347 | 336.3 |
| D | 7 | 238 | 267886 | 792.66 | 1383 | 1347 | 336.3 |
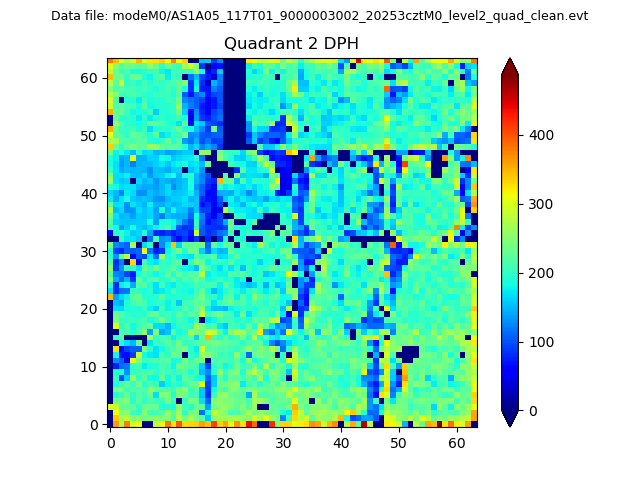
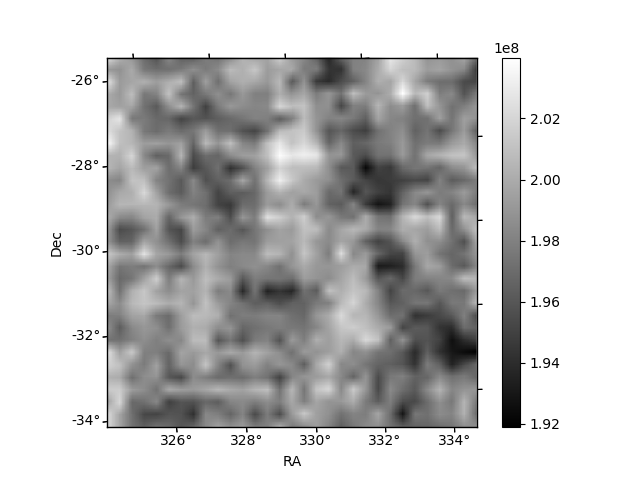
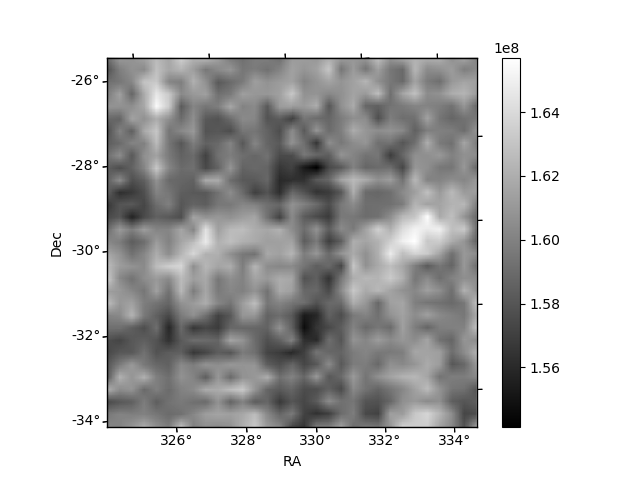
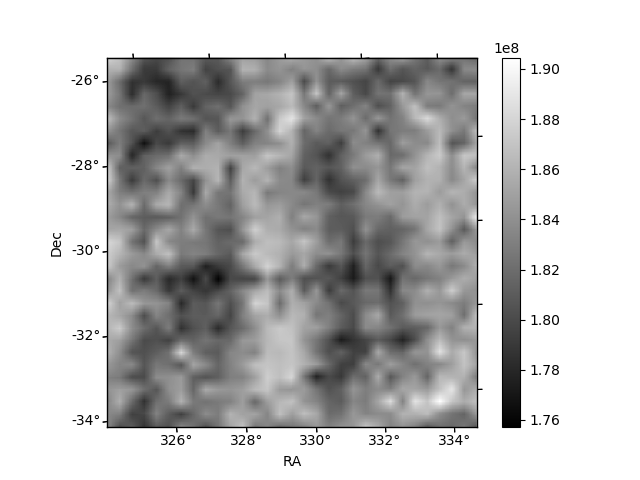
Histogram calculated using DETX and DETY for each event in the final _common_clean file
| Quadrant A | 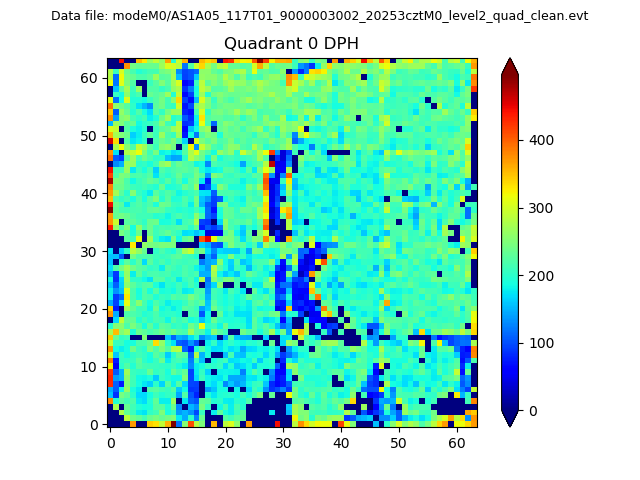 |
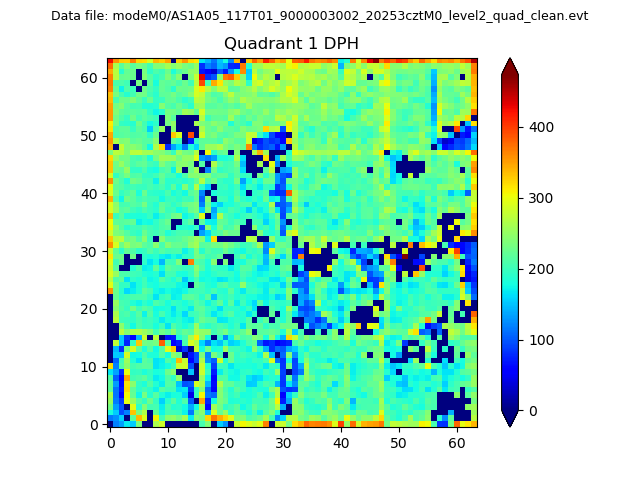 |
Quadrant B |
|---|---|---|---|
| Quadrant D | 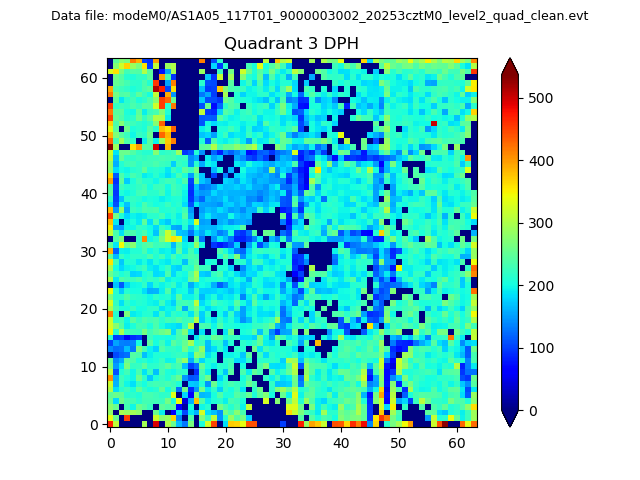 |
 |
Quadrant C |
| Plot type | Count rate plots | Images |
|---|---|---|
| Comparison with Poisson distribution Blue bars denote a histogram of data divided into 1 sec bins. Red curve is a Poisson curve with rate = median count rate of data. |
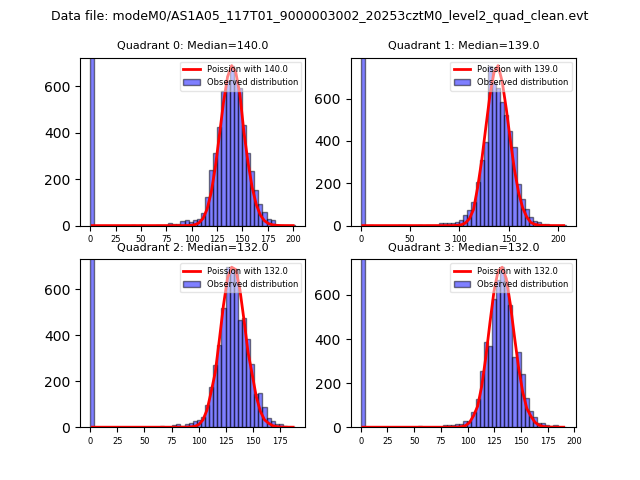 |
 |
| Quadrant-wise count rates Data is divided into 100 sec bins |
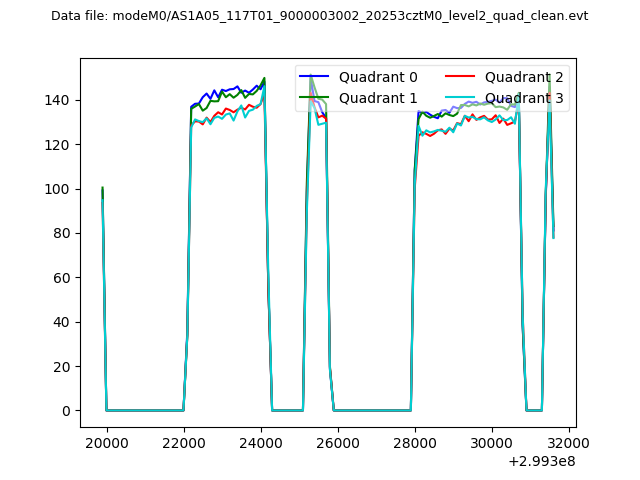 |
|
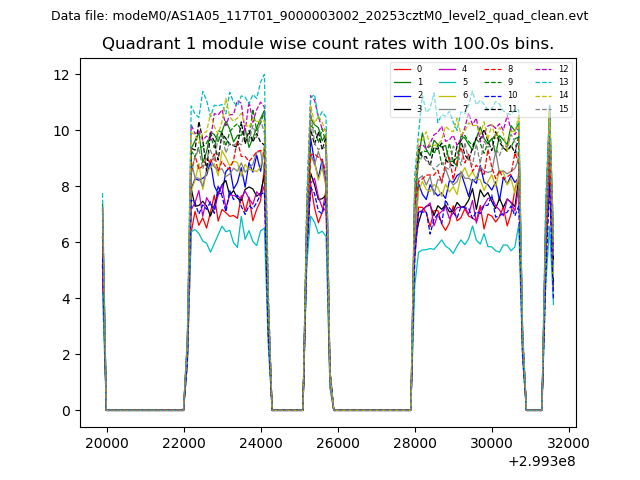
| Module-wise count rates for Quadrant A Data is divided into 100 sec bins |
 |
 |
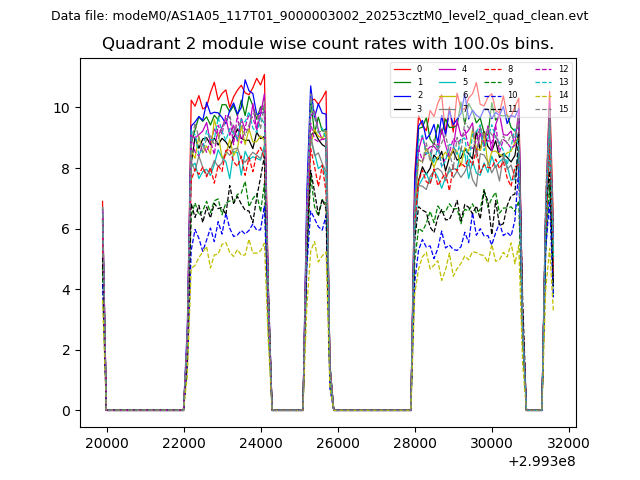
| Module-wise count rates for Quadrant B Data is divided into 100 sec bins |
 |
 |
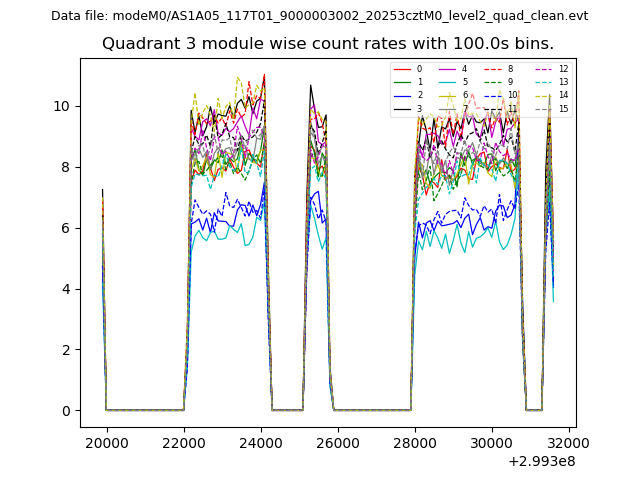
| Module-wise count rates for Quadrant C Data is divided into 100 sec bins |
 |
 |
| Module-wise count rates for Quadrant D Data is divided into 100 sec bins |
 |
 |
| Parameter | Plot |
|---|---|
| CZT HV Monitor | 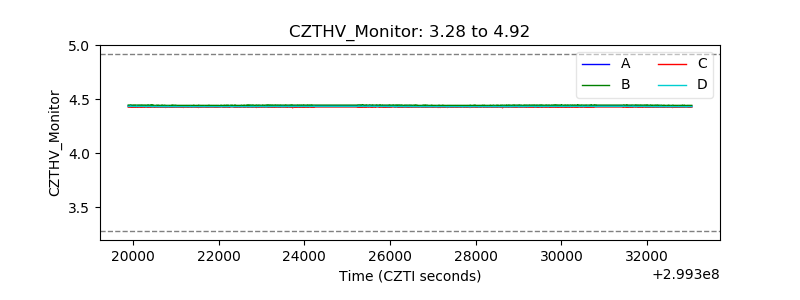 |
| D_VDD | 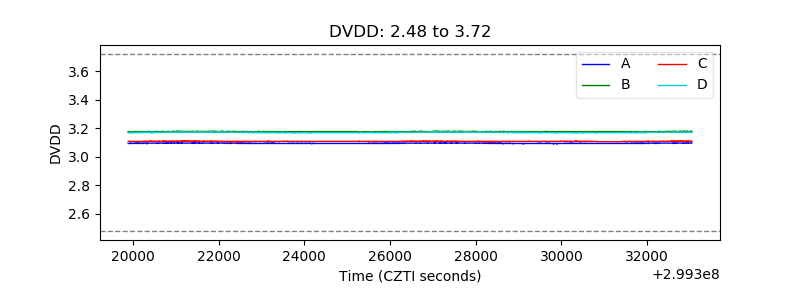 |
| Temperature 1 | 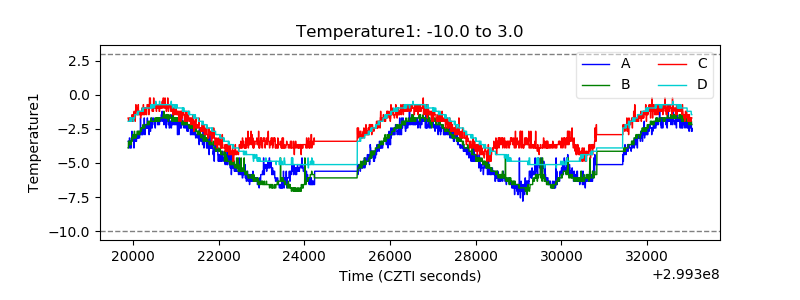 |
| Veto HV Monitor | 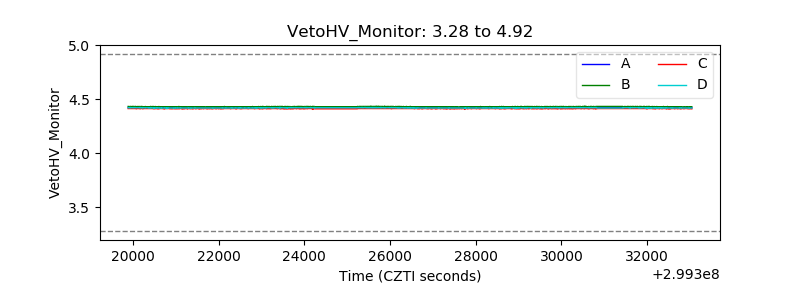 |
| Veto LLD | 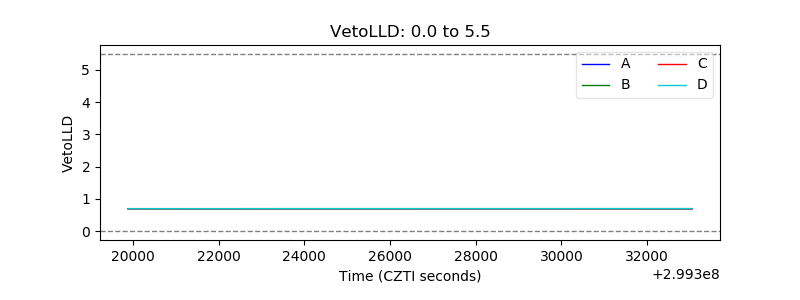 |
| Alpha Counter | 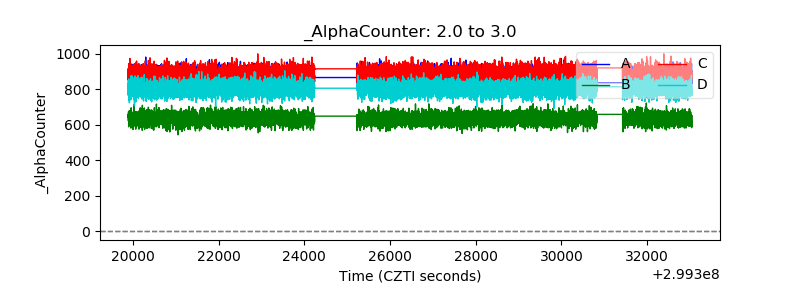 |
| _CPM_Rate | 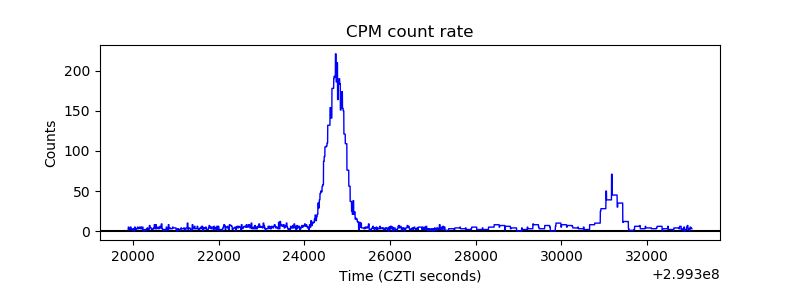 |
| CZT Counter | 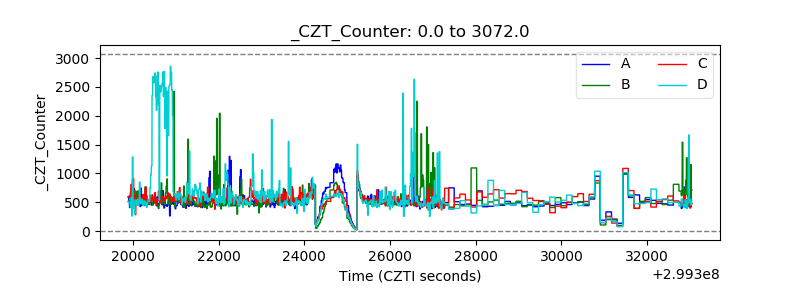 |
| +2.5 Volts monitor |  |
| +5 Volts monitor |  |
| _ROLL_ROT | 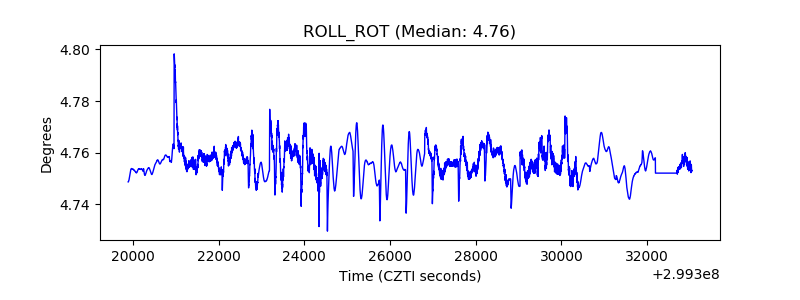 |
| _Roll_DEC |  |
| _Roll_RA | 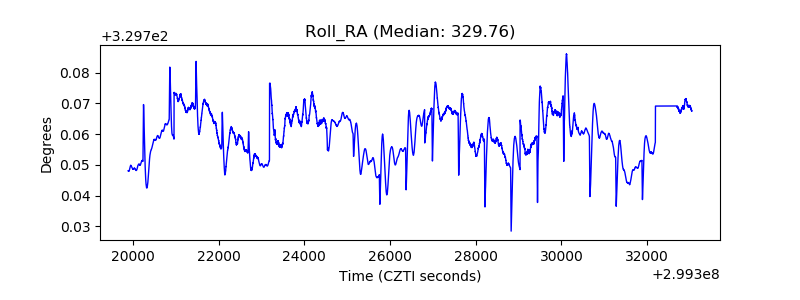 |
| Veto Counter |  |