| Param | Original file | Final file |
|---|---|---|
| Filename | modeM0/AS1A05_117T01_9000003002_20254cztM0_level2.evt | modeM0/AS1A05_117T01_9000003002_20254cztM0_level2_quad_clean.evt |
| Size (bytes) | 561,931,200 | 83,056,320 |
| Size | 535.9 MB | 79.2 MB |
| Events in quadrant A | 3,959,582 | 508,632 |
| Events in quadrant B | 4,189,223 | 505,743 |
| Events in quadrant C | 3,876,525 | 486,242 |
| Events in quadrant D | 4,476,022 | 484,511 |
| Mode SS | |||
|---|---|---|---|
| Quadrant | BADHDUFLAG | Total packets | Discarded packets |
| A | 0 | 156 | 0 |
| B | 0 | 156 | 0 |
| C | 0 | 156 | 0 |
| D | 0 | 156 | 0 |
| Mode M9 | |||
|---|---|---|---|
| Quadrant | BADHDUFLAG | Total packets | Discarded packets |
| A | 0 | 9 | 0 |
| B | 0 | 9 | 0 |
| C | 0 | 9 | 0 |
| D | 0 | 9 | 0 |
| Mode M0 | |||
|---|---|---|---|
| Quadrant | BADHDUFLAG | Total packets | Discarded packets |
| A | 0 | 16597 | 2 |
| B | 0 | 17242 | 2 |
| C | 0 | 16213 | 2 |
| D | 0 | 18178 | 2 |
| Quadrant | Total seconds | Saturated seconds | Saturation percentage |
|---|---|---|---|
| A | 7614 | 296 | 3.887576% |
| B | 7615 | 301 | 3.952725% |
| C | 7615 | 236 | 3.099146% |
| D | 7615 | 265 | 3.479974% |
Noise dominated data is calculated using 1-second bins in cleaned event files. If a bin has >2000 counts, and if more than 50% of those come from <1% of pixels, then it is considered to be noise-dominated and hence unusable.
| Quadrant | # 1 sec bins | Bins with >0 counts | Bins with >2000 counts | High rate bins dominated by noise | Noise dominated (total time) | Noise dominated (detector-on time) | Marked lightcurve |
|---|---|---|---|---|---|---|---|
| A | 8559 | 7616 | 14 | 14 | 0.16% | 0.18% | 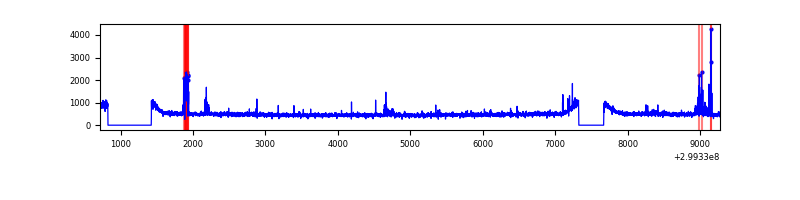 |
| B | 8560 | 7617 | 23 | 23 | 0.27% | 0.30% | 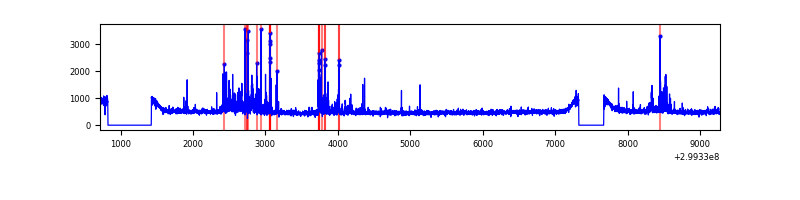 |
| C | 8560 | 7617 | 0 | 0 | 0.00% | 0.00% | 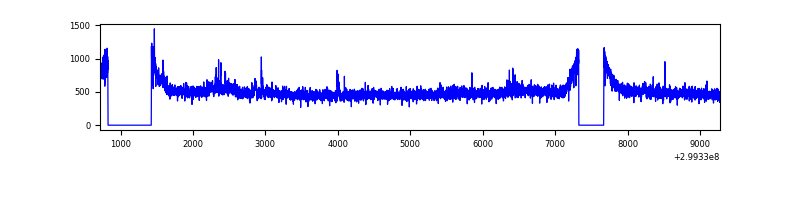 |
| D | 8560 | 7617 | 120 | 120 | 1.40% | 1.58% | 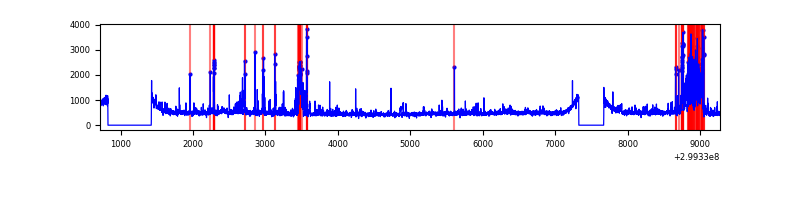 |
Top three noisy pixels from each quadrant. If the there are fewer than three noisy pixels in the level2.evt file, extra rows are filled as -1
| Pixel properties | Quadrant properties | ||||||
|---|---|---|---|---|---|---|---|
| Quadrant | DetID | PixID | Counts | Sigma | Mean | Median | Sigma |
| A | 14 | 111 | 106704 | 535.8 | 970 | 948 | 197.4 |
| A | 14 | 238 | 70840 | 354.1 | 970 | 948 | 197.4 |
| A | 4 | 2 | 34977 | 172.4 | 970 | 948 | 197.4 |
| B | 7 | 220 | 232436 | 1253.57 | 955 | 933 | 184.7 |
| B | 6 | 36 | 55923 | 297.77 | 955 | 933 | 184.7 |
| B | 15 | 222 | 30529 | 160.26 | 955 | 933 | 184.7 |
| C | 14 | 238 | 141038 | 638.41 | 924 | 930 | 219.5 |
| C | 3 | 233 | 60408 | 271.01 | 924 | 930 | 219.5 |
| C | 3 | 9 | 47280 | 211.19 | 924 | 930 | 219.5 |
| D | 7 | 238 | 470743 | 2009.74 | 947 | 918 | 233.8 |
| D | 2 | 16 | 110636 | 469.33 | 947 | 918 | 233.8 |
| D | 7 | 38 | 94665 | 401.01 | 947 | 918 | 233.8 |
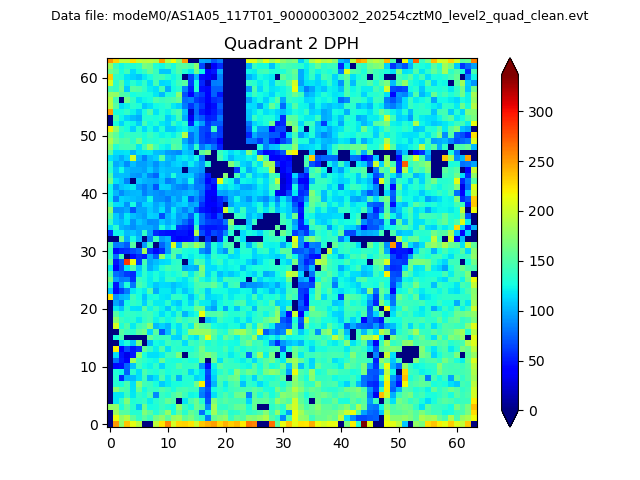
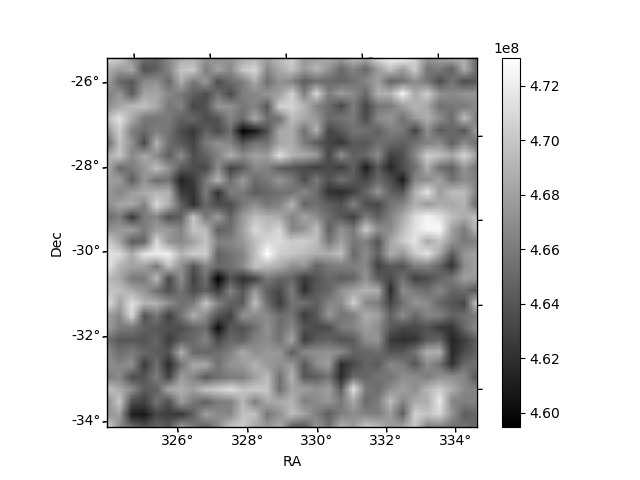
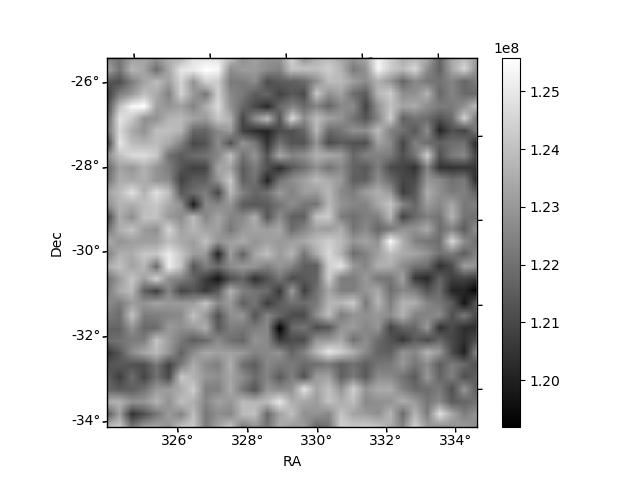
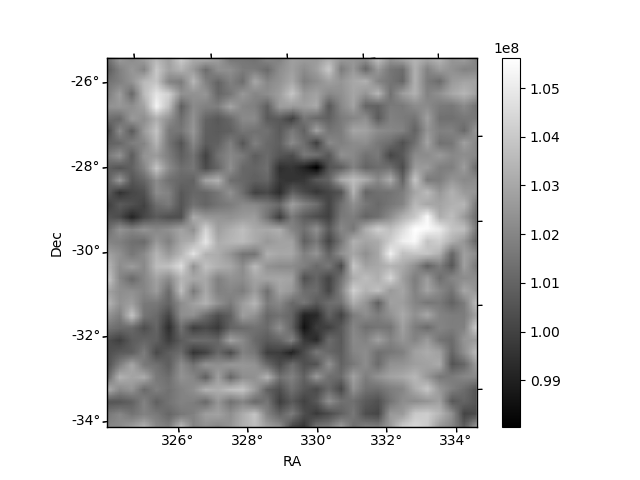
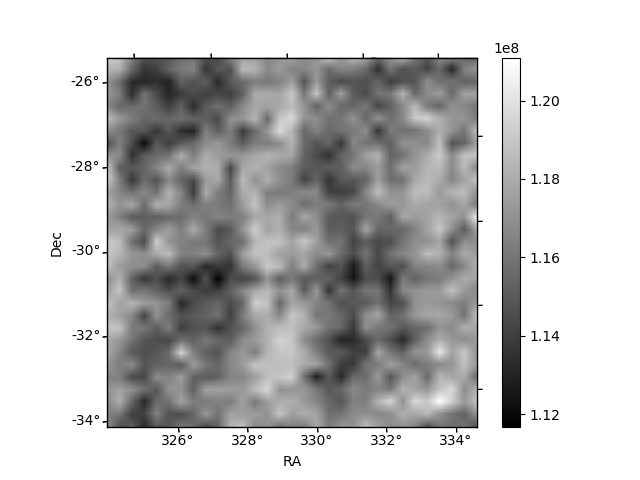
Histogram calculated using DETX and DETY for each event in the final _common_clean file
| Quadrant A | 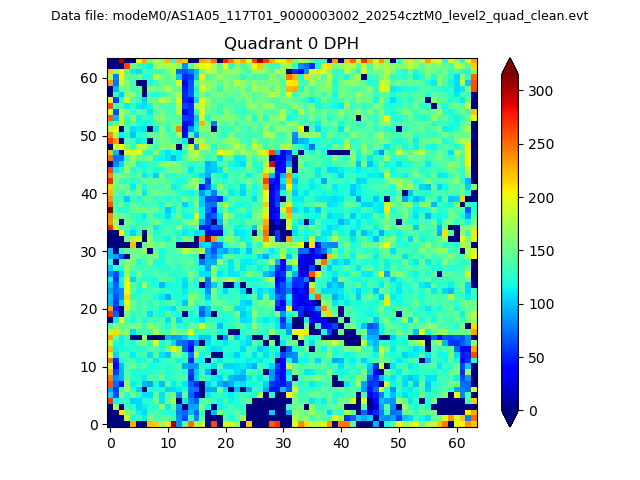 |
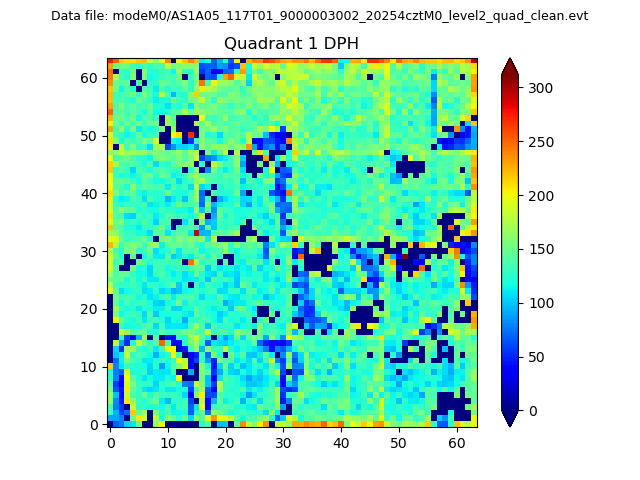 |
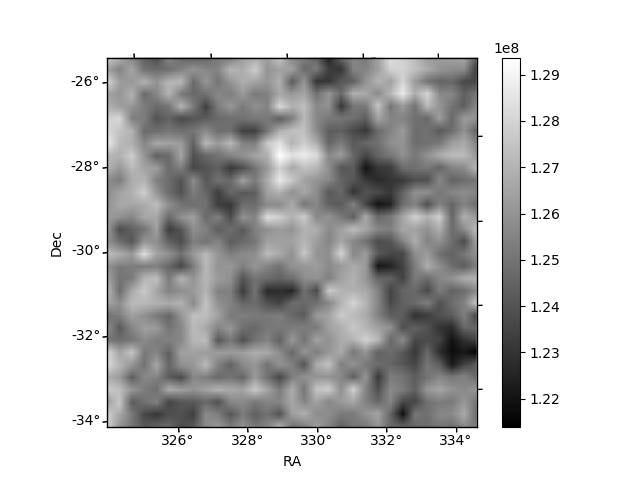
Quadrant B |
|---|---|---|---|
| Quadrant D | 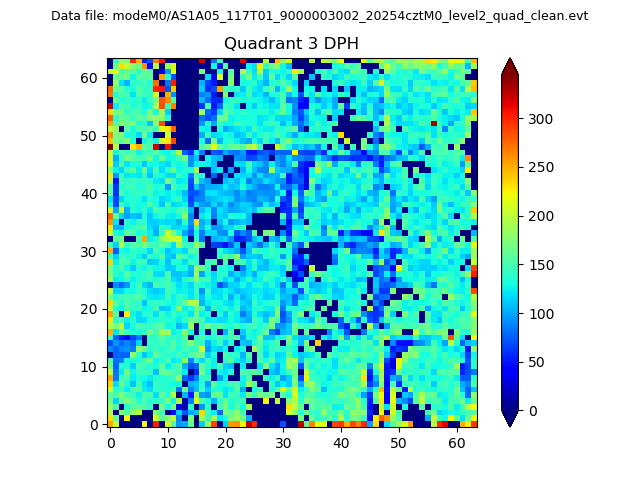 |
 |
Quadrant C |
| Plot type | Count rate plots | Images |
|---|---|---|
| Comparison with Poisson distribution Blue bars denote a histogram of data divided into 1 sec bins. Red curve is a Poisson curve with rate = median count rate of data. |
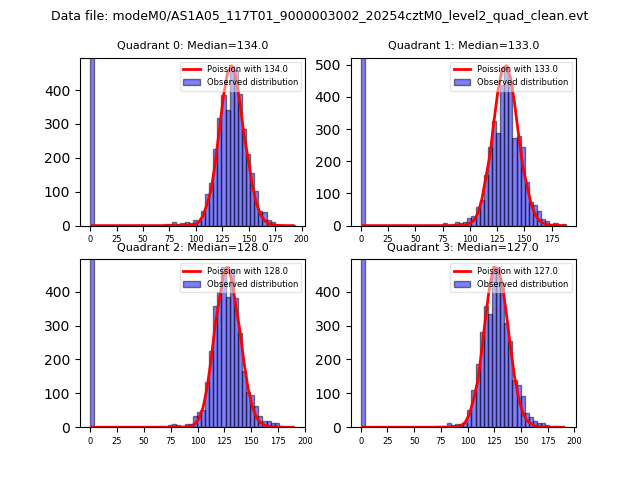 |
 |
| Quadrant-wise count rates Data is divided into 100 sec bins |
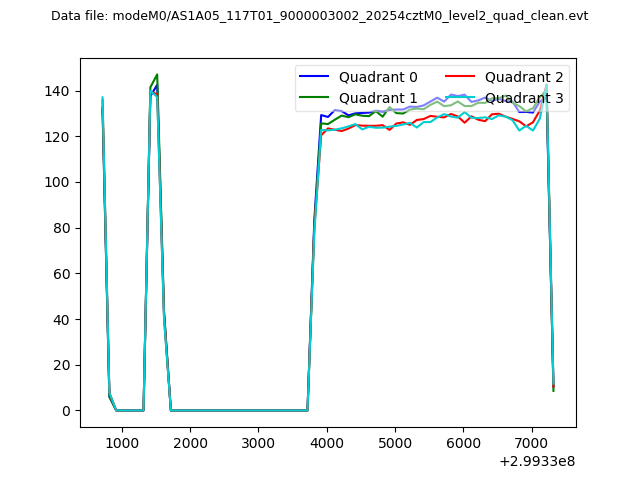 |
|
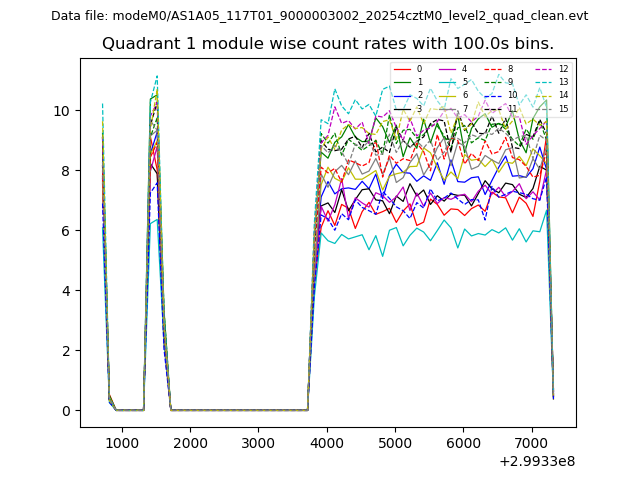
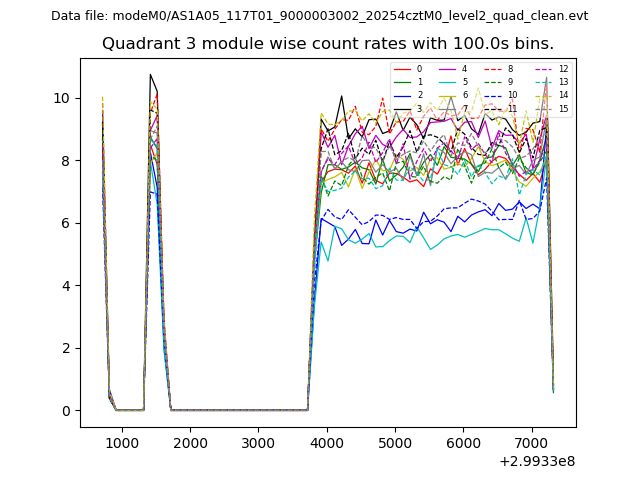
| Module-wise count rates for Quadrant A Data is divided into 100 sec bins |
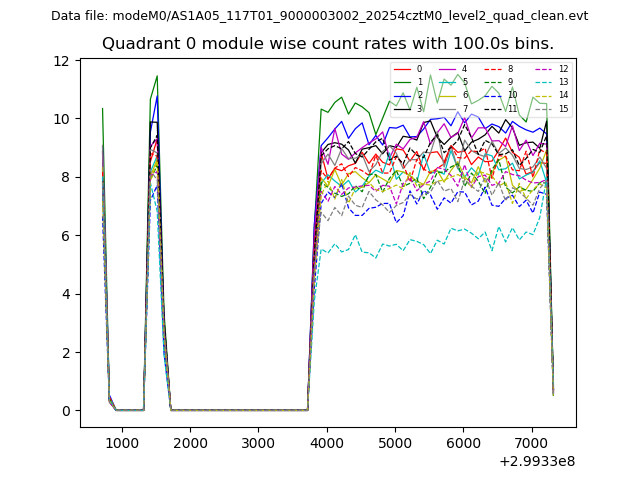 |
 |
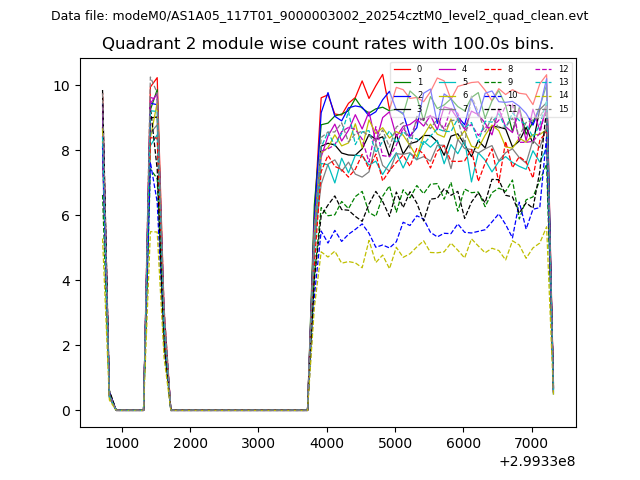
| Module-wise count rates for Quadrant B Data is divided into 100 sec bins |
 |
 |
| Module-wise count rates for Quadrant C Data is divided into 100 sec bins |
 |
 |
| Module-wise count rates for Quadrant D Data is divided into 100 sec bins |
 |
 |
| Parameter | Plot |
|---|---|
| CZT HV Monitor | 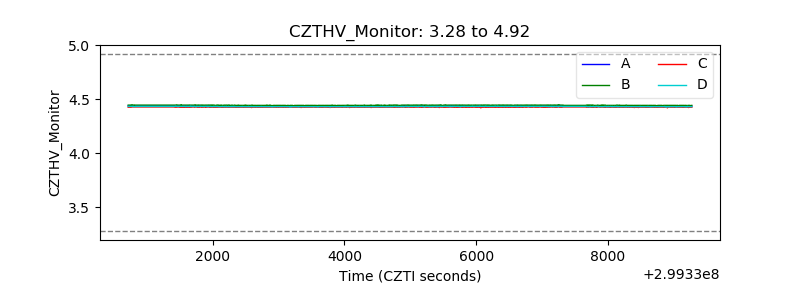 |
| D_VDD | 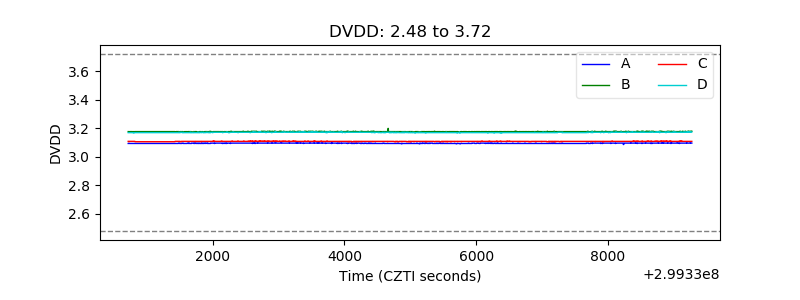 |
| Temperature 1 | 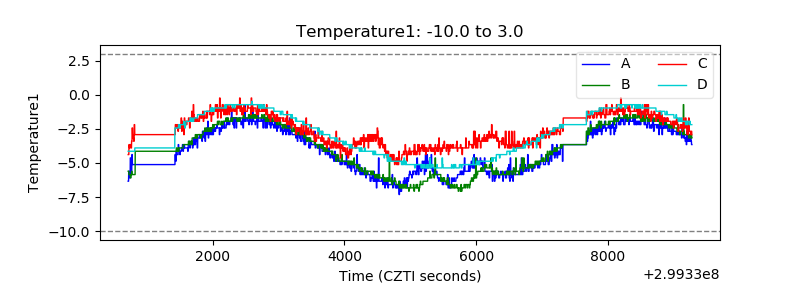 |
| Veto HV Monitor | 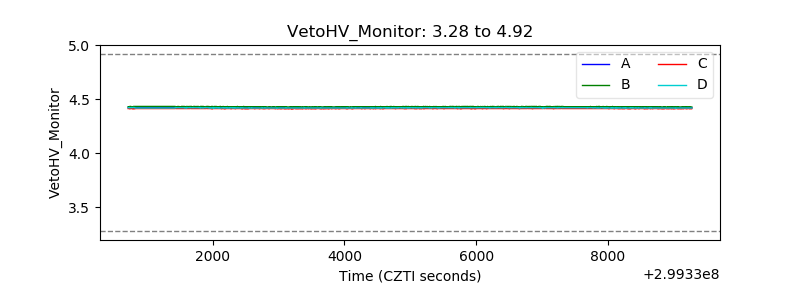 |
| Veto LLD | 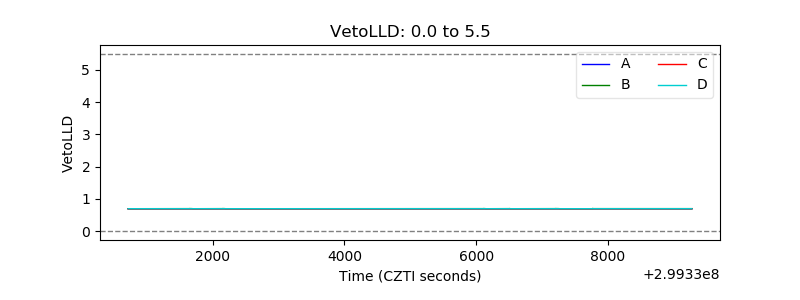 |
| Alpha Counter | 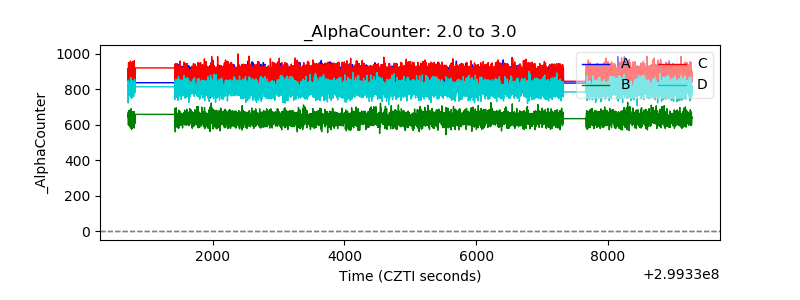 |
| _CPM_Rate | 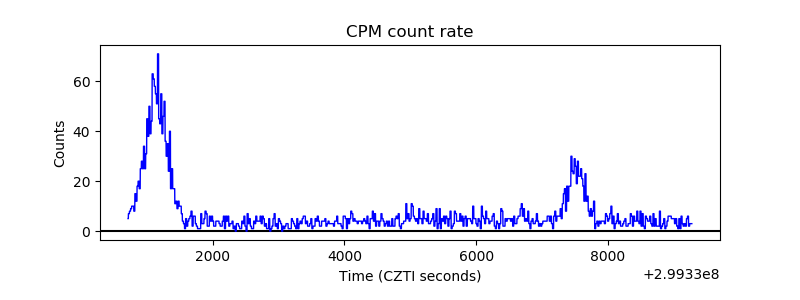 |
| CZT Counter | 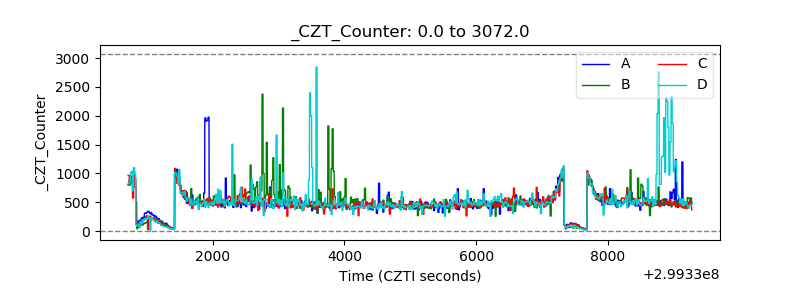 |
| +2.5 Volts monitor |  |
| +5 Volts monitor |  |
| _ROLL_ROT | 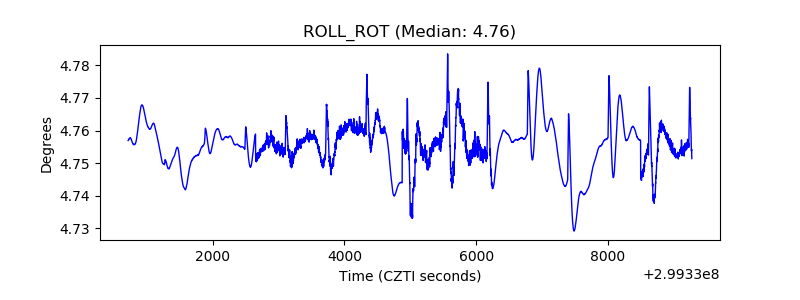 |
| _Roll_DEC |  |
| _Roll_RA | 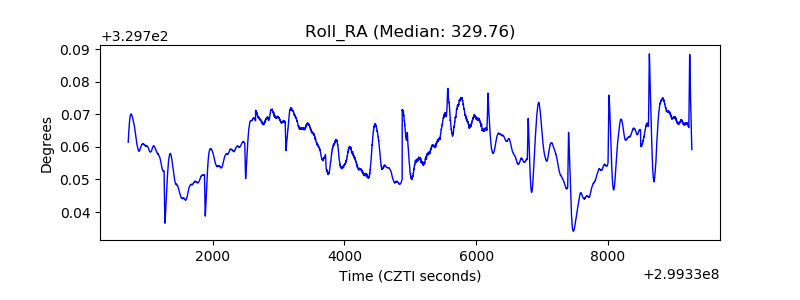 |
| Veto Counter | 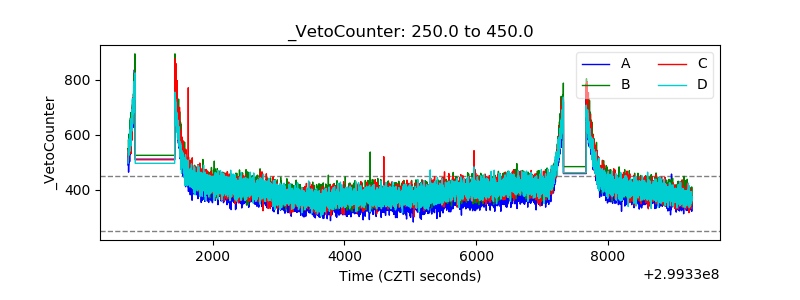 |