| Param | Original file | Final file |
|---|---|---|
| Filename | modeM0/AS1A05_117T01_9000003002_20255cztM0_level2.evt | modeM0/AS1A05_117T01_9000003002_20255cztM0_level2_quad_clean.evt |
| Size (bytes) | 572,489,280 | 83,773,440 |
| Size | 546.0 MB | 79.9 MB |
| Events in quadrant A | 4,197,791 | 513,132 |
| Events in quadrant B | 4,003,902 | 512,145 |
| Events in quadrant C | 4,020,302 | 486,088 |
| Events in quadrant D | 4,592,248 | 488,530 |
| Mode SS | |||
|---|---|---|---|
| Quadrant | BADHDUFLAG | Total packets | Discarded packets |
| A | 0 | 158 | 0 |
| B | 0 | 158 | 0 |
| C | 0 | 158 | 0 |
| D | 0 | 158 | 0 |
| Mode M9 | |||
|---|---|---|---|
| Quadrant | BADHDUFLAG | Total packets | Discarded packets |
| A | 0 | 7 | 0 |
| B | 0 | 7 | 0 |
| C | 0 | 7 | 0 |
| D | 0 | 7 | 0 |
| Mode M0 | |||
|---|---|---|---|
| Quadrant | BADHDUFLAG | Total packets | Discarded packets |
| A | 0 | 17398 | 2 |
| B | 0 | 16765 | 2 |
| C | 0 | 16721 | 2 |
| D | 0 | 18719 | 2 |
| Quadrant | Total seconds | Saturated seconds | Saturation percentage |
|---|---|---|---|
| A | 7721 | 249 | 3.224971% |
| B | 7721 | 235 | 3.043647% |
| C | 7721 | 262 | 3.393343% |
| D | 7721 | 257 | 3.328584% |
Noise dominated data is calculated using 1-second bins in cleaned event files. If a bin has >2000 counts, and if more than 50% of those come from <1% of pixels, then it is considered to be noise-dominated and hence unusable.
| Quadrant | # 1 sec bins | Bins with >0 counts | Bins with >2000 counts | High rate bins dominated by noise | Noise dominated (total time) | Noise dominated (detector-on time) | Marked lightcurve |
|---|---|---|---|---|---|---|---|
| A | 8451 | 7723 | 41 | 41 | 0.49% | 0.53% | 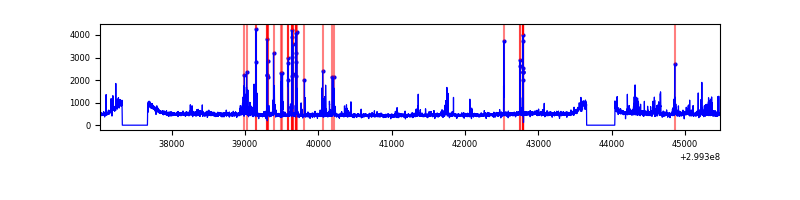 |
| B | 8451 | 7723 | 15 | 15 | 0.18% | 0.19% | 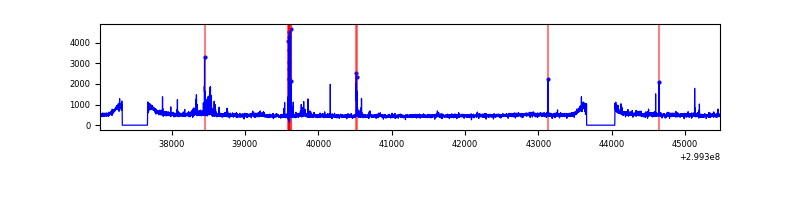 |
| C | 8451 | 7723 | 45 | 45 | 0.53% | 0.58% | 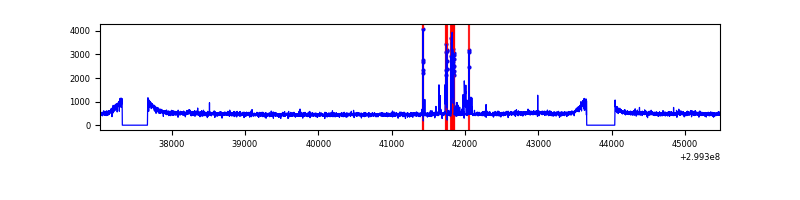 |
| D | 8451 | 7723 | 135 | 135 | 1.60% | 1.75% | 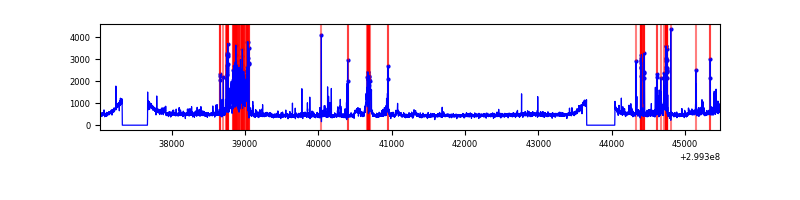 |
Top three noisy pixels from each quadrant. If the there are fewer than three noisy pixels in the level2.evt file, extra rows are filled as -1
| Pixel properties | Quadrant properties | ||||||
|---|---|---|---|---|---|---|---|
| Quadrant | DetID | PixID | Counts | Sigma | Mean | Median | Sigma |
| A | 14 | 238 | 312301 | 1569.79 | 973 | 951 | 198.3 |
| A | 12 | 96 | 118274 | 591.53 | 973 | 951 | 198.3 |
| A | 4 | 2 | 18282 | 87.38 | 973 | 951 | 198.3 |
| B | 6 | 36 | 58723 | 310.28 | 960 | 936 | 186.2 |
| B | 7 | 220 | 53217 | 280.71 | 960 | 936 | 186.2 |
| B | 0 | 230 | 30891 | 160.84 | 960 | 936 | 186.2 |
| C | 9 | 54 | 208384 | 948.9 | 923 | 928 | 218.6 |
| C | 14 | 238 | 142808 | 648.96 | 923 | 928 | 218.6 |
| C | 3 | 233 | 44012 | 197.07 | 923 | 928 | 218.6 |
| D | 7 | 238 | 568832 | 2443.35 | 947 | 920 | 232.4 |
| D | 9 | 1 | 169677 | 726.05 | 947 | 920 | 232.4 |
| D | 7 | 38 | 83608 | 355.75 | 947 | 920 | 232.4 |
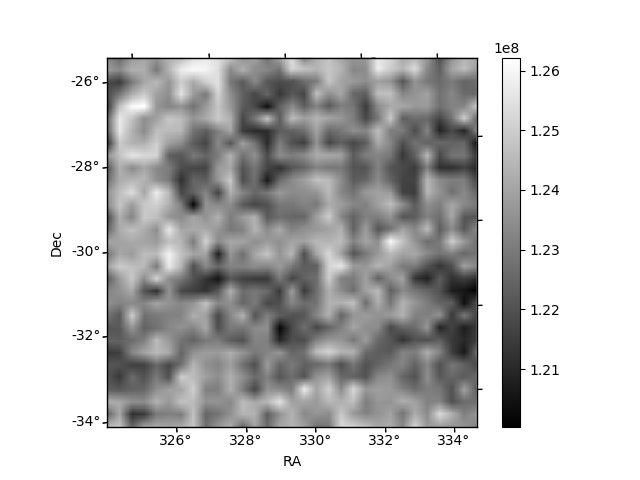
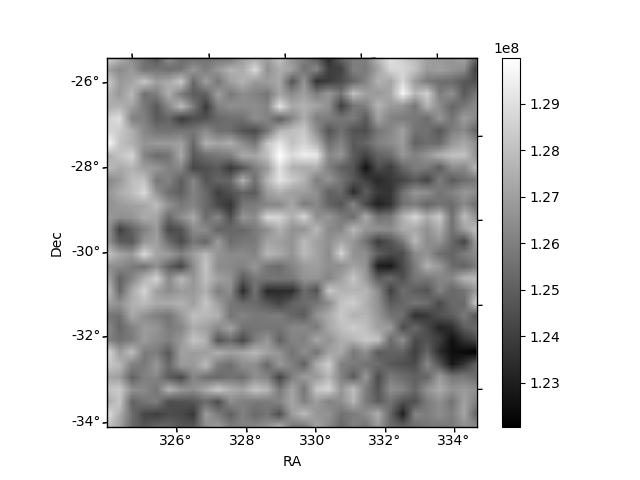
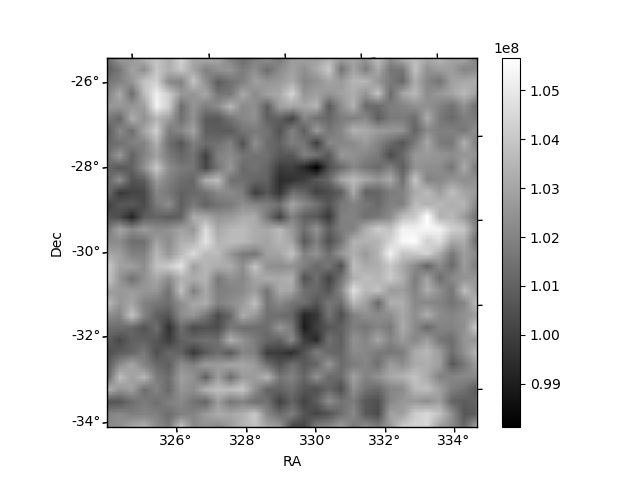
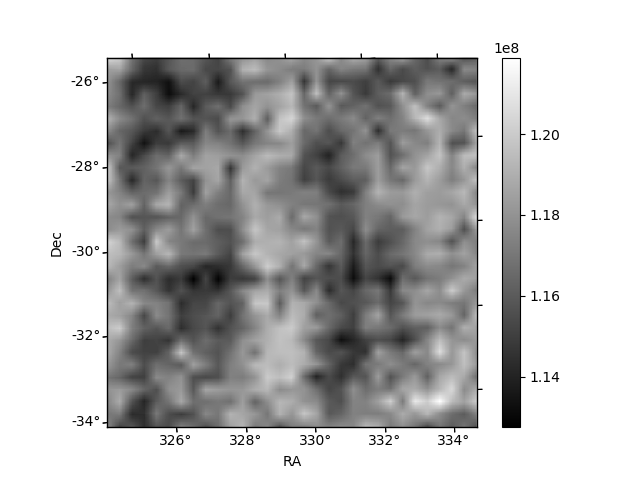
Histogram calculated using DETX and DETY for each event in the final _common_clean file
| Quadrant A | 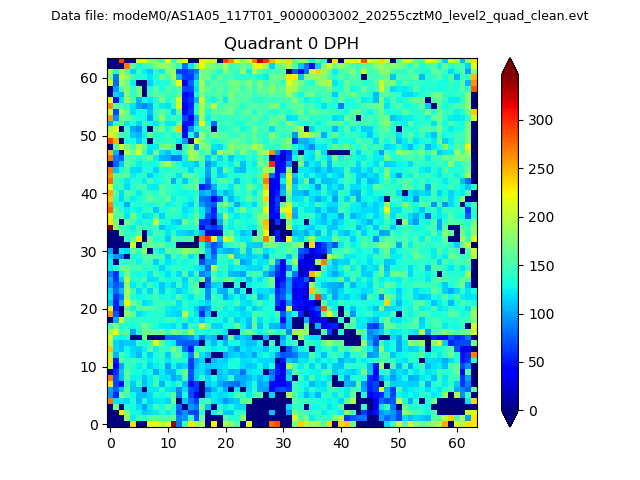 |
 |
Quadrant B |
|---|---|---|---|
| Quadrant D | 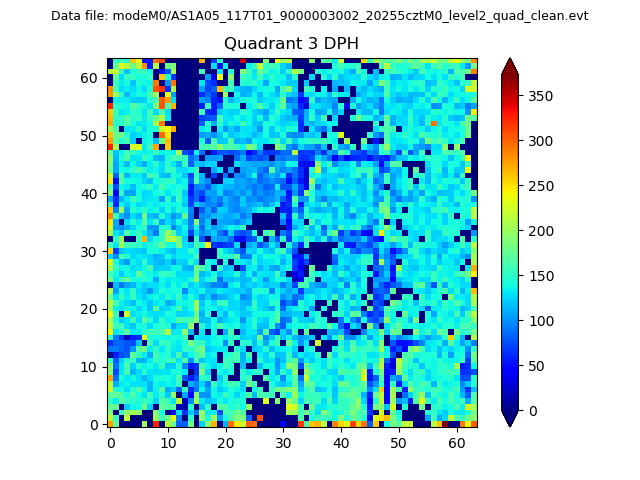 |
 |
Quadrant C |
| Plot type | Count rate plots | Images |
|---|---|---|
| Comparison with Poisson distribution Blue bars denote a histogram of data divided into 1 sec bins. Red curve is a Poisson curve with rate = median count rate of data. |
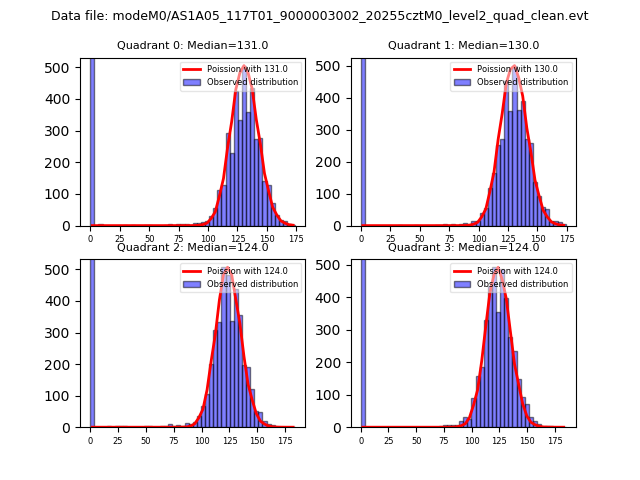 |
 |
| Quadrant-wise count rates Data is divided into 100 sec bins |
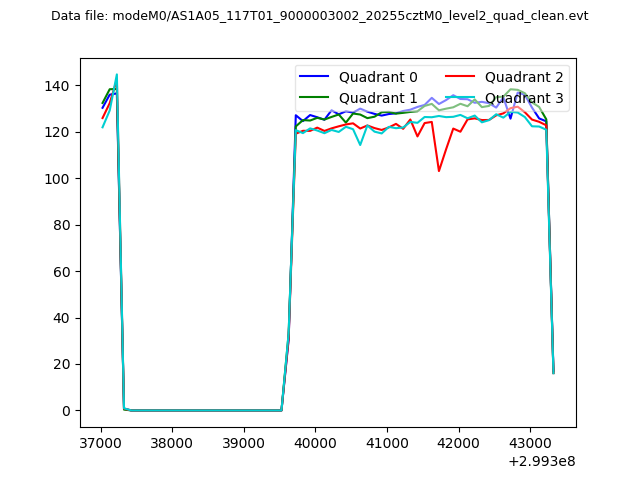 |
|
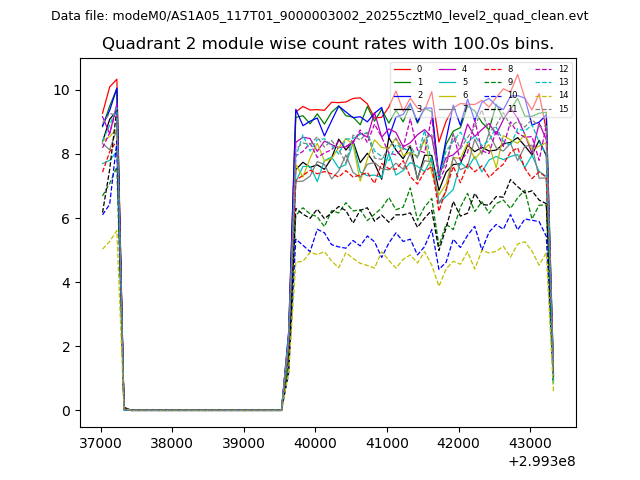
| Module-wise count rates for Quadrant A Data is divided into 100 sec bins |
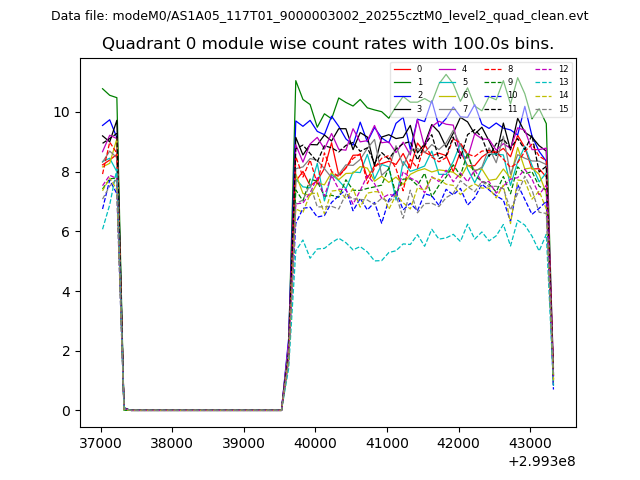 |
 |
| Module-wise count rates for Quadrant B Data is divided into 100 sec bins |
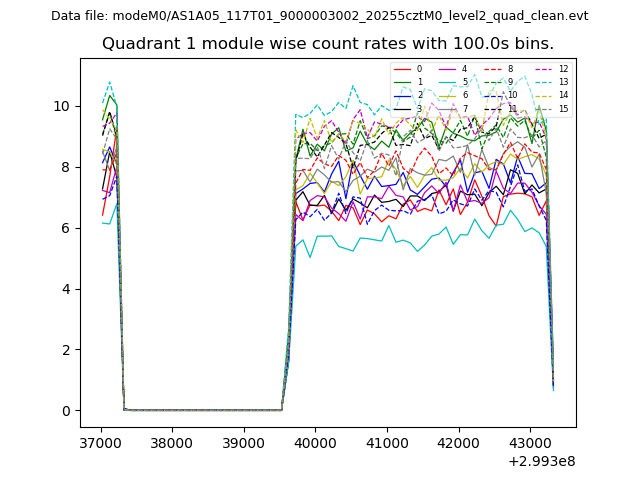 |
 |
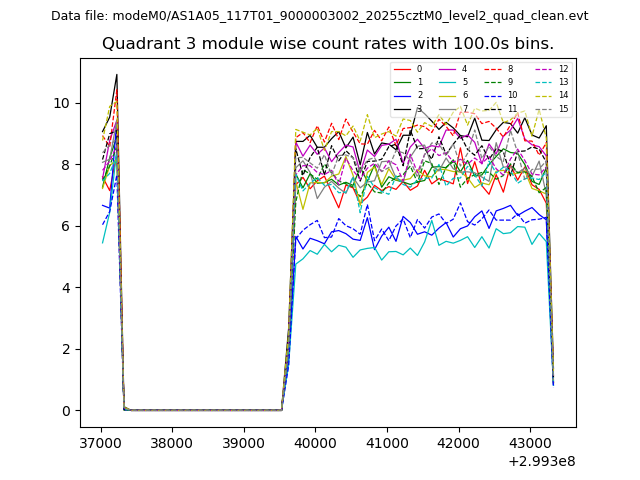
| Module-wise count rates for Quadrant C Data is divided into 100 sec bins |
 |
 |
| Module-wise count rates for Quadrant D Data is divided into 100 sec bins |
 |
 |
| Parameter | Plot |
|---|---|
| CZT HV Monitor | 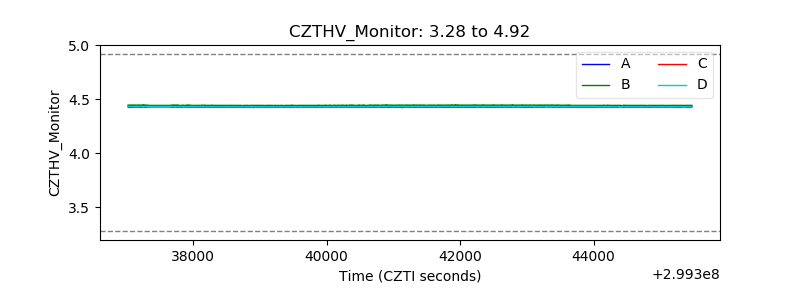 |
| D_VDD | 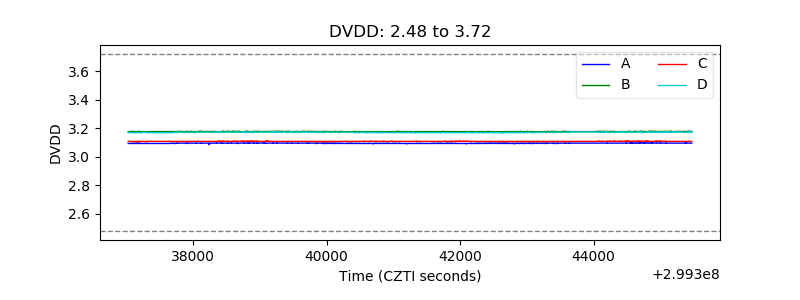 |
| Temperature 1 | 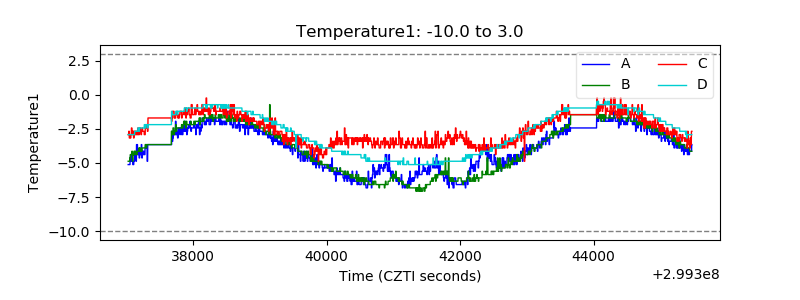 |
| Veto HV Monitor | 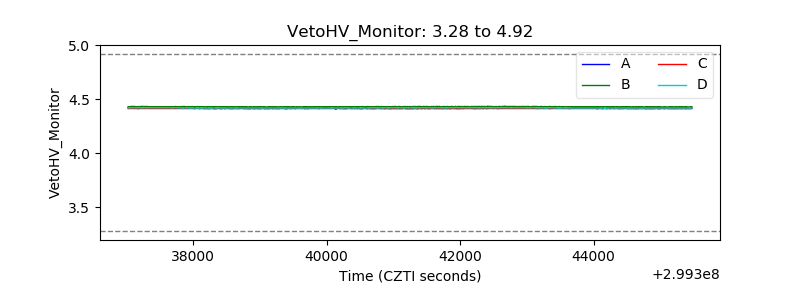 |
| Veto LLD | 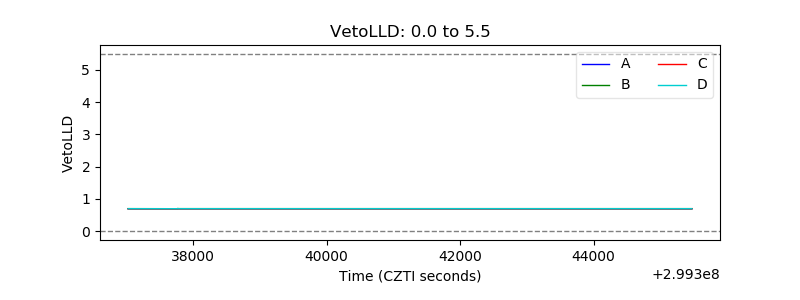 |
| Alpha Counter | 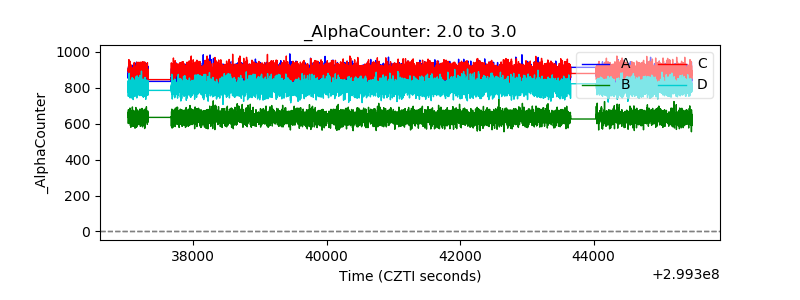 |
| _CPM_Rate | 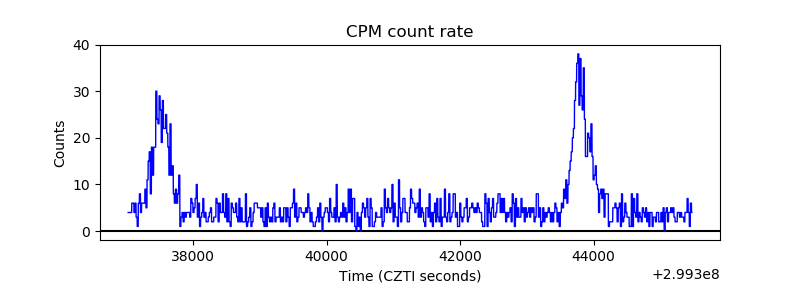 |
| CZT Counter | 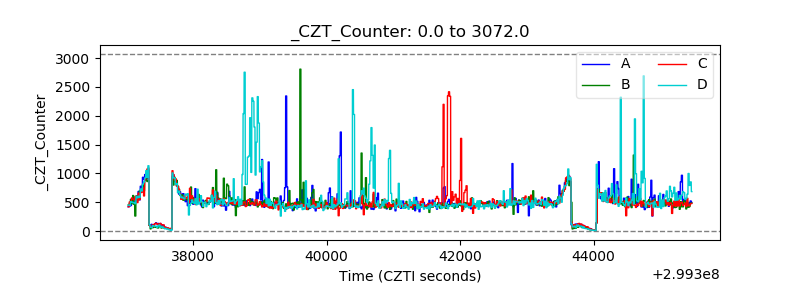 |
| +2.5 Volts monitor |  |
| +5 Volts monitor |  |
| _ROLL_ROT | 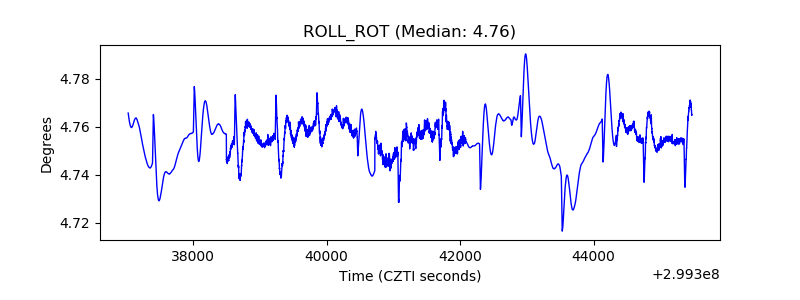 |
| _Roll_DEC | 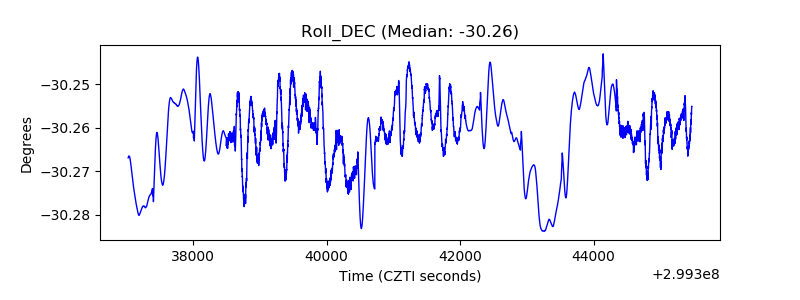 |
| _Roll_RA | 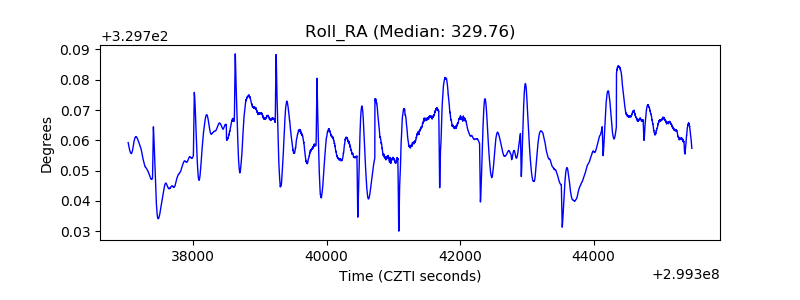 |
| Veto Counter | 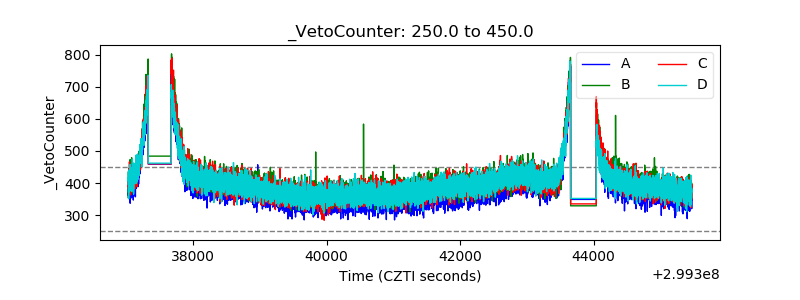 |