| Param | Original file | Final file |
|---|---|---|
| Filename | modeM0/AS1A05_117T01_9000003002_20258cztM0_level2.evt | modeM0/AS1A05_117T01_9000003002_20258cztM0_level2_quad_clean.evt |
| Size (bytes) | 1,476,696,960 | 242,688,960 |
| Size | 1.4 GB | 231.4 MB |
| Events in quadrant A | 10,507,819 | 1,543,490 |
| Events in quadrant B | 10,014,044 | 1,561,477 |
| Events in quadrant C | 9,064,643 | 1,503,064 |
| Events in quadrant D | 13,869,219 | 1,449,961 |
| Mode SS | |||
|---|---|---|---|
| Quadrant | BADHDUFLAG | Total packets | Discarded packets |
| A | 0 | 382 | 0 |
| B | 0 | 382 | 0 |
| C | 0 | 382 | 0 |
| D | 0 | 382 | 0 |
| Mode M9 | |||
|---|---|---|---|
| Quadrant | BADHDUFLAG | Total packets | Discarded packets |
| A | 0 | 24 | 0 |
| B | 0 | 24 | 0 |
| C | 0 | 24 | 0 |
| D | 0 | 24 | 0 |
| Mode M0 | |||
|---|---|---|---|
| Quadrant | BADHDUFLAG | Total packets | Discarded packets |
| A | 0 | 43352 | 4 |
| B | 0 | 41752 | 4 |
| C | 0 | 38539 | 4 |
| D | 0 | 53825 | 4 |
| Quadrant | Total seconds | Saturated seconds | Saturation percentage |
|---|---|---|---|
| A | 18760 | 696 | 3.710021% |
| B | 18761 | 453 | 2.414583% |
| C | 18761 | 271 | 1.444486% |
| D | 18761 | 970 | 5.170300% |
Noise dominated data is calculated using 1-second bins in cleaned event files. If a bin has >2000 counts, and if more than 50% of those come from <1% of pixels, then it is considered to be noise-dominated and hence unusable.
| Quadrant | # 1 sec bins | Bins with >0 counts | Bins with >2000 counts | High rate bins dominated by noise | Noise dominated (total time) | Noise dominated (detector-on time) | Marked lightcurve |
|---|---|---|---|---|---|---|---|
| A | 21120 | 18764 | 339 | 339 | 1.61% | 1.81% | 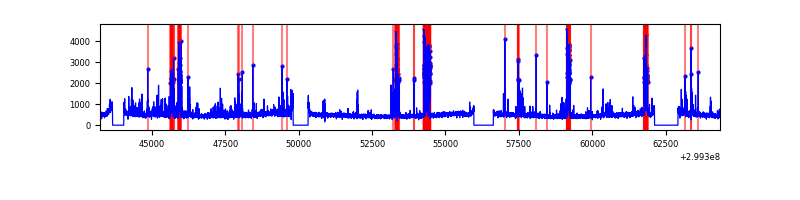 |
| B | 21121 | 18765 | 131 | 131 | 0.62% | 0.70% | 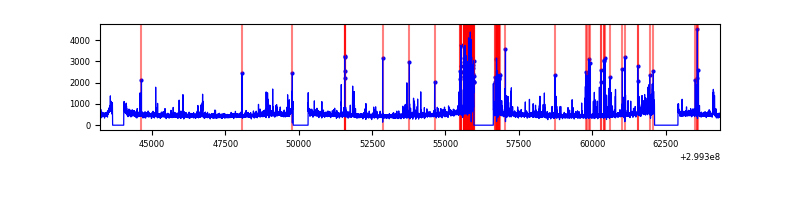 |
| C | 21121 | 18765 | 0 | 0 | 0.00% | 0.00% | 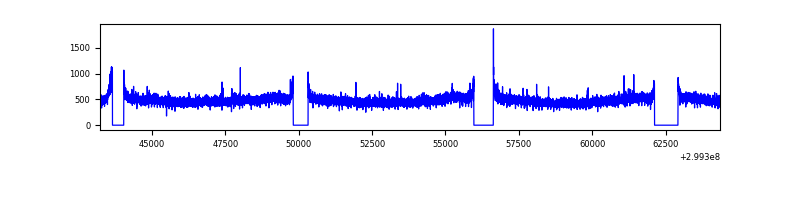 |
| D | 21121 | 18765 | 779 | 779 | 3.69% | 4.15% | 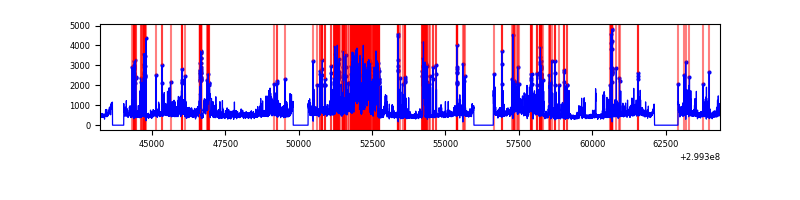 |
Top three noisy pixels from each quadrant. If the there are fewer than three noisy pixels in the level2.evt file, extra rows are filled as -1
| Pixel properties | Quadrant properties | ||||||
|---|---|---|---|---|---|---|---|
| Quadrant | DetID | PixID | Counts | Sigma | Mean | Median | Sigma |
| A | 14 | 238 | 602977 | 1322.71 | 2254 | 2204 | 454.2 |
| A | 12 | 96 | 532345 | 1167.2 | 2254 | 2204 | 454.2 |
| A | 9 | 143 | 458113 | 1003.77 | 2254 | 2204 | 454.2 |
| B | 4 | 142 | 277647 | 644.45 | 2255 | 2198 | 427.4 |
| B | 7 | 220 | 251690 | 583.72 | 2255 | 2198 | 427.4 |
| B | 0 | 85 | 245930 | 570.24 | 2255 | 2198 | 427.4 |
| C | 14 | 238 | 341387 | 658.45 | 2191 | 2205 | 515.1 |
| C | 3 | 233 | 95826 | 181.74 | 2191 | 2205 | 515.1 |
| C | 3 | 9 | 82538 | 155.95 | 2191 | 2205 | 515.1 |
| D | 7 | 238 | 2353999 | 4381.22 | 2199 | 2139 | 536.8 |
| D | 1 | 52 | 2238998 | 4166.99 | 2199 | 2139 | 536.8 |
| D | 2 | 16 | 451771 | 837.61 | 2199 | 2139 | 536.8 |
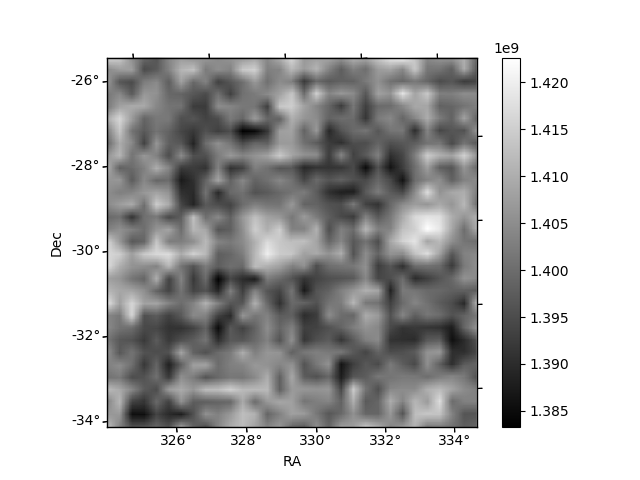
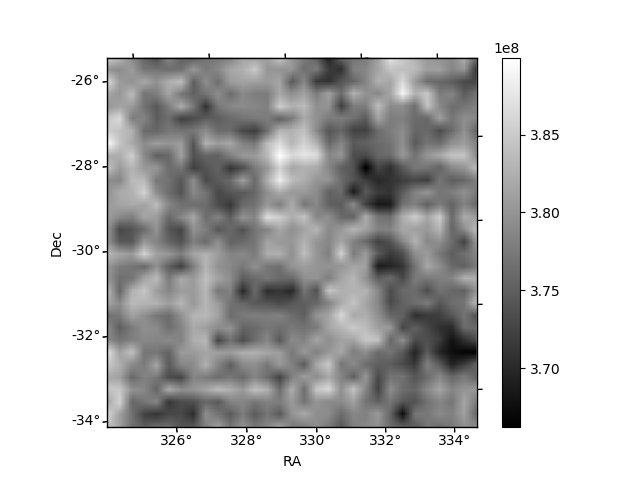
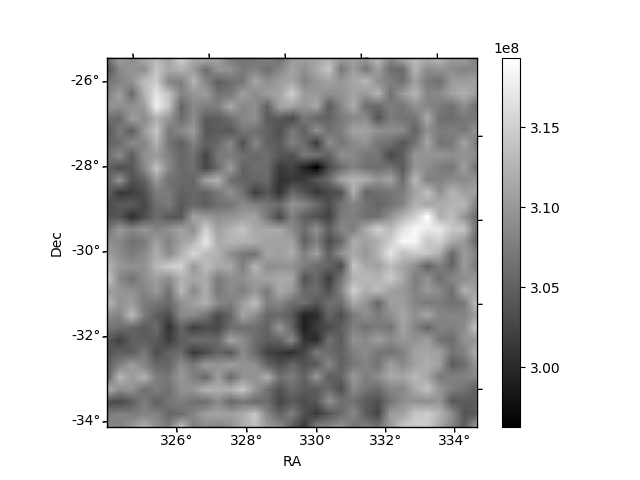
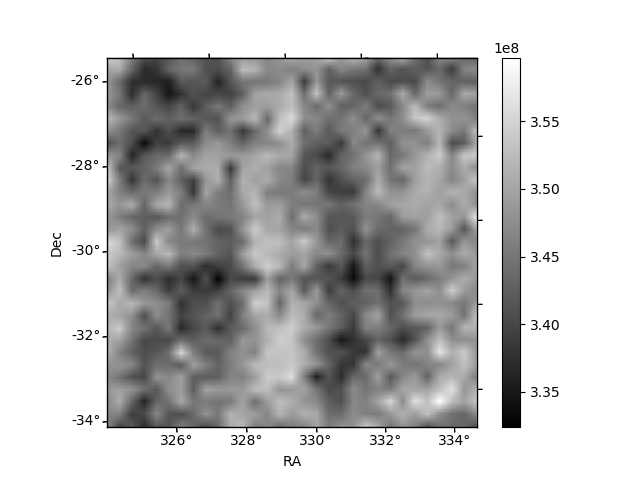
Histogram calculated using DETX and DETY for each event in the final _common_clean file
| Quadrant A | 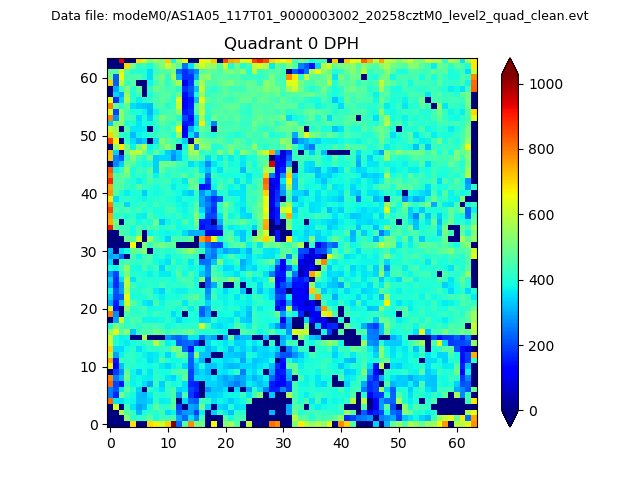 |
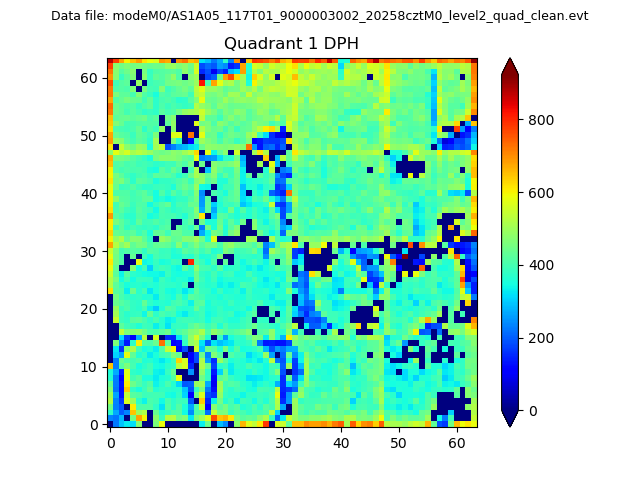 |
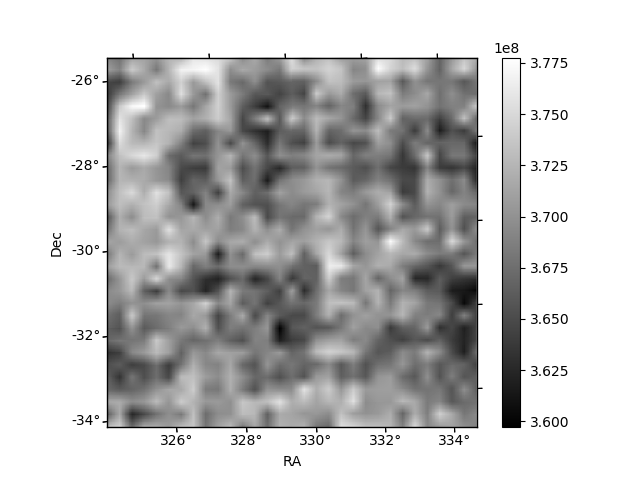
Quadrant B |
|---|---|---|---|
| Quadrant D |  |
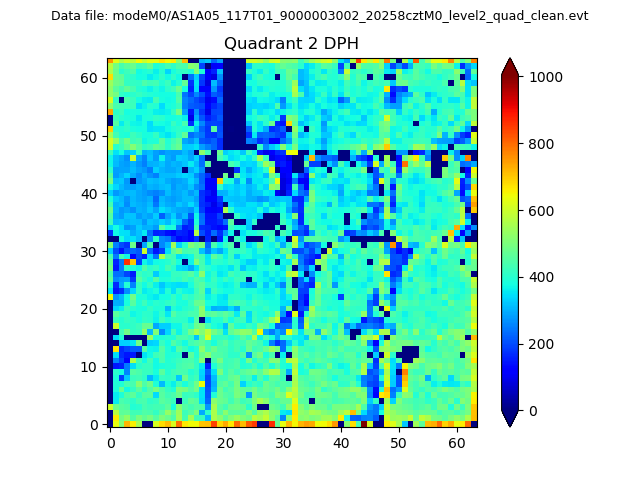 |
Quadrant C |
| Plot type | Count rate plots | Images |
|---|---|---|
| Comparison with Poisson distribution Blue bars denote a histogram of data divided into 1 sec bins. Red curve is a Poisson curve with rate = median count rate of data. |
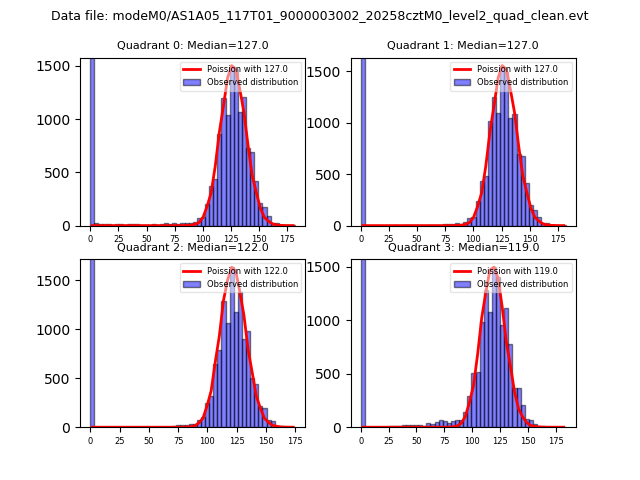 |
 |
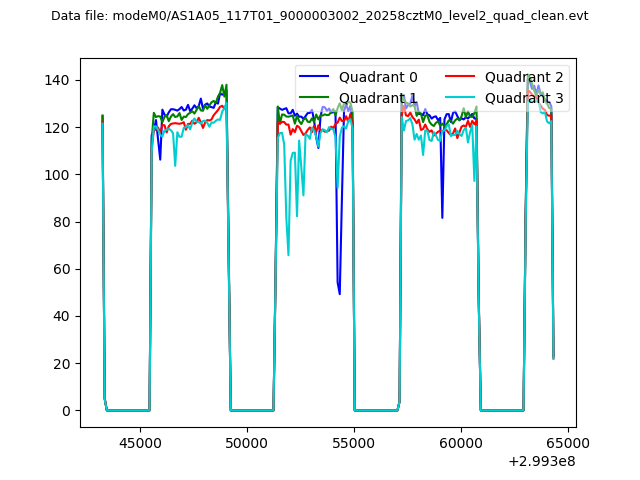
| Quadrant-wise count rates Data is divided into 100 sec bins |
 |
|
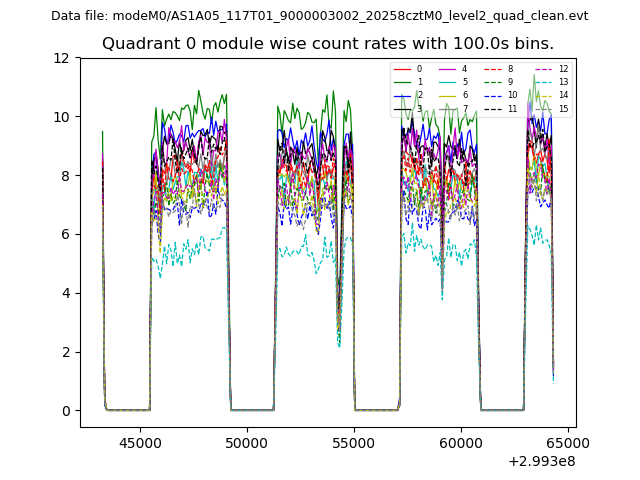
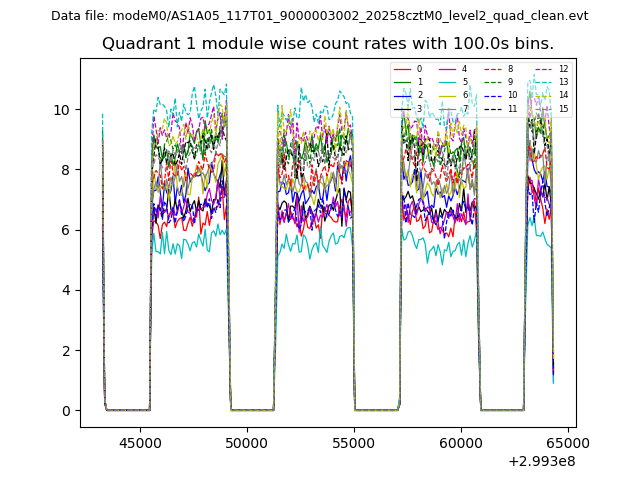
| Module-wise count rates for Quadrant A Data is divided into 100 sec bins |
 |
 |
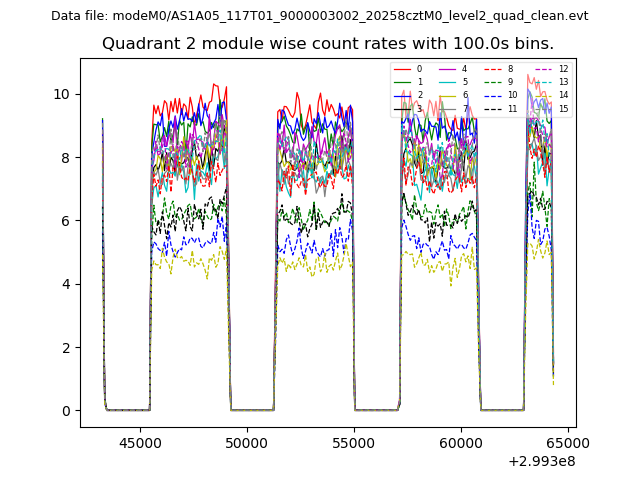
| Module-wise count rates for Quadrant B Data is divided into 100 sec bins |
 |
 |
| Module-wise count rates for Quadrant C Data is divided into 100 sec bins |
 |
 |
| Module-wise count rates for Quadrant D Data is divided into 100 sec bins |
 |
 |
| Parameter | Plot |
|---|---|
| CZT HV Monitor | 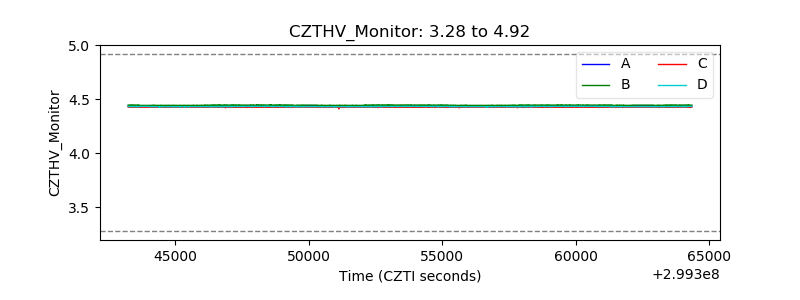 |
| D_VDD | 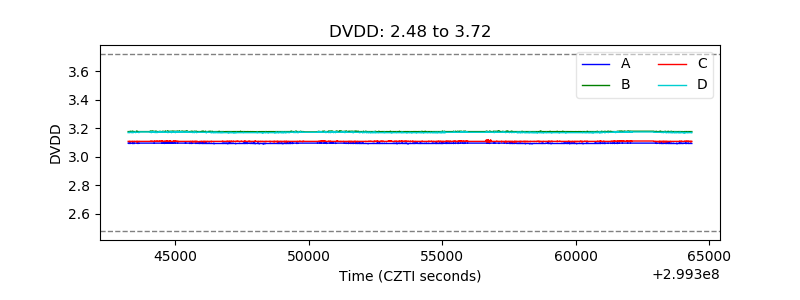 |
| Temperature 1 | 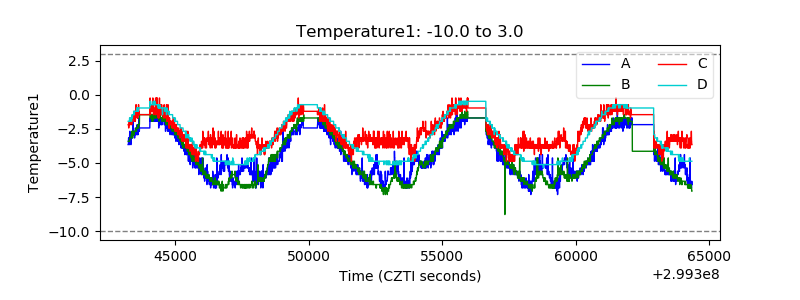 |
| Veto HV Monitor | 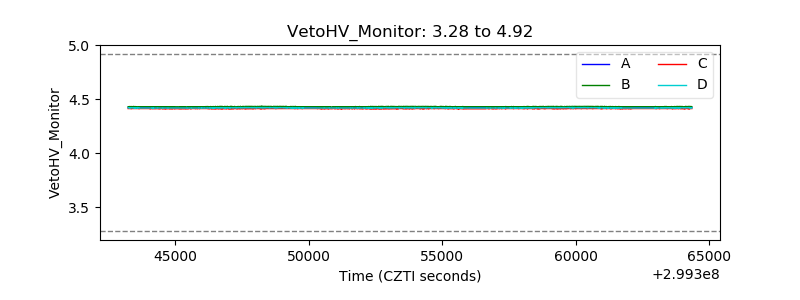 |
| Veto LLD | 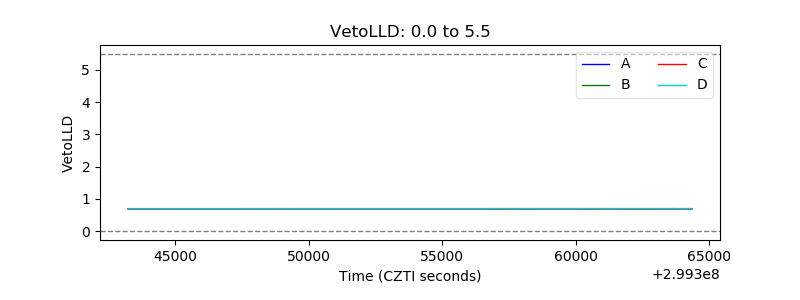 |
| Alpha Counter | 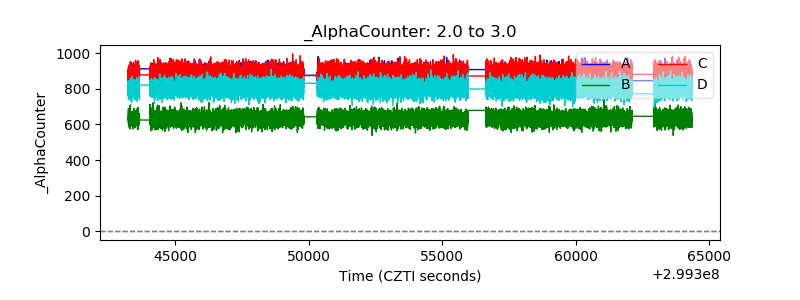 |
| _CPM_Rate | 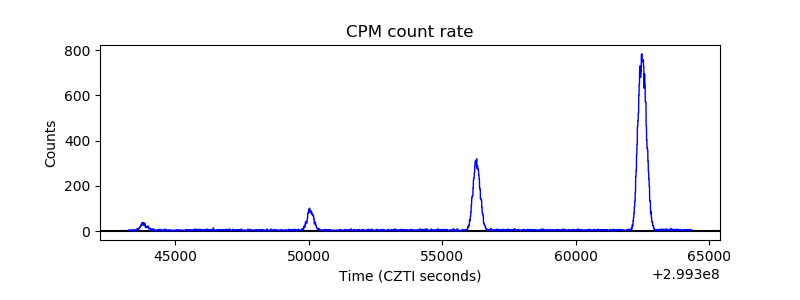 |
| CZT Counter | 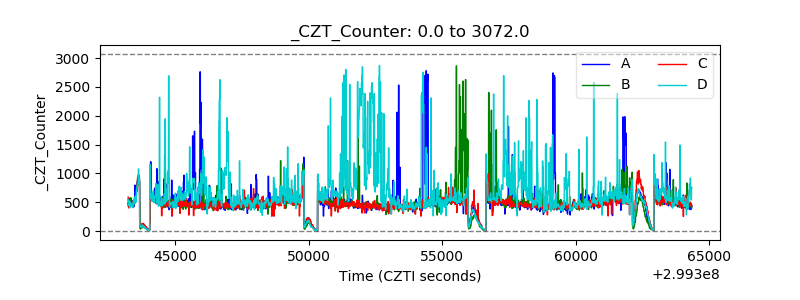 |
| +2.5 Volts monitor |  |
| +5 Volts monitor |  |
| _ROLL_ROT | 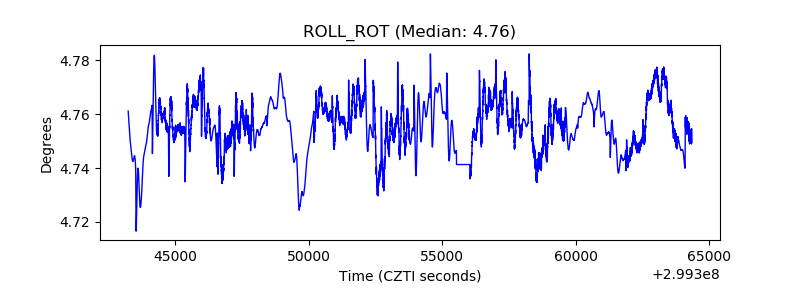 |
| _Roll_DEC | 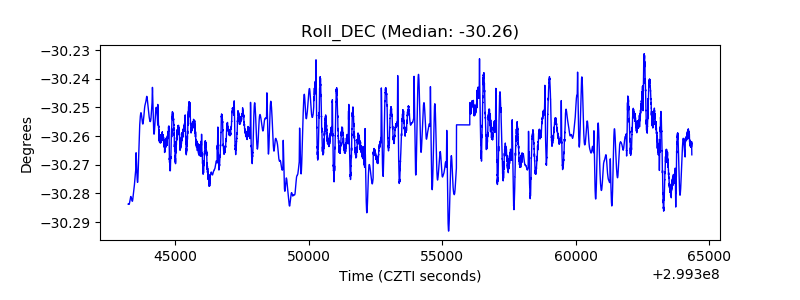 |
| _Roll_RA | 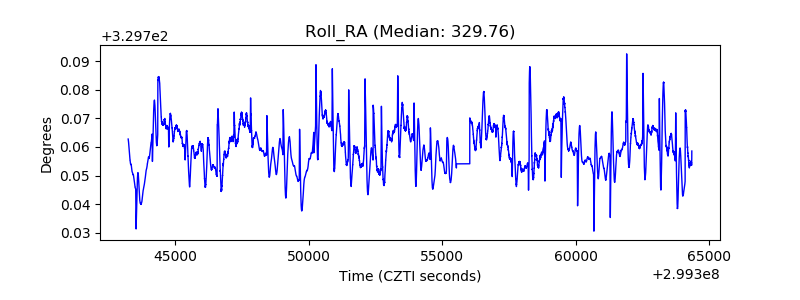 |
| Veto Counter |  |