| Param | Original file | Final file |
|---|---|---|
| Filename | modeM0/AS1A05_117T01_9000003002_20259cztM0_level2.evt | modeM0/AS1A05_117T01_9000003002_20259cztM0_level2_quad_clean.evt |
| Size (bytes) | 594,858,240 | 103,268,160 |
| Size | 567.3 MB | 98.5 MB |
| Events in quadrant A | 4,244,630 | 659,490 |
| Events in quadrant B | 4,214,213 | 668,196 |
| Events in quadrant C | 3,773,853 | 644,709 |
| Events in quadrant D | 5,268,967 | 627,988 |
| Mode SS | |||
|---|---|---|---|
| Quadrant | BADHDUFLAG | Total packets | Discarded packets |
| A | 0 | 156 | 0 |
| B | 0 | 156 | 0 |
| C | 0 | 156 | 0 |
| D | 0 | 156 | 0 |
| Mode M9 | |||
|---|---|---|---|
| Quadrant | BADHDUFLAG | Total packets | Discarded packets |
| A | 0 | 18 | 0 |
| B | 0 | 18 | 0 |
| C | 0 | 18 | 0 |
| D | 0 | 18 | 0 |
| Mode M0 | |||
|---|---|---|---|
| Quadrant | BADHDUFLAG | Total packets | Discarded packets |
| A | 0 | 17455 | 2 |
| B | 0 | 17483 | 2 |
| C | 0 | 15843 | 2 |
| D | 0 | 20857 | 3 |
| Quadrant | Total seconds | Saturated seconds | Saturation percentage |
|---|---|---|---|
| A | 7574 | 256 | 3.379984% |
| B | 7575 | 174 | 2.297030% |
| C | 7575 | 103 | 1.359736% |
| D | 7574 | 324 | 4.277792% |
Noise dominated data is calculated using 1-second bins in cleaned event files. If a bin has >2000 counts, and if more than 50% of those come from <1% of pixels, then it is considered to be noise-dominated and hence unusable.
| Quadrant | # 1 sec bins | Bins with >0 counts | Bins with >2000 counts | High rate bins dominated by noise | Noise dominated (total time) | Noise dominated (detector-on time) | Marked lightcurve |
|---|---|---|---|---|---|---|---|
| A | 9354 | 7576 | 119 | 119 | 1.27% | 1.57% | 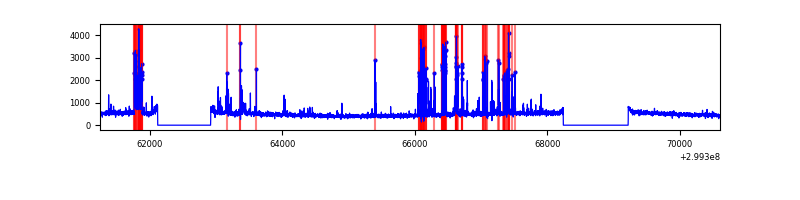 |
| B | 9355 | 7577 | 53 | 53 | 0.57% | 0.70% | 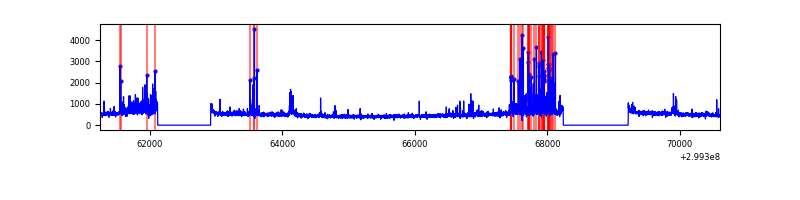 |
| C | 9355 | 7577 | 1 | 1 | 0.01% | 0.01% | 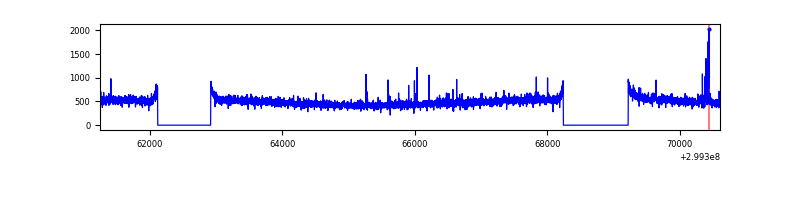 |
| D | 9354 | 7576 | 171 | 171 | 1.83% | 2.26% | 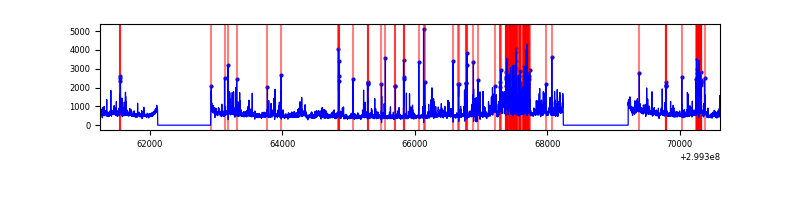 |
Top three noisy pixels from each quadrant. If the there are fewer than three noisy pixels in the level2.evt file, extra rows are filled as -1
| Pixel properties | Quadrant properties | ||||||
|---|---|---|---|---|---|---|---|
| Quadrant | DetID | PixID | Counts | Sigma | Mean | Median | Sigma |
| A | 14 | 238 | 554918 | 2919.43 | 932 | 911 | 189.8 |
| A | 4 | 2 | 68181 | 354.49 | 932 | 911 | 189.8 |
| A | 12 | 96 | 19174 | 96.24 | 932 | 911 | 189.8 |
| B | 7 | 220 | 310951 | 1719.61 | 932 | 908 | 180.3 |
| B | 0 | 244 | 63940 | 349.6 | 932 | 908 | 180.3 |
| B | 0 | 230 | 57005 | 311.13 | 932 | 908 | 180.3 |
| C | 14 | 238 | 140337 | 651.71 | 909 | 913 | 213.9 |
| C | 3 | 233 | 66936 | 308.61 | 909 | 913 | 213.9 |
| C | 0 | 207 | 11951 | 51.6 | 909 | 913 | 213.9 |
| D | 1 | 52 | 1263686 | 5728.77 | 907 | 883 | 220.4 |
| D | 2 | 16 | 428640 | 1940.54 | 907 | 883 | 220.4 |
| D | 2 | 234 | 47418 | 211.11 | 907 | 883 | 220.4 |
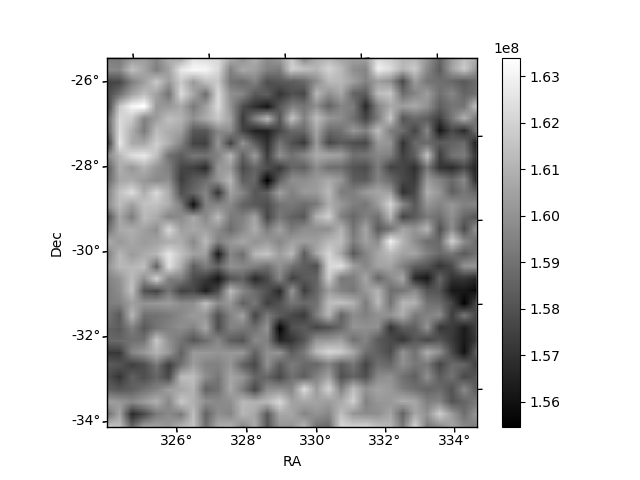
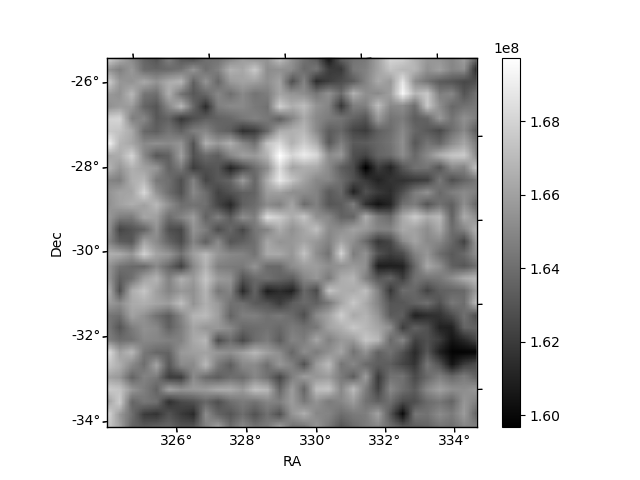
Histogram calculated using DETX and DETY for each event in the final _common_clean file
| Quadrant A | 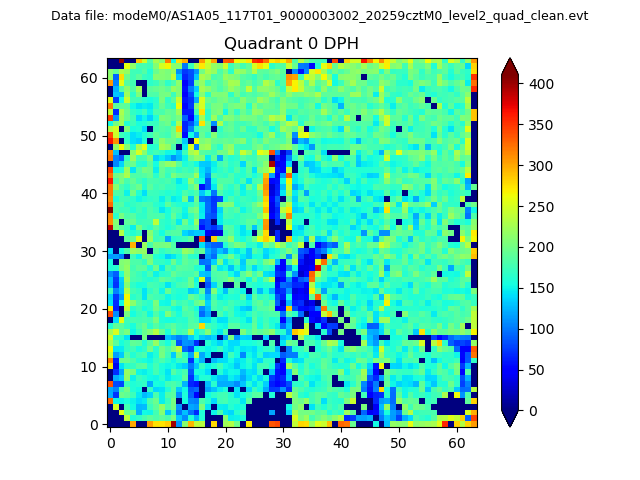 |
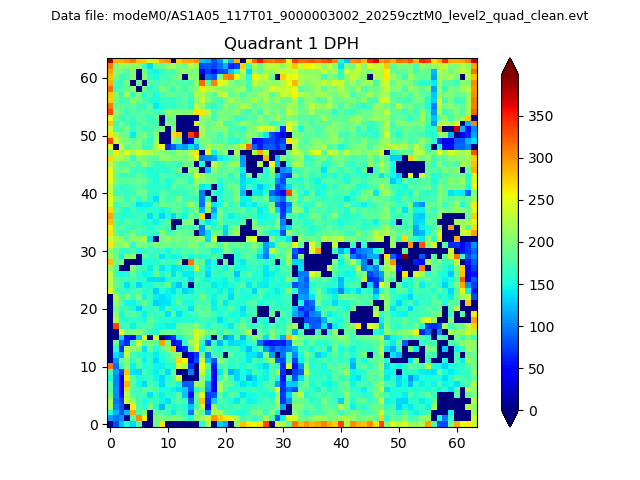 |
Quadrant B |
|---|---|---|---|
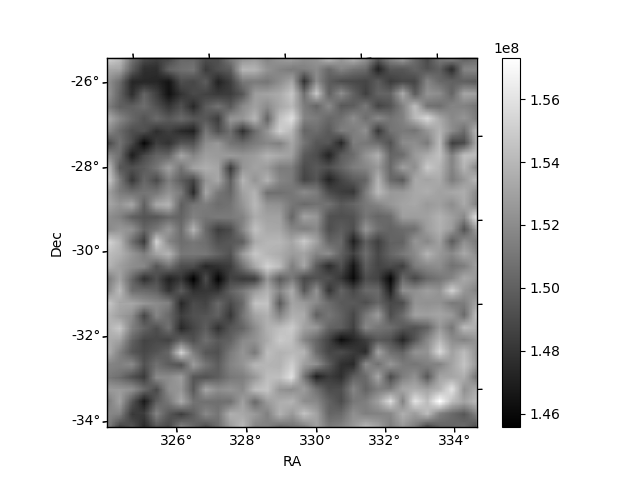
| Quadrant D |  |
 |
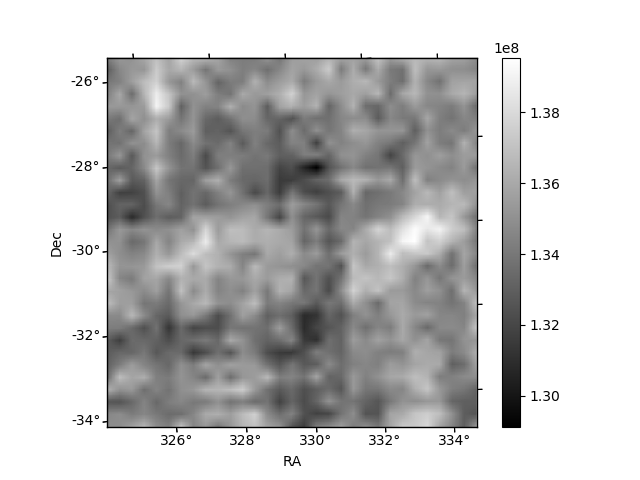
Quadrant C |
| Plot type | Count rate plots | Images |
|---|---|---|
| Comparison with Poisson distribution Blue bars denote a histogram of data divided into 1 sec bins. Red curve is a Poisson curve with rate = median count rate of data. |
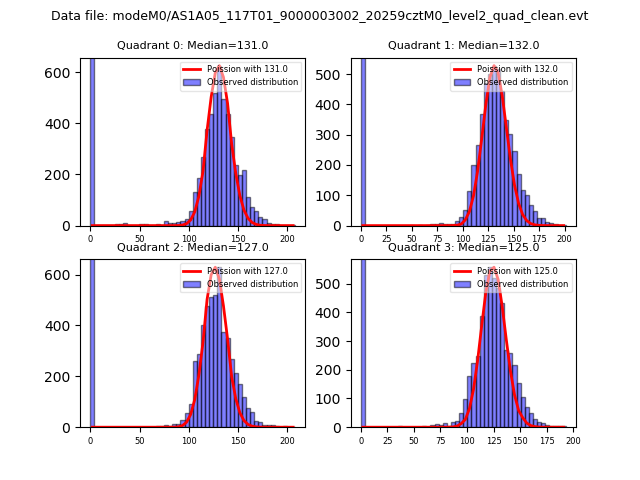 |
 |
| Quadrant-wise count rates Data is divided into 100 sec bins |
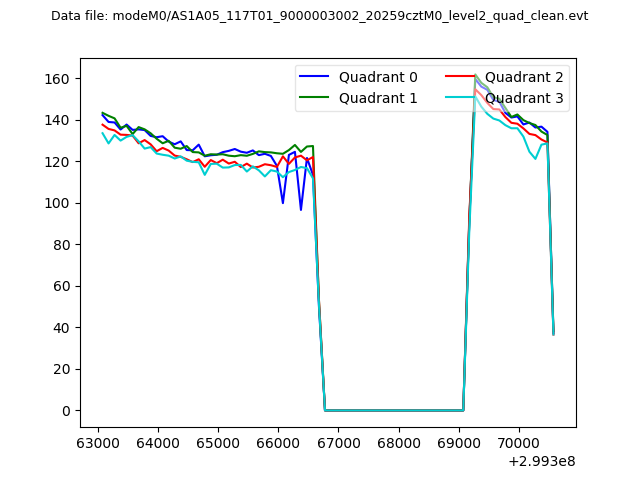 |
|
| Module-wise count rates for Quadrant A Data is divided into 100 sec bins |
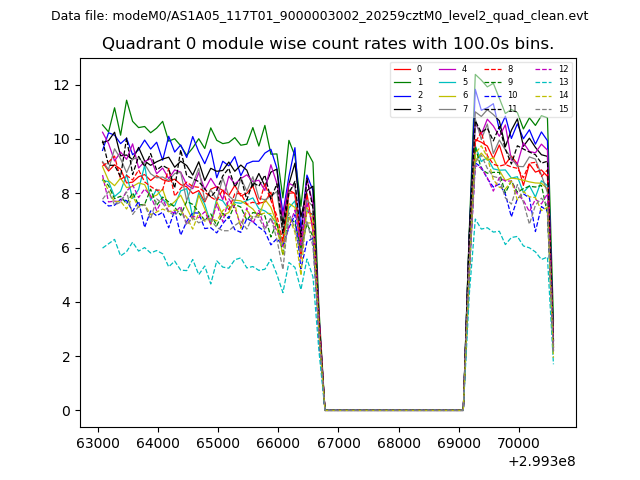 |
 |
| Module-wise count rates for Quadrant B Data is divided into 100 sec bins |
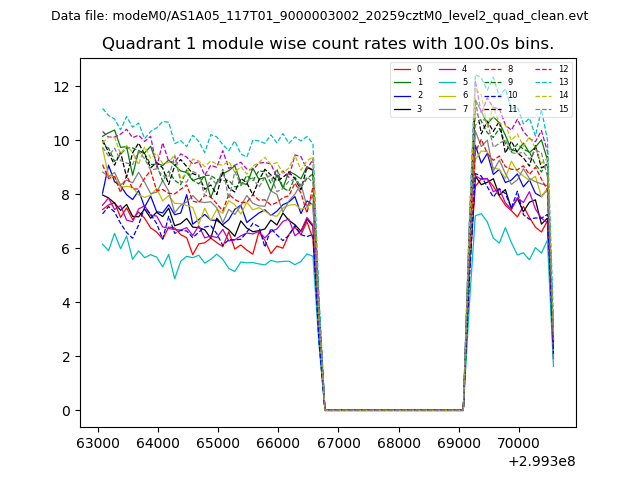 |
 |
| Module-wise count rates for Quadrant C Data is divided into 100 sec bins |
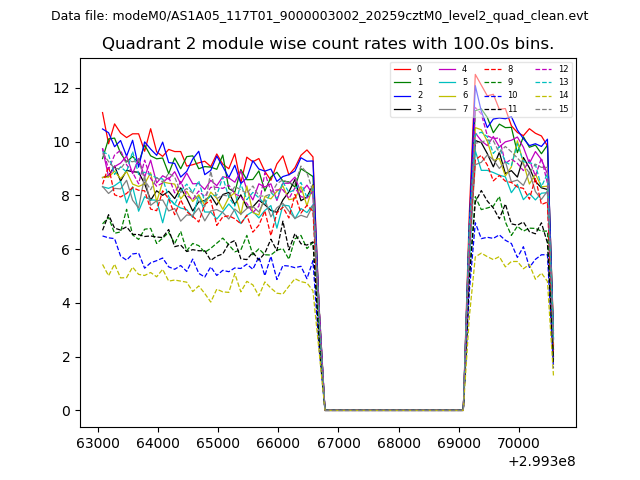 |
 |
| Module-wise count rates for Quadrant D Data is divided into 100 sec bins |
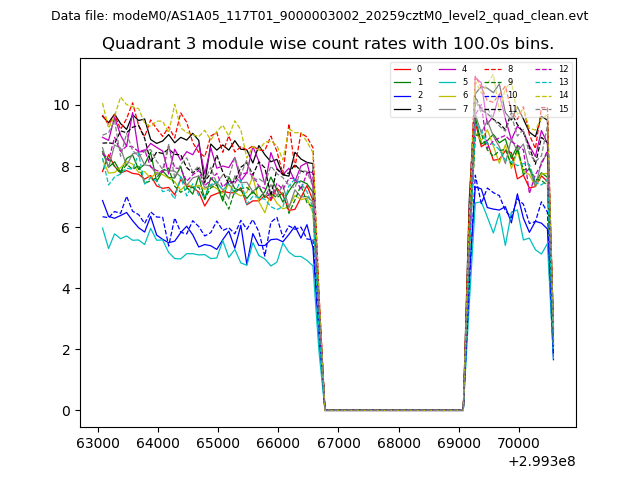 |
 |
| Parameter | Plot |
|---|---|
| CZT HV Monitor |  |
| D_VDD | 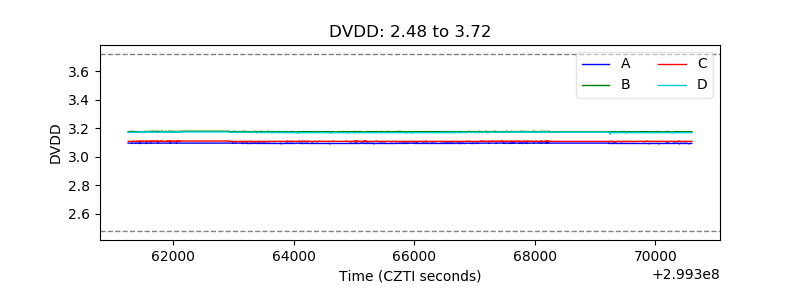 |
| Temperature 1 | 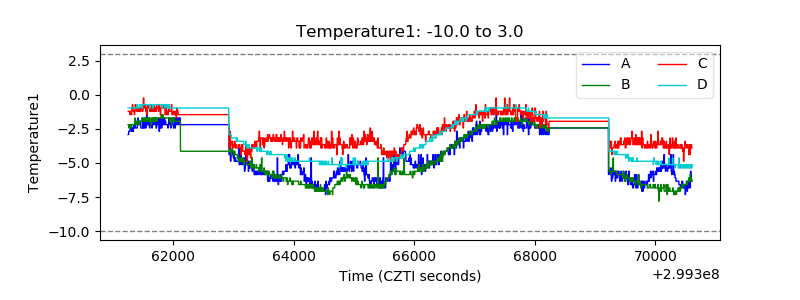 |
| Veto HV Monitor | 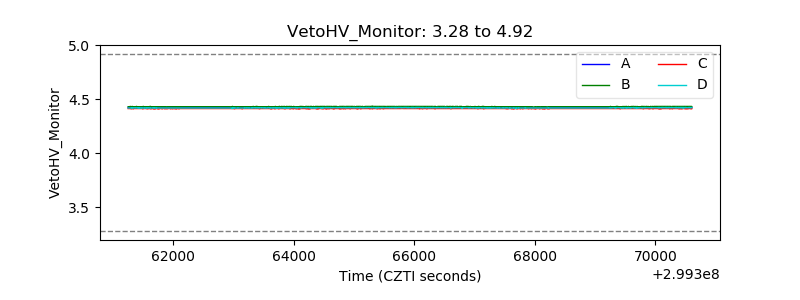 |
| Veto LLD | 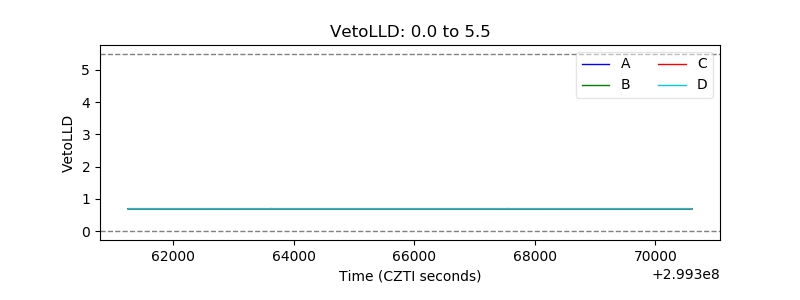 |
| Alpha Counter | 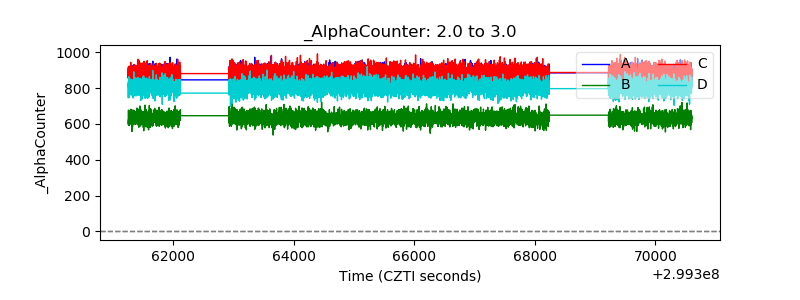 |
| _CPM_Rate | 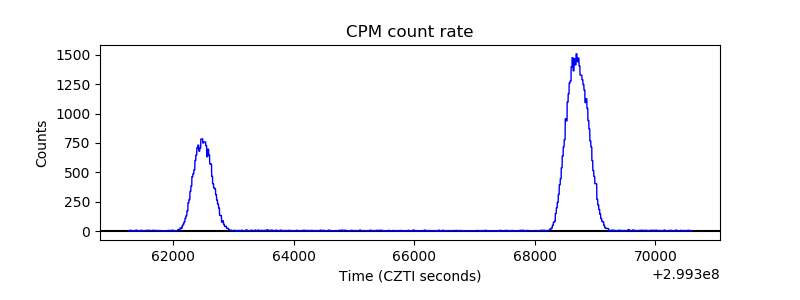 |
| CZT Counter |  |
| +2.5 Volts monitor |  |
| +5 Volts monitor | 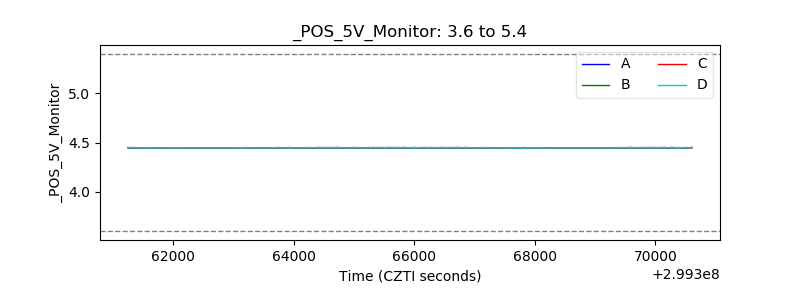 |
| _ROLL_ROT | 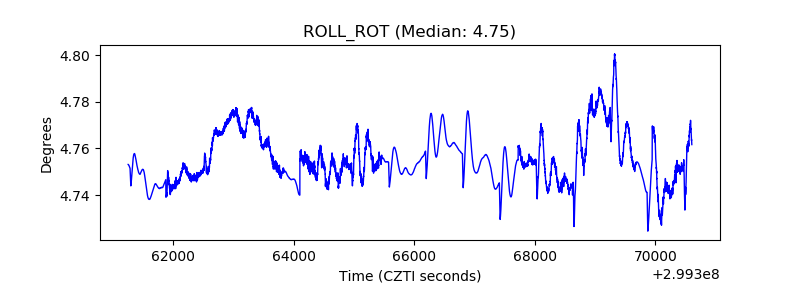 |
| _Roll_DEC | 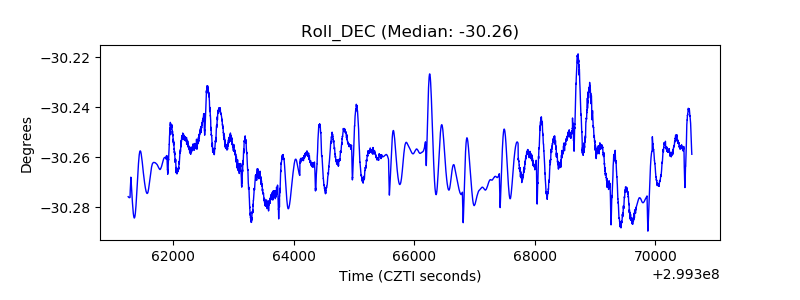 |
| _Roll_RA | 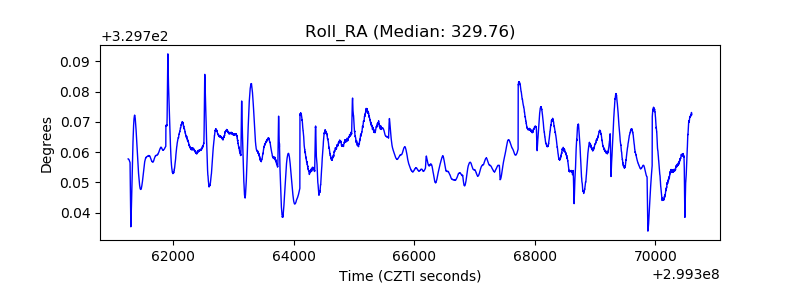 |
| Veto Counter | 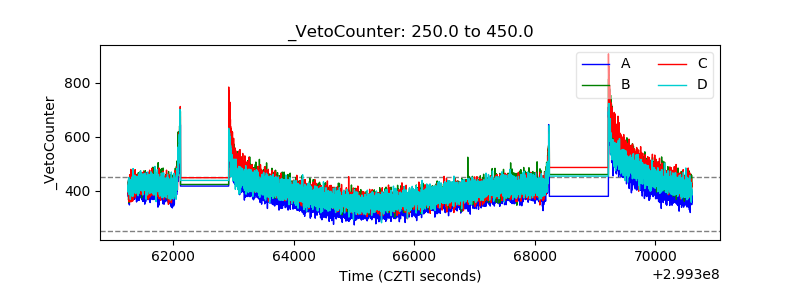 |