| Param | Original file | Final file |
|---|---|---|
| Filename | modeM0/AS1A05_117T01_9000003002_20262cztM0_level2.evt | modeM0/AS1A05_117T01_9000003002_20262cztM0_level2_quad_clean.evt |
| Size (bytes) | 226,103,040 | 61,398,720 |
| Size | 215.6 MB | 58.6 MB |
| Events in quadrant A | 1,493,449 | 417,600 |
| Events in quadrant B | 2,062,868 | 414,283 |
| Events in quadrant C | 1,519,177 | 410,479 |
| Events in quadrant D | 1,563,452 | 400,384 |
| Mode SS | |||
|---|---|---|---|
| Quadrant | BADHDUFLAG | Total packets | Discarded packets |
| A | 0 | 62 | 0 |
| B | 0 | 62 | 0 |
| C | 0 | 62 | 0 |
| D | 0 | 62 | 0 |
| Mode M9 | |||
|---|---|---|---|
| Quadrant | BADHDUFLAG | Total packets | Discarded packets |
| A | 0 | 11 | 0 |
| B | 0 | 11 | 0 |
| C | 0 | 11 | 0 |
| D | 0 | 11 | 0 |
| Mode M0 | |||
|---|---|---|---|
| Quadrant | BADHDUFLAG | Total packets | Discarded packets |
| A | 0 | 6448 | 1 |
| B | 0 | 8193 | 1 |
| C | 0 | 6466 | 1 |
| D | 0 | 6636 | 1 |
| Quadrant | Total seconds | Saturated seconds | Saturation percentage |
|---|---|---|---|
| A | 3042 | 33 | 1.084813% |
| B | 3042 | 172 | 5.654175% |
| C | 3042 | 31 | 1.019066% |
| D | 3042 | 14 | 0.460224% |
Noise dominated data is calculated using 1-second bins in cleaned event files. If a bin has >2000 counts, and if more than 50% of those come from <1% of pixels, then it is considered to be noise-dominated and hence unusable.
| Quadrant | # 1 sec bins | Bins with >0 counts | Bins with >2000 counts | High rate bins dominated by noise | Noise dominated (total time) | Noise dominated (detector-on time) | Marked lightcurve |
|---|---|---|---|---|---|---|---|
| A | 4142 | 3043 | 8 | 8 | 0.19% | 0.26% | 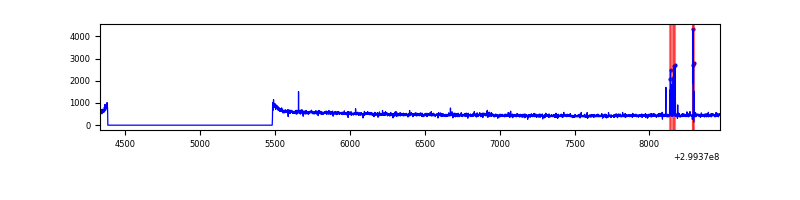 |
| B | 4142 | 3043 | 108 | 108 | 2.61% | 3.55% | 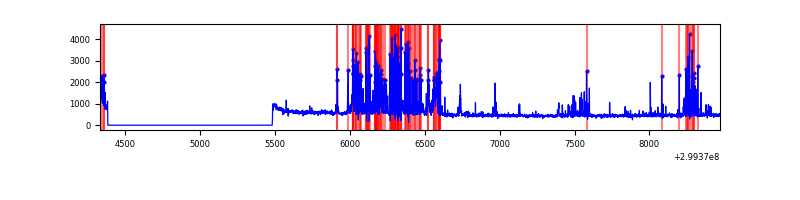 |
| C | 4142 | 3043 | 0 | 0 | 0.00% | 0.00% | 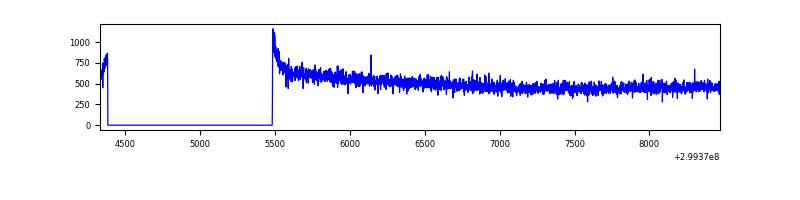 |
| D | 4142 | 3043 | 0 | 0 | 0.00% | 0.00% | 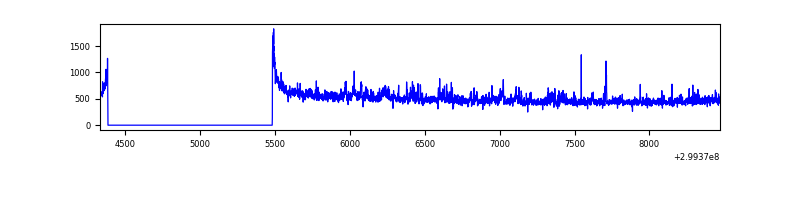 |
Top three noisy pixels from each quadrant. If the there are fewer than three noisy pixels in the level2.evt file, extra rows are filled as -1
| Pixel properties | Quadrant properties | ||||||
|---|---|---|---|---|---|---|---|
| Quadrant | DetID | PixID | Counts | Sigma | Mean | Median | Sigma |
| A | 14 | 238 | 42492 | 548.04 | 375 | 367 | 76.9 |
| A | 4 | 2 | 4049 | 47.9 | 375 | 367 | 76.9 |
| A | 0 | 226 | 3286 | 37.98 | 375 | 367 | 76.9 |
| B | 0 | 85 | 578834 | 8259.33 | 370 | 360 | 70.0 |
| B | 7 | 220 | 24111 | 339.1 | 370 | 360 | 70.0 |
| B | 12 | 111 | 8224 | 112.27 | 370 | 360 | 70.0 |
| C | 14 | 238 | 57396 | 645.06 | 372 | 376 | 88.4 |
| C | 3 | 233 | 6910 | 73.92 | 372 | 376 | 88.4 |
| C | 13 | 61 | 2591 | 25.06 | 372 | 376 | 88.4 |
| D | 2 | 16 | 86853 | 947.97 | 372 | 362 | 91.2 |
| D | 1 | 52 | 37393 | 405.87 | 372 | 362 | 91.2 |
| D | 7 | 38 | 23720 | 256.01 | 372 | 362 | 91.2 |
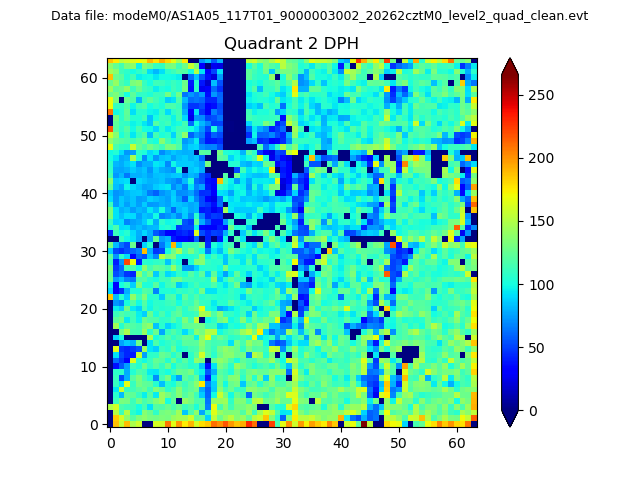
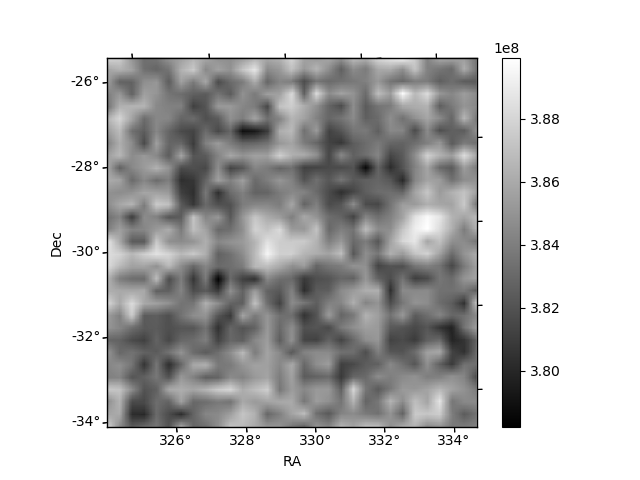
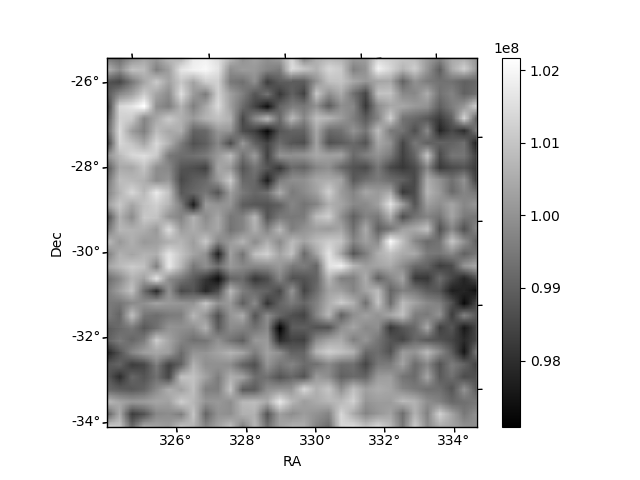
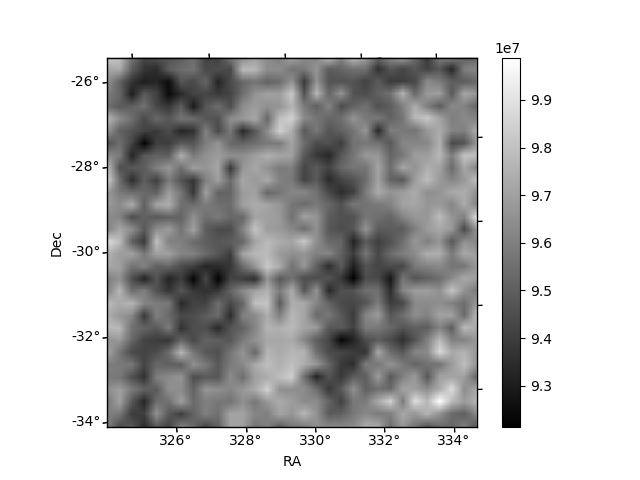
Histogram calculated using DETX and DETY for each event in the final _common_clean file
| Quadrant A | 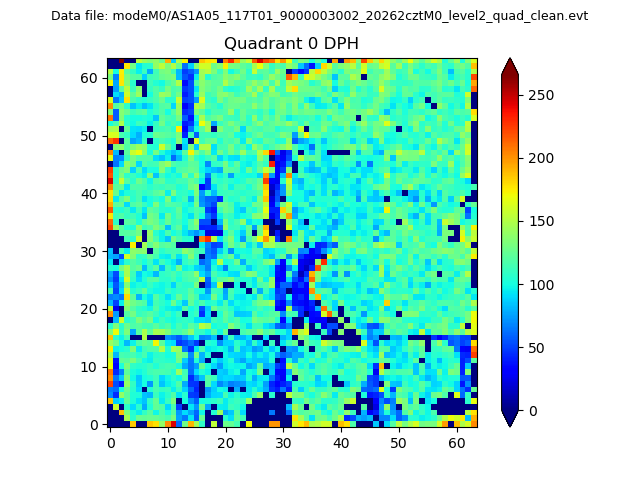 |
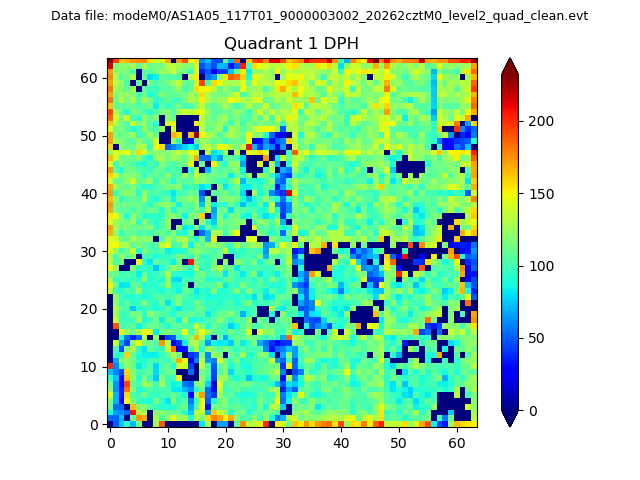 |
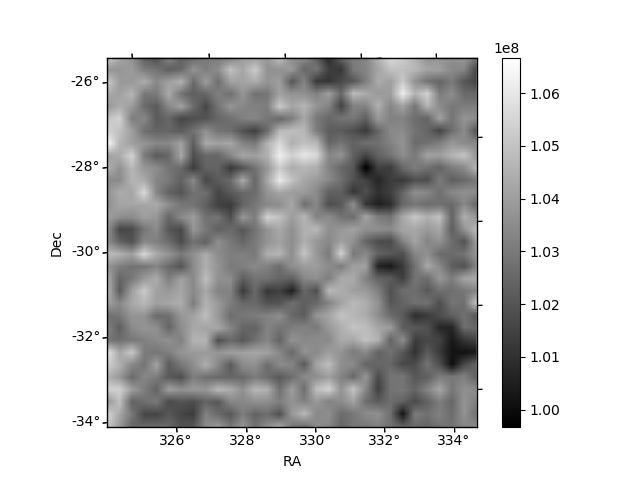
Quadrant B |
|---|---|---|---|
| Quadrant D | 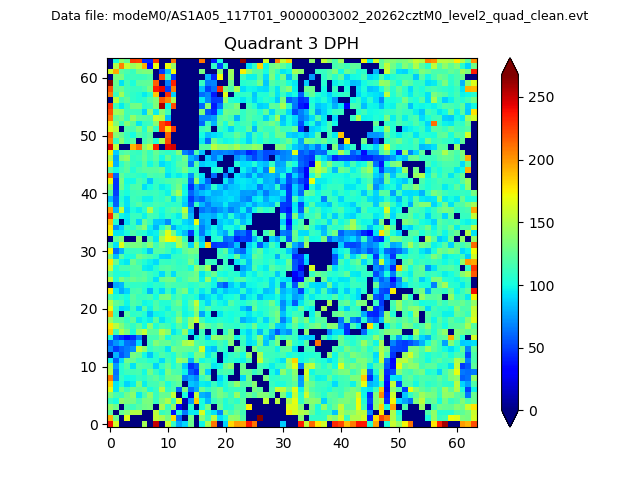 |
 |
Quadrant C |
| Plot type | Count rate plots | Images |
|---|---|---|
| Comparison with Poisson distribution Blue bars denote a histogram of data divided into 1 sec bins. Red curve is a Poisson curve with rate = median count rate of data. |
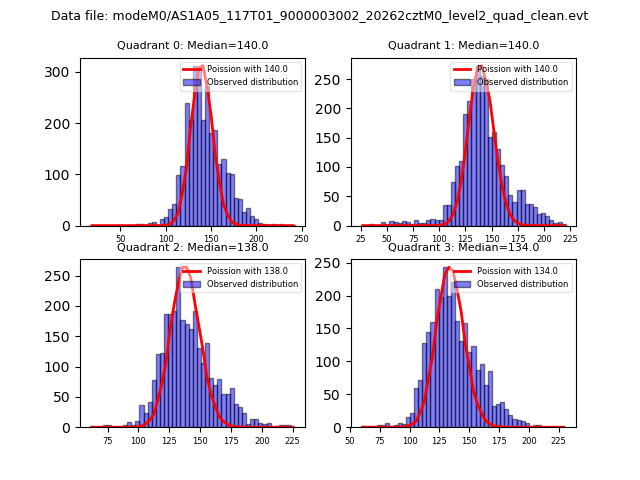 |
 |
| Quadrant-wise count rates Data is divided into 100 sec bins |
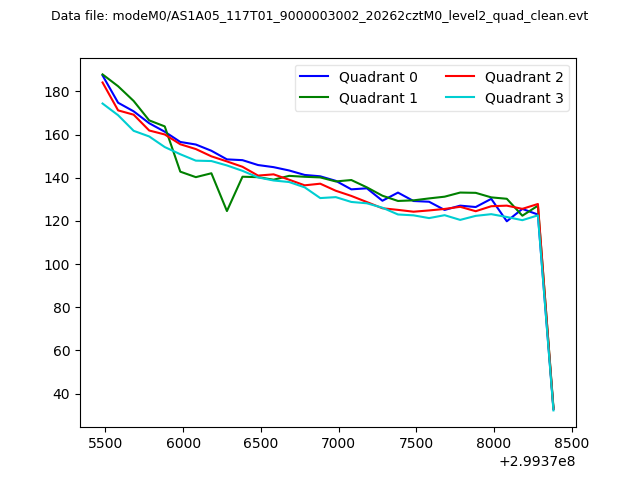 |
|
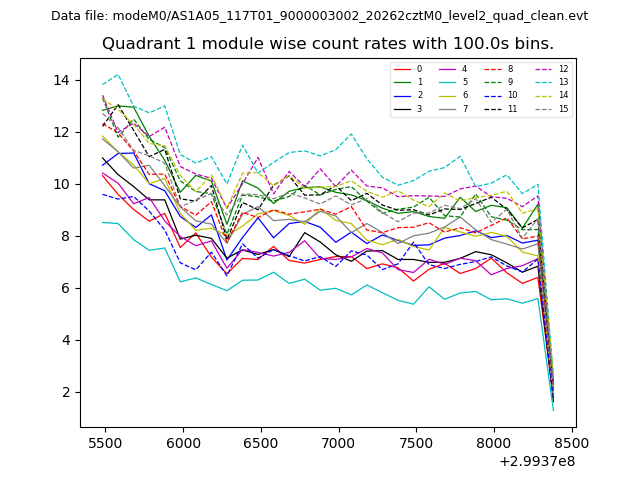
| Module-wise count rates for Quadrant A Data is divided into 100 sec bins |
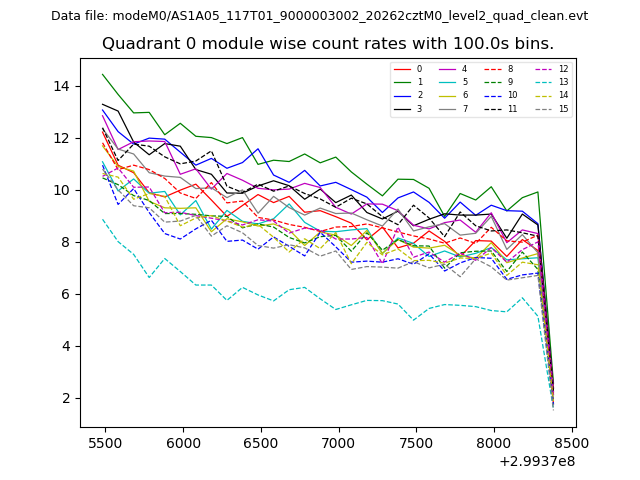 |
 |
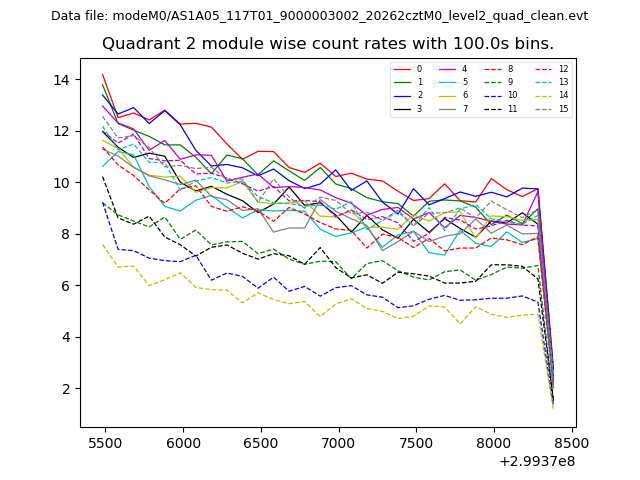
| Module-wise count rates for Quadrant B Data is divided into 100 sec bins |
 |
 |
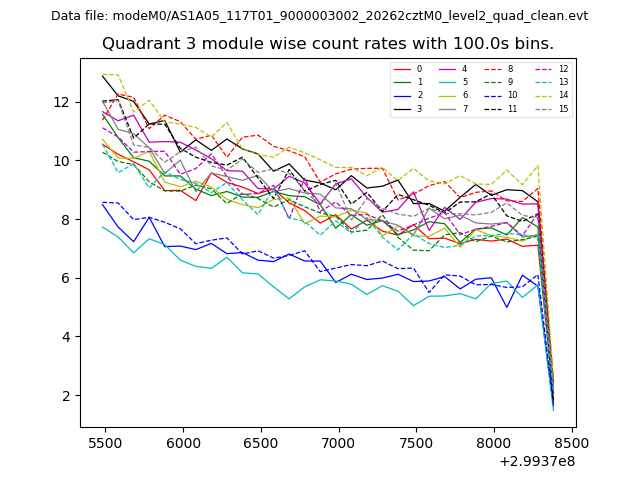
| Module-wise count rates for Quadrant C Data is divided into 100 sec bins |
 |
 |
| Module-wise count rates for Quadrant D Data is divided into 100 sec bins |
 |
 |
| Parameter | Plot |
|---|---|
| CZT HV Monitor | 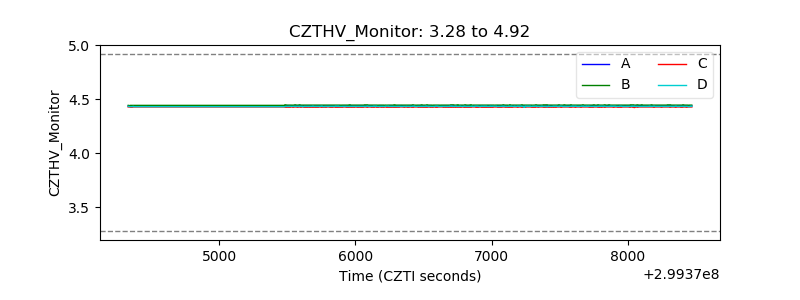 |
| D_VDD | 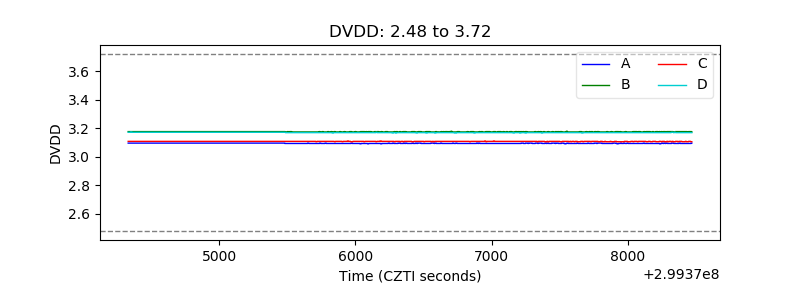 |
| Temperature 1 |  |
| Veto HV Monitor | 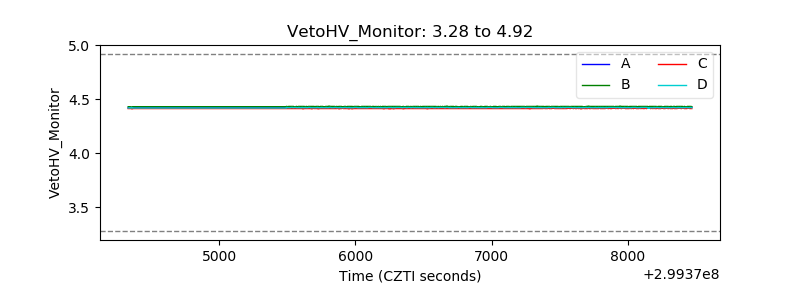 |
| Veto LLD | 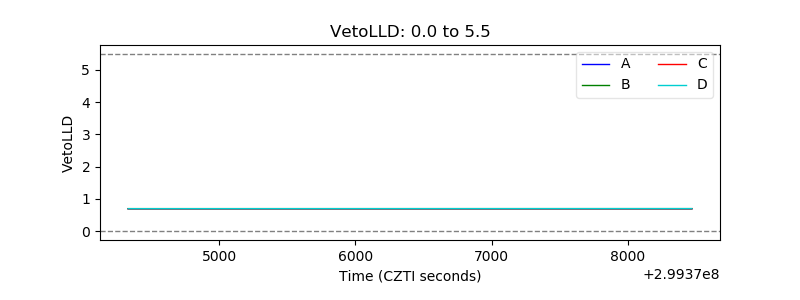 |
| Alpha Counter | 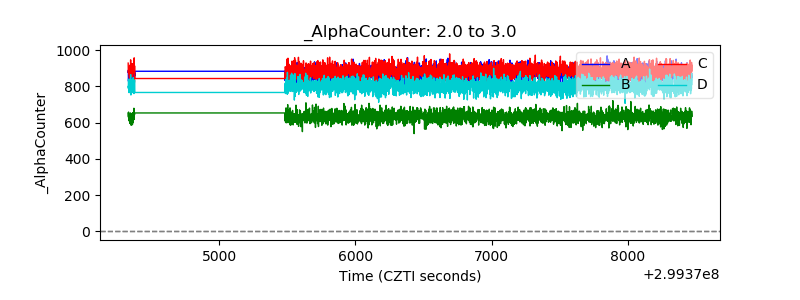 |
| _CPM_Rate | 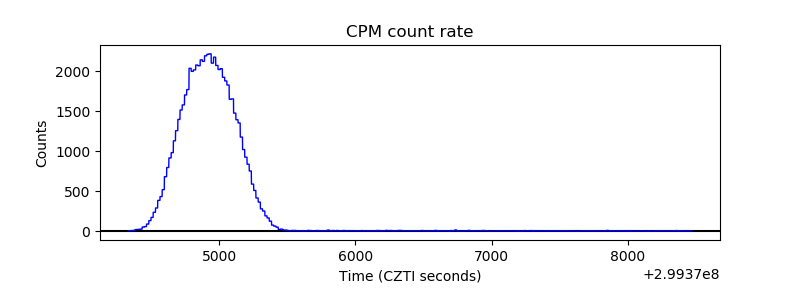 |
| CZT Counter | 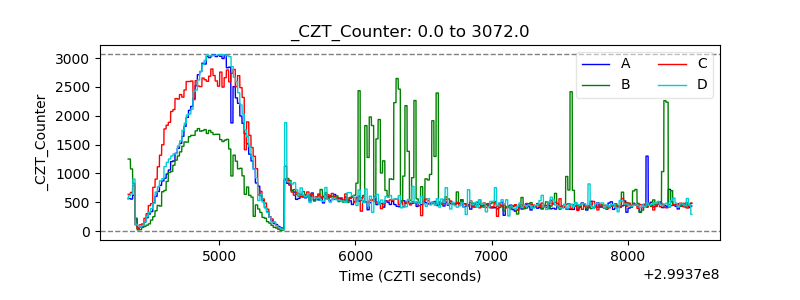 |
| +2.5 Volts monitor |  |
| +5 Volts monitor |  |
| _ROLL_ROT | 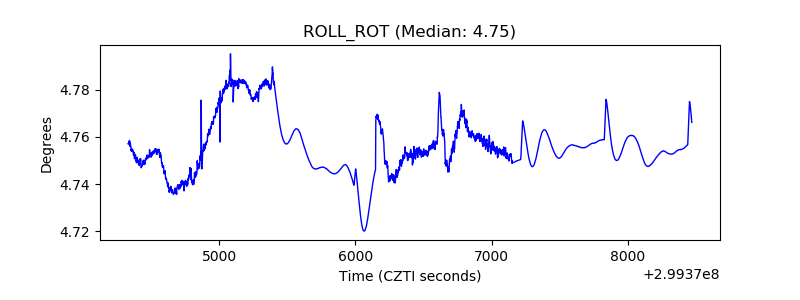 |
| _Roll_DEC |  |
| _Roll_RA | 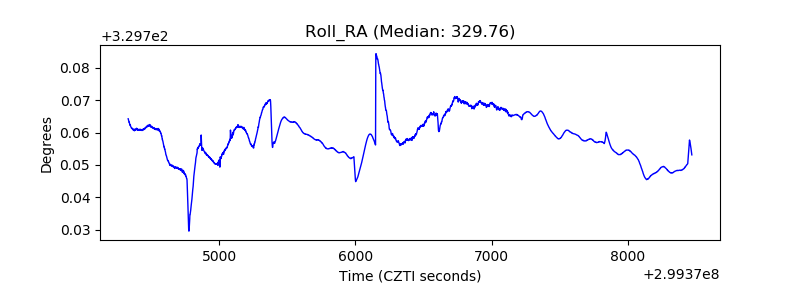 |
| Veto Counter | 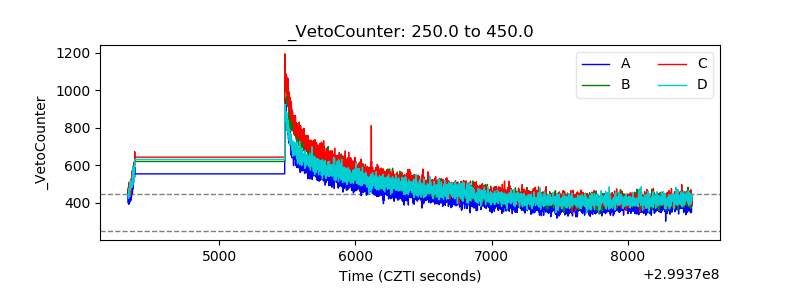 |