| Param | Original file | Final file |
|---|---|---|
| Filename | modeM0/AS1A05_175T01_9000003004cztM0_level2.fits | modeM0/AS1A05_175T01_9000003004cztM0_level2_quad_clean.evt |
| Size (bytes) | 705,775,680 | 651,648,960 |
| Size | 673.1 MB | 621.5 MB |
| Events in quadrant A | 4,297,518 | 3,832,485 |
| Events in quadrant B | 4,207,202 | 3,871,491 |
| Events in quadrant C | 4,250,648 | 3,709,005 |
| Events in quadrant D | 3,684,016 | 3,388,066 |
| Mode M0 | |||
|---|---|---|---|
| Quadrant | BADHDUFLAG | Total packets | Discarded packets |
| A | 0 | 179082 | 0 |
| B | 0 | 161232 | 0 |
| C | 0 | 149222 | 0 |
| D | 0 | 176792 | 0 |
| Mode SS | |||
|---|---|---|---|
| Quadrant | BADHDUFLAG | Total packets | Discarded packets |
| A | 0 | 1466 | 0 |
| B | 0 | 1466 | 0 |
| C | 0 | 1466 | 0 |
| D | 0 | 1466 | 0 |
| Mode M9 | |||
|---|---|---|---|
| Quadrant | BADHDUFLAG | Total packets | Discarded packets |
| A | 0 | 126 | 0 |
| B | 0 | 126 | 0 |
| C | 0 | 126 | 0 |
| D | 0 | 126 | 0 |
| Quadrant | Total seconds | Saturated seconds | Saturation percentage |
|---|---|---|---|
| A | 71945 | 3667 | 5.096949% |
| B | 71945 | 1692 | 2.351797% |
| C | 71945 | 1038 | 1.442769% |
| D | 71945 | 2314 | 3.216346% |
Noise dominated data is calculated using 1-second bins in cleaned event files. If a bin has >2000 counts, and if more than 50% of those come from <1% of pixels, then it is considered to be noise-dominated and hence unusable.
| Quadrant | # 1 sec bins | Bins with >0 counts | Bins with >2000 counts | High rate bins dominated by noise | Noise dominated (total time) | Noise dominated (detector-on time) | Marked lightcurve |
|---|---|---|---|---|---|---|---|
| A | 84550 | 71913 | 0 | 0 | 0.00% | 0.00% |  |
| B | 84550 | 71942 | 0 | 0 | 0.00% | 0.00% |  |
| C | 84550 | 71945 | 0 | 0 | 0.00% | 0.00% | 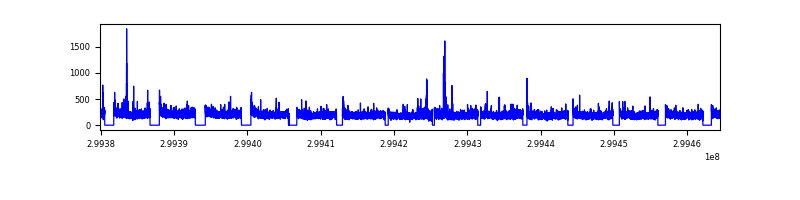 |
| D | 84550 | 71919 | 0 | 0 | 0.00% | 0.00% |  |
Top three noisy pixels from each quadrant. If the there are fewer than three noisy pixels in the level2.evt file, extra rows are filled as -1
| Pixel properties | Quadrant properties | ||||||
|---|---|---|---|---|---|---|---|
| Quadrant | DetID | PixID | Counts | Sigma | Mean | Median | Sigma |
| A | 0 | 29 | 4146 | 11.28 | 1119 | 1050 | 274.5 |
| A | 7 | 110 | 3477 | 8.84 | 1119 | 1050 | 274.5 |
| A | 9 | 19 | 3238 | 7.97 | 1119 | 1050 | 274.5 |
| B | 2 | 9 | 3466 | 10.94 | 1112 | 1061 | 219.8 |
| B | 2 | 8 | 2885 | 8.3 | 1112 | 1061 | 219.8 |
| B | 3 | 17 | 2741 | 7.64 | 1112 | 1061 | 219.8 |
| C | 1 | 81 | 3239 | 7.63 | 1122 | 1049 | 287.2 |
| C | 1 | 80 | 3171 | 7.39 | 1122 | 1049 | 287.2 |
| C | 12 | 241 | 2937 | 6.57 | 1122 | 1049 | 287.2 |
| D | 6 | 231 | 2695 | 6.18 | 1053 | 960 | 280.6 |
| D | 6 | 67 | 2614 | 5.89 | 1053 | 960 | 280.6 |
| D | 3 | 14 | 2611 | 5.88 | 1053 | 960 | 280.6 |
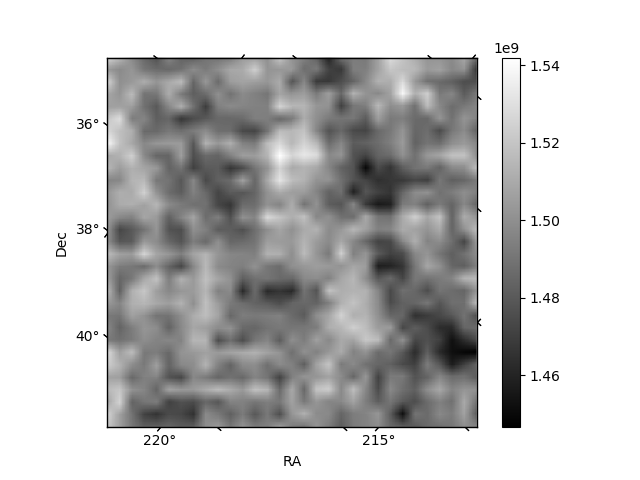
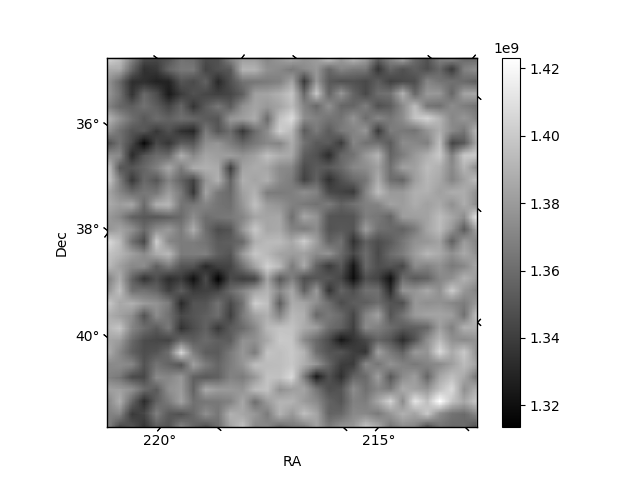
Histogram calculated using DETX and DETY for each event in the final _common_clean file
| Quadrant A | 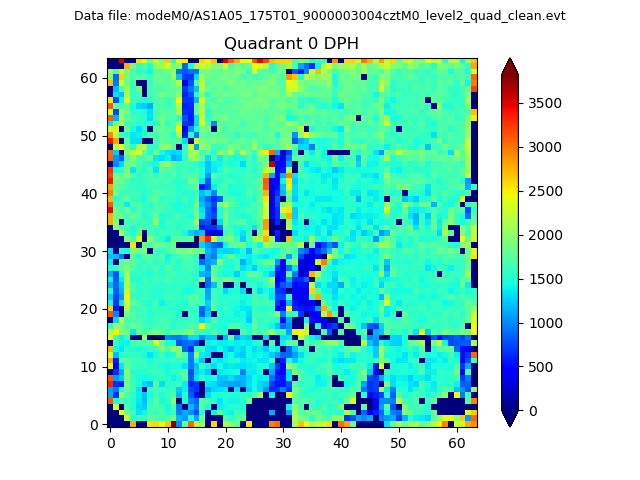 |
 |
Quadrant B |
|---|---|---|---|
| Quadrant D | 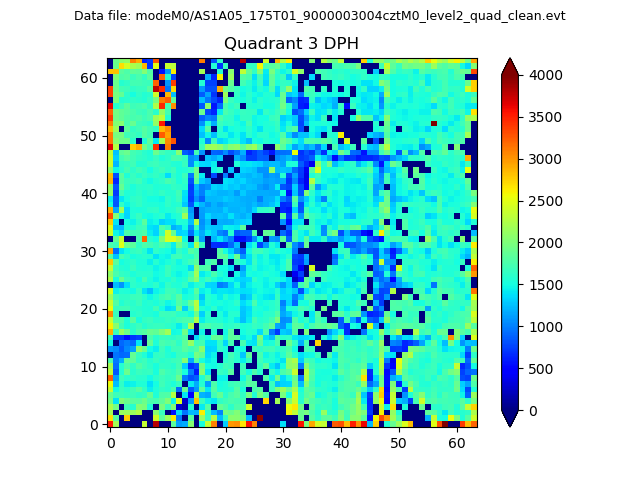 |
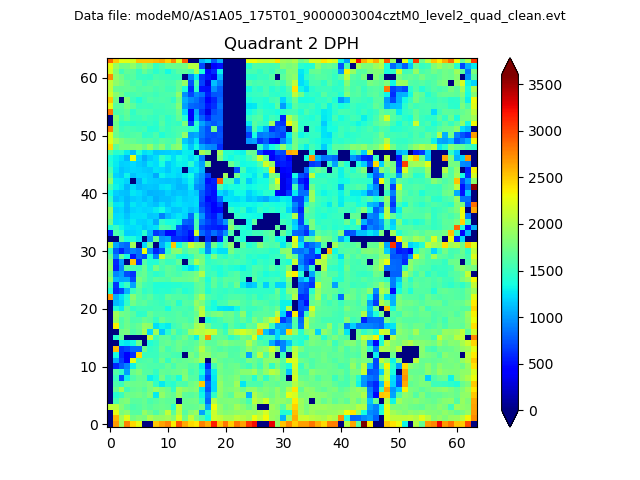 |
Quadrant C |
| Plot type | Count rate plots | Images |
|---|---|---|
| Comparison with Poisson distribution Blue bars denote a histogram of data divided into 1 sec bins. Red curve is a Poisson curve with rate = median count rate of data. |
 |
 |
| Quadrant-wise count rates Data is divided into 100 sec bins |
 |
|
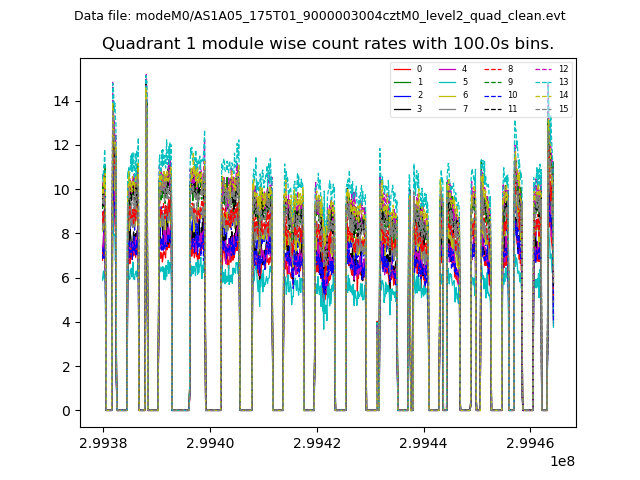
| Module-wise count rates for Quadrant A Data is divided into 100 sec bins |
 |
 |
| Module-wise count rates for Quadrant B Data is divided into 100 sec bins |
 |
 |
| Module-wise count rates for Quadrant C Data is divided into 100 sec bins |
 |
 |
| Module-wise count rates for Quadrant D Data is divided into 100 sec bins |
 |
 |
| Parameter | Plot |
|---|---|
| CZT HV Monitor |  |
| D_VDD |  |
| Temperature 1 |  |
| Veto HV Monitor |  |
| Veto LLD |  |
| Alpha Counter |  |
| _CPM_Rate |  |
| CZT Counter |  |
| +2.5 Volts monitor |  |
| +5 Volts monitor |  |
| _ROLL_ROT |  |
| _Roll_DEC |  |
| _Roll_RA |  |
| Veto Counter |  |