| Param | Original file | Final file |
|---|---|---|
| Filename | modeM0/AS1A05_175T01_9000003004_20262cztM0_level2.evt | modeM0/AS1A05_175T01_9000003004_20262cztM0_level2_quad_clean.evt |
| Size (bytes) | 163,543,680 | 32,915,520 |
| Size | 156.0 MB | 31.4 MB |
| Events in quadrant A | 1,447,199 | 209,629 |
| Events in quadrant B | 1,163,079 | 224,390 |
| Events in quadrant C | 1,062,741 | 212,820 |
| Events in quadrant D | 1,146,949 | 209,440 |
| Mode M0 | |||
|---|---|---|---|
| Quadrant | BADHDUFLAG | Total packets | Discarded packets |
| A | 0 | 5520 | 1 |
| B | 0 | 4625 | 1 |
| C | 0 | 4275 | 1 |
| D | 0 | 4665 | 1 |
| Mode SS | |||
|---|---|---|---|
| Quadrant | BADHDUFLAG | Total packets | Discarded packets |
| A | 0 | 40 | 0 |
| B | 0 | 40 | 0 |
| C | 0 | 40 | 0 |
| D | 0 | 40 | 0 |
| Mode M9 | |||
|---|---|---|---|
| Quadrant | BADHDUFLAG | Total packets | Discarded packets |
| A | 0 | 12 | 0 |
| B | 0 | 12 | 0 |
| C | 0 | 12 | 0 |
| D | 0 | 12 | 0 |
| Quadrant | Total seconds | Saturated seconds | Saturation percentage |
|---|---|---|---|
| A | 1923 | 172 | 8.944358% |
| B | 1923 | 24 | 1.248050% |
| C | 1923 | 32 | 1.664067% |
| D | 1923 | 17 | 0.884035% |
Noise dominated data is calculated using 1-second bins in cleaned event files. If a bin has >2000 counts, and if more than 50% of those come from <1% of pixels, then it is considered to be noise-dominated and hence unusable.
| Quadrant | # 1 sec bins | Bins with >0 counts | Bins with >2000 counts | High rate bins dominated by noise | Noise dominated (total time) | Noise dominated (detector-on time) | Marked lightcurve |
|---|---|---|---|---|---|---|---|
| A | 3153 | 1924 | 87 | 87 | 2.76% | 4.52% | 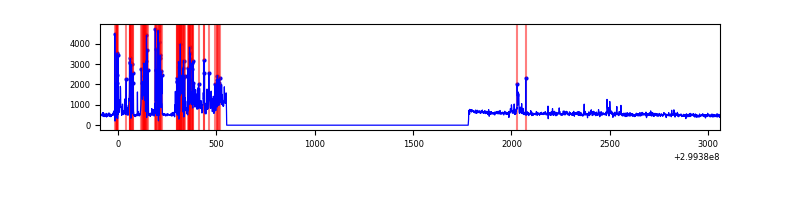 |
| B | 3153 | 1924 | 2 | 2 | 0.06% | 0.10% | 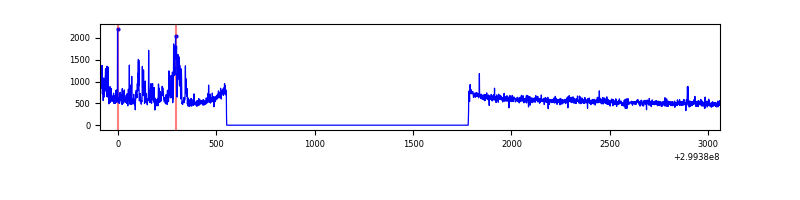 |
| C | 3153 | 1924 | 0 | 0 | 0.00% | 0.00% | 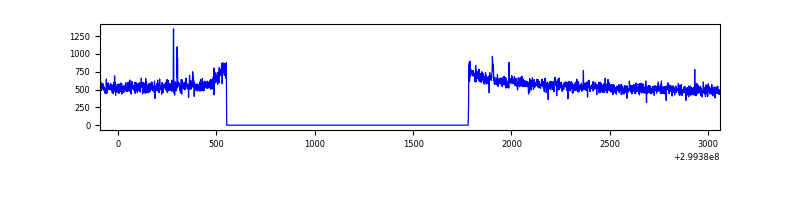 |
| D | 3153 | 1924 | 8 | 8 | 0.25% | 0.42% | 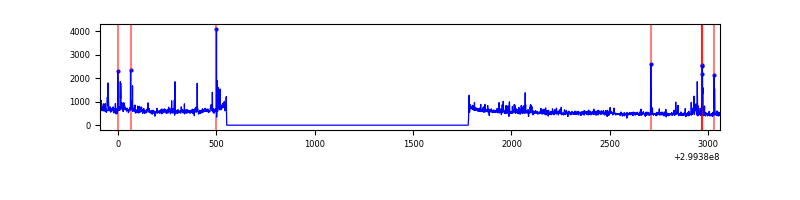 |
Top three noisy pixels from each quadrant. If the there are fewer than three noisy pixels in the level2.evt file, extra rows are filled as -1
| Pixel properties | Quadrant properties | ||||||
|---|---|---|---|---|---|---|---|
| Quadrant | DetID | PixID | Counts | Sigma | Mean | Median | Sigma |
| A | 14 | 238 | 455146 | 8495.3 | 255 | 250 | 53.5 |
| A | 4 | 2 | 7747 | 140.01 | 255 | 250 | 53.5 |
| A | 0 | 226 | 2210 | 36.6 | 255 | 250 | 53.5 |
| B | 4 | 142 | 61785 | 1196.47 | 265 | 259 | 51.4 |
| B | 7 | 220 | 28619 | 551.51 | 265 | 259 | 51.4 |
| B | 15 | 32 | 15257 | 291.66 | 265 | 259 | 51.4 |
| C | 14 | 238 | 40542 | 654.36 | 256 | 258 | 61.6 |
| C | 3 | 233 | 10977 | 174.12 | 256 | 258 | 61.6 |
| C | 0 | 207 | 10744 | 170.33 | 256 | 258 | 61.6 |
| D | 1 | 52 | 68079 | 1080.15 | 256 | 250 | 62.8 |
| D | 2 | 120 | 38296 | 605.87 | 256 | 250 | 62.8 |
| D | 7 | 238 | 24104 | 379.87 | 256 | 250 | 62.8 |
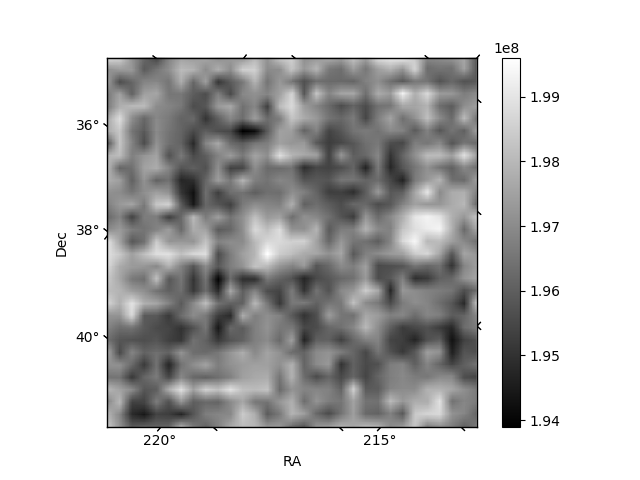
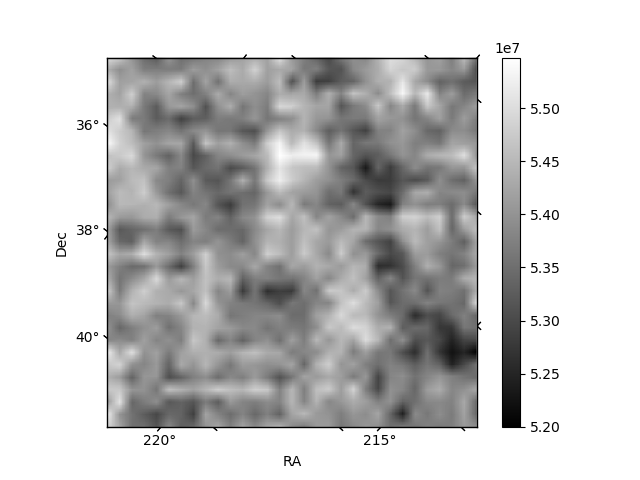
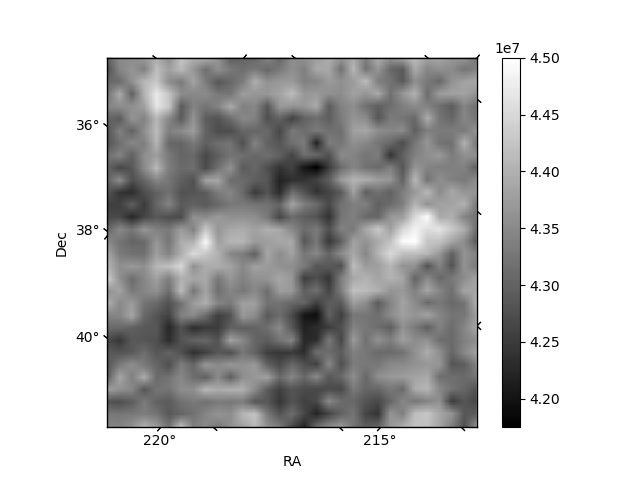
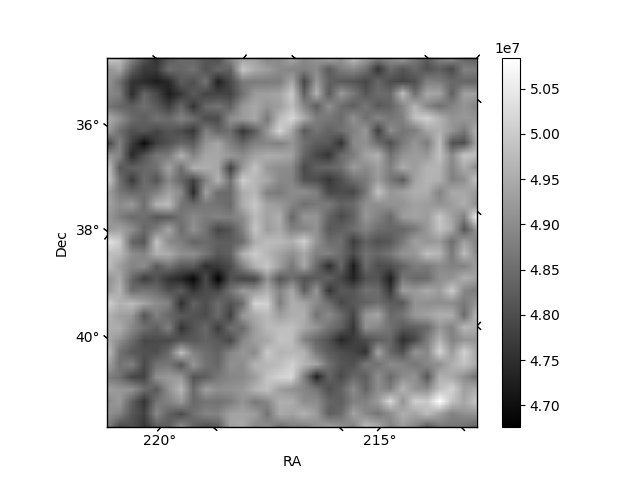
Histogram calculated using DETX and DETY for each event in the final _common_clean file
| Quadrant A | 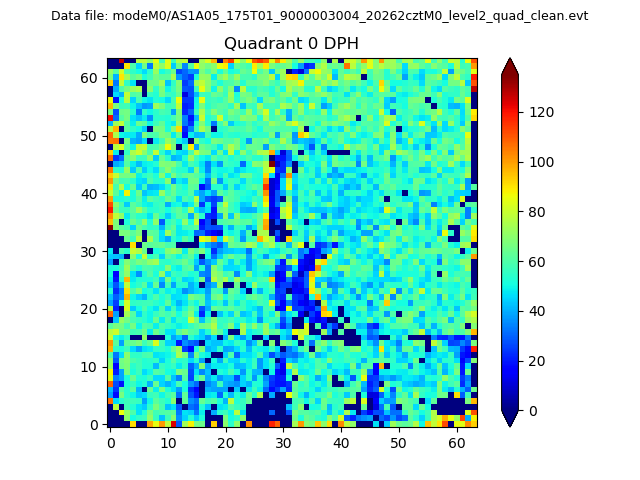 |
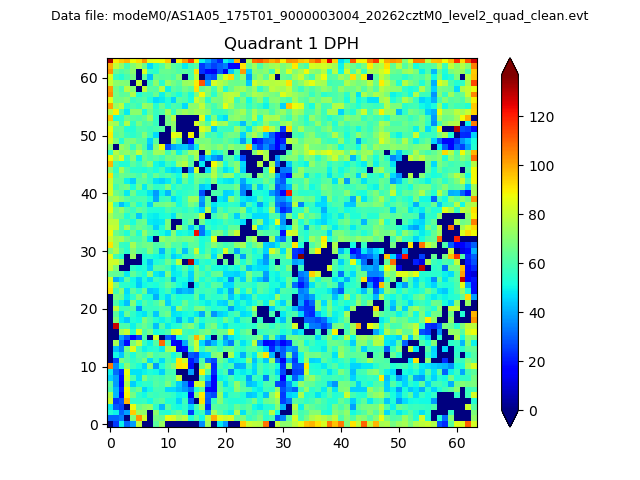 |
Quadrant B |
|---|---|---|---|
| Quadrant D |  |
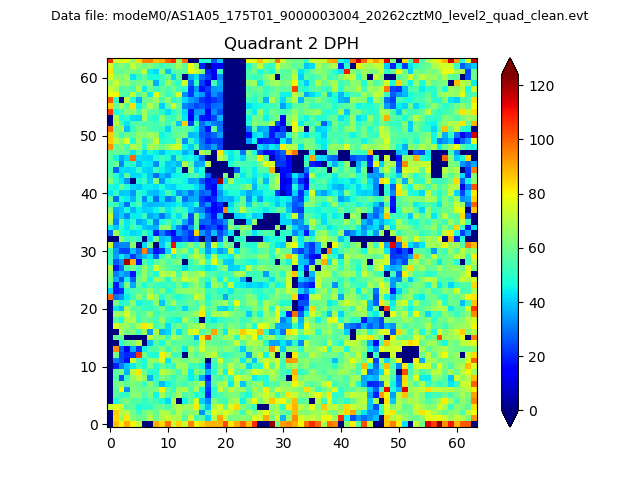 |
Quadrant C |
| Plot type | Count rate plots | Images |
|---|---|---|
| Comparison with Poisson distribution Blue bars denote a histogram of data divided into 1 sec bins. Red curve is a Poisson curve with rate = median count rate of data. |
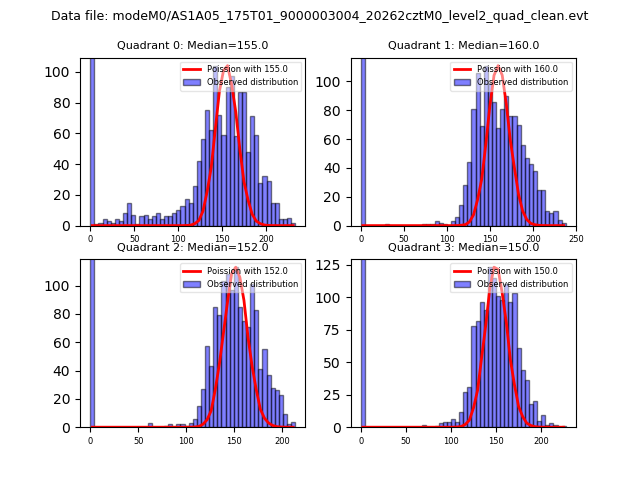 |
 |
| Quadrant-wise count rates Data is divided into 100 sec bins |
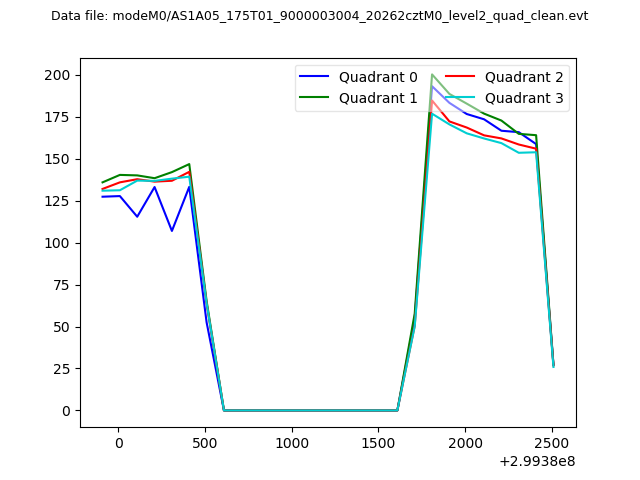 |
|
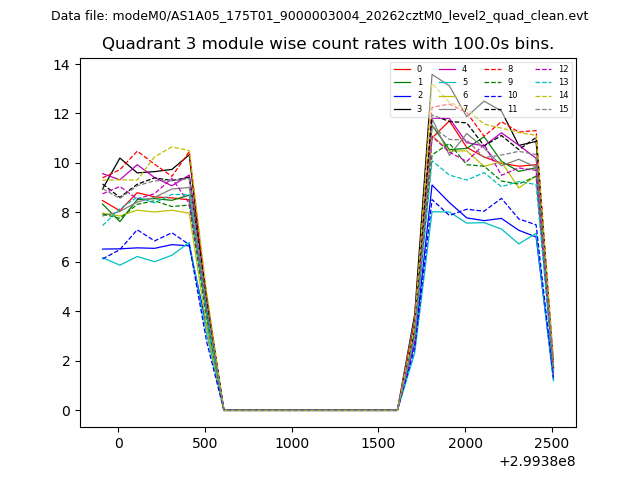
| Module-wise count rates for Quadrant A Data is divided into 100 sec bins |
 |
 |
| Module-wise count rates for Quadrant B Data is divided into 100 sec bins |
 |
 |
| Module-wise count rates for Quadrant C Data is divided into 100 sec bins |
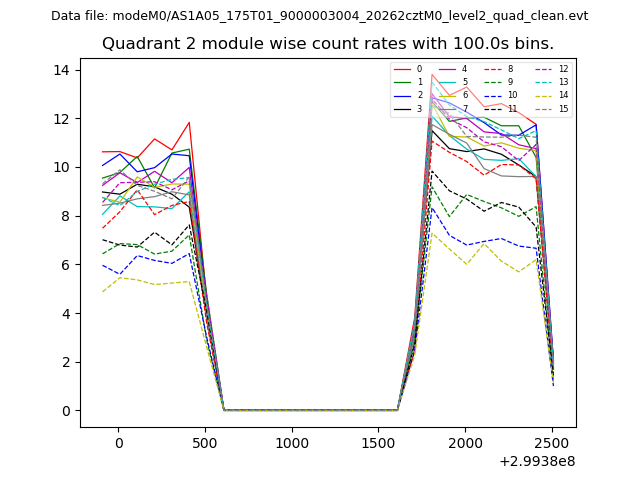 |
 |
| Module-wise count rates for Quadrant D Data is divided into 100 sec bins |
 |
 |
| Parameter | Plot |
|---|---|
| CZT HV Monitor | 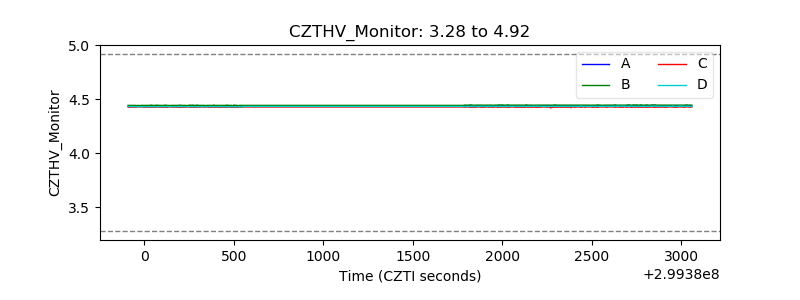 |
| D_VDD | 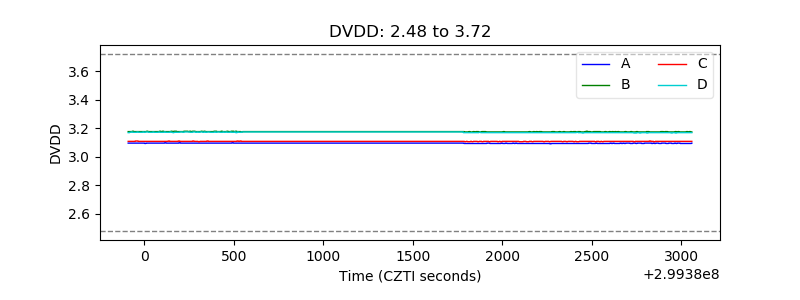 |
| Temperature 1 | 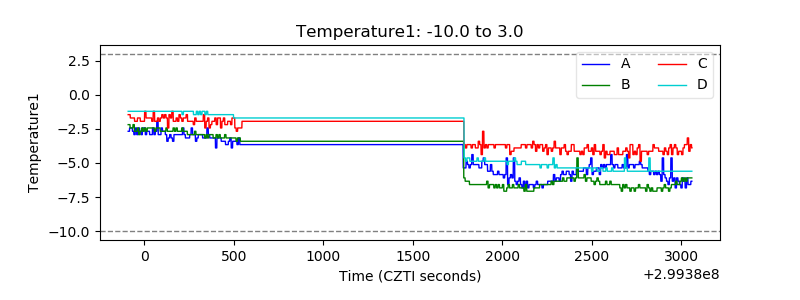 |
| Veto HV Monitor | 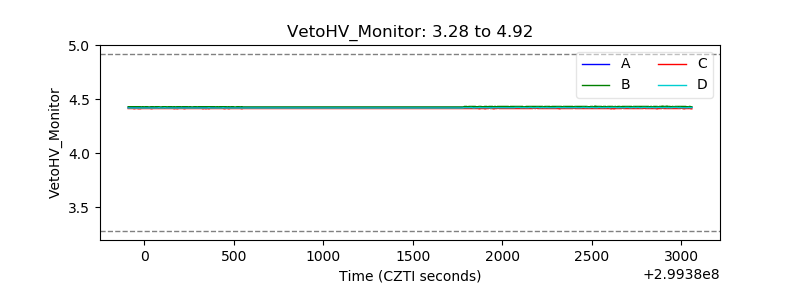 |
| Veto LLD | 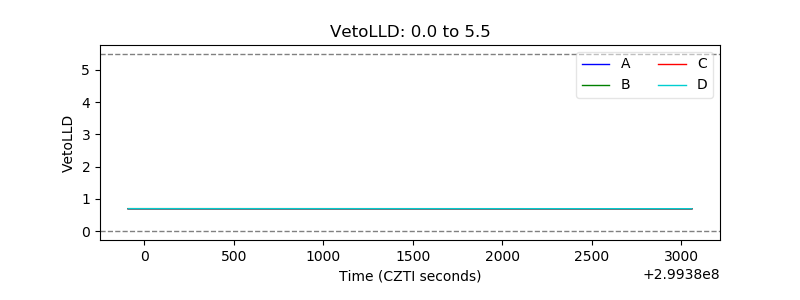 |
| Alpha Counter | 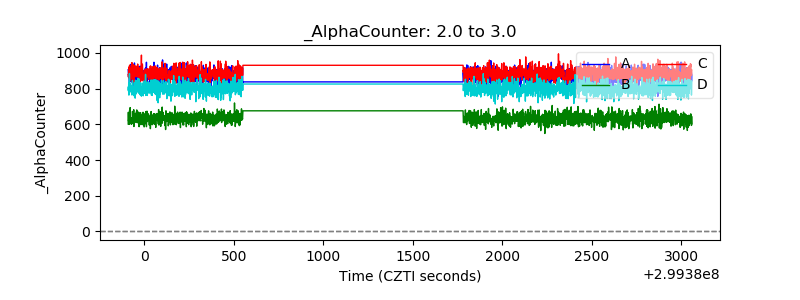 |
| _CPM_Rate | 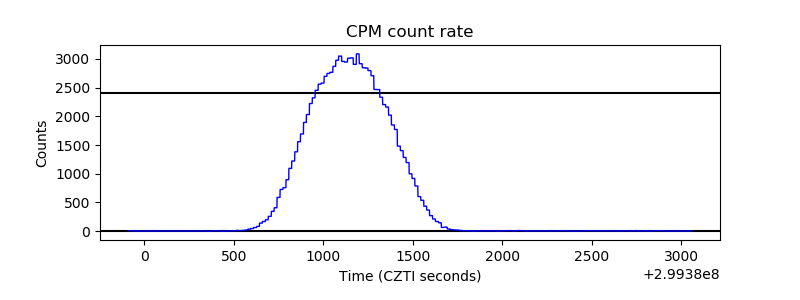 |
| CZT Counter | 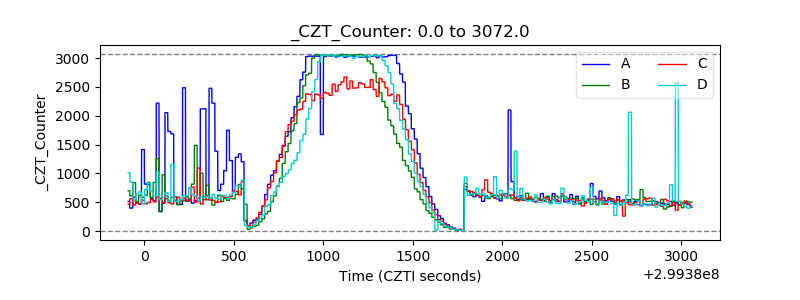 |
| +2.5 Volts monitor |  |
| +5 Volts monitor |  |
| _ROLL_ROT |  |
| _Roll_DEC | 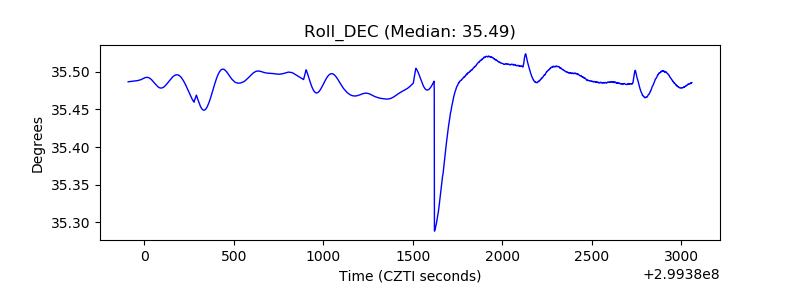 |
| _Roll_RA | 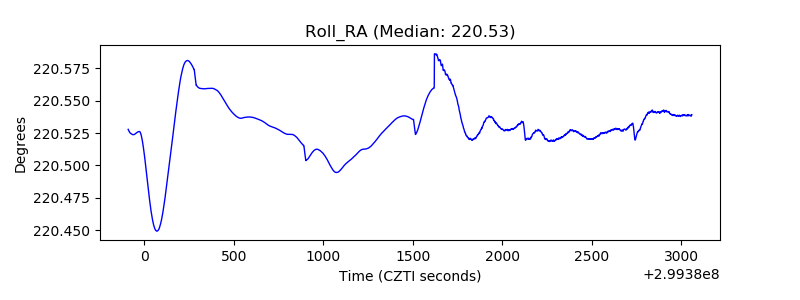 |
| Veto Counter | 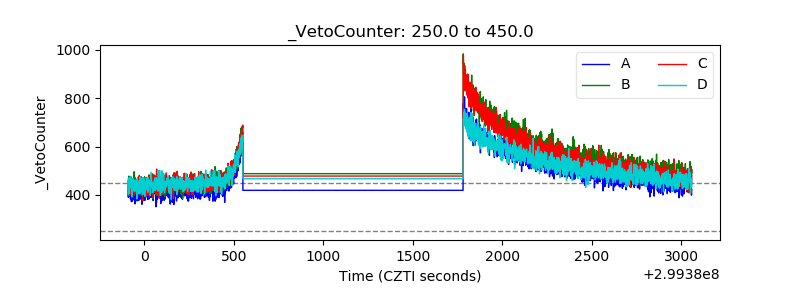 |