| Param | Original file | Final file |
|---|---|---|
| Filename | modeM0/AS1A05_175T01_9000003004_20263cztM0_level2.evt | modeM0/AS1A05_175T01_9000003004_20263cztM0_level2_quad_clean.evt |
| Size (bytes) | 570,536,640 | 78,105,600 |
| Size | 544.1 MB | 74.5 MB |
| Events in quadrant A | 5,397,515 | 482,155 |
| Events in quadrant B | 3,453,317 | 507,242 |
| Events in quadrant C | 3,358,607 | 476,613 |
| Events in quadrant D | 4,631,716 | 448,479 |
| Mode M0 | |||
|---|---|---|---|
| Quadrant | BADHDUFLAG | Total packets | Discarded packets |
| A | 0 | 20077 | 8 |
| B | 0 | 14074 | 2 |
| C | 0 | 13773 | 2 |
| D | 0 | 17913 | 2 |
| Mode SS | |||
|---|---|---|---|
| Quadrant | BADHDUFLAG | Total packets | Discarded packets |
| A | 0 | 132 | 0 |
| B | 0 | 132 | 0 |
| C | 0 | 132 | 0 |
| D | 0 | 132 | 0 |
| Mode M9 | |||
|---|---|---|---|
| Quadrant | BADHDUFLAG | Total packets | Discarded packets |
| A | 0 | 16 | 0 |
| B | 0 | 17 | 0 |
| C | 0 | 17 | 0 |
| D | 0 | 17 | 0 |
| Quadrant | Total seconds | Saturated seconds | Saturation percentage |
|---|---|---|---|
| A | 6454 | 771 | 11.946080% |
| B | 6454 | 62 | 0.960645% |
| C | 6454 | 62 | 0.960645% |
| D | 6454 | 389 | 6.027270% |
Noise dominated data is calculated using 1-second bins in cleaned event files. If a bin has >2000 counts, and if more than 50% of those come from <1% of pixels, then it is considered to be noise-dominated and hence unusable.
| Quadrant | # 1 sec bins | Bins with >0 counts | Bins with >2000 counts | High rate bins dominated by noise | Noise dominated (total time) | Noise dominated (detector-on time) | Marked lightcurve |
|---|---|---|---|---|---|---|---|
| A | 7739 | 6455 | 533 | 533 | 6.89% | 8.26% | 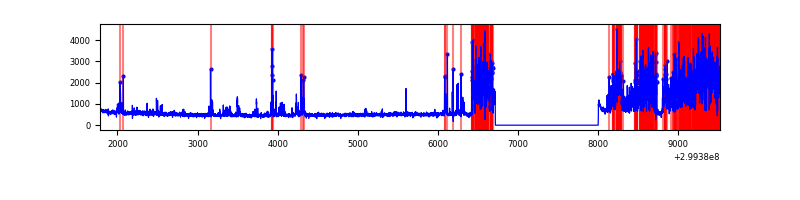 |
| B | 7739 | 6455 | 6 | 6 | 0.08% | 0.09% |  |
| C | 7739 | 6455 | 1 | 1 | 0.01% | 0.02% | 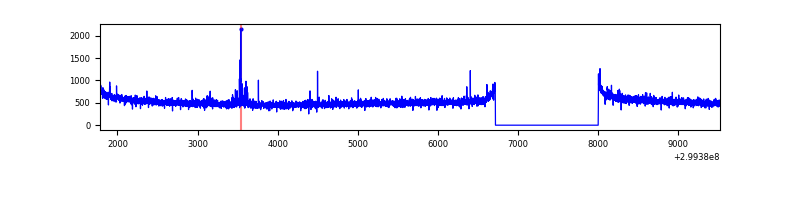 |
| D | 7739 | 6455 | 328 | 328 | 4.24% | 5.08% | 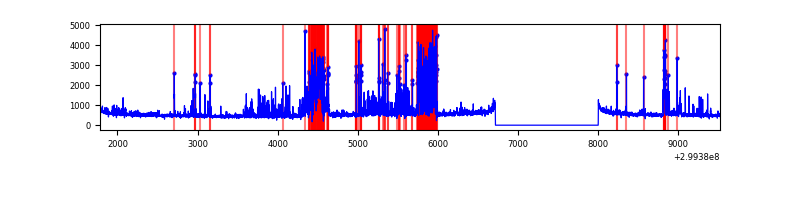 |
Top three noisy pixels from each quadrant. If the there are fewer than three noisy pixels in the level2.evt file, extra rows are filled as -1
| Pixel properties | Quadrant properties | ||||||
|---|---|---|---|---|---|---|---|
| Quadrant | DetID | PixID | Counts | Sigma | Mean | Median | Sigma |
| A | 14 | 238 | 2233698 | 13641.46 | 816 | 801 | 163.7 |
| A | 4 | 2 | 10904 | 61.72 | 816 | 801 | 163.7 |
| A | 8 | 205 | 8724 | 48.4 | 816 | 801 | 163.7 |
| B | 7 | 220 | 57006 | 351.87 | 853 | 834 | 159.6 |
| B | 12 | 111 | 18702 | 111.92 | 853 | 834 | 159.6 |
| B | 11 | 111 | 16618 | 98.87 | 853 | 834 | 159.6 |
| C | 14 | 238 | 129105 | 682.74 | 813 | 823 | 187.9 |
| C | 5 | 4 | 26221 | 135.17 | 813 | 823 | 187.9 |
| C | 0 | 207 | 18698 | 95.13 | 813 | 823 | 187.9 |
| D | 1 | 52 | 1101371 | 5756.06 | 797 | 775 | 191.2 |
| D | 11 | 176 | 390867 | 2040.16 | 797 | 775 | 191.2 |
| D | 2 | 120 | 52887 | 272.54 | 797 | 775 | 191.2 |
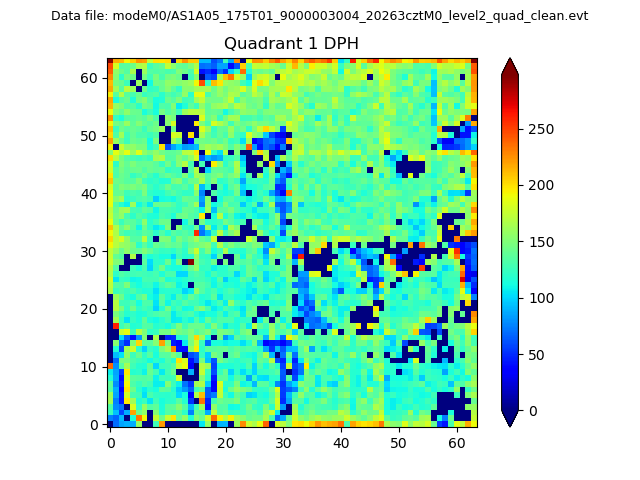
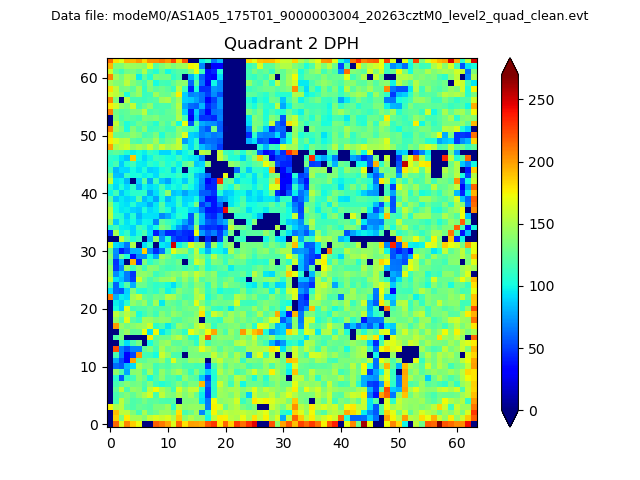
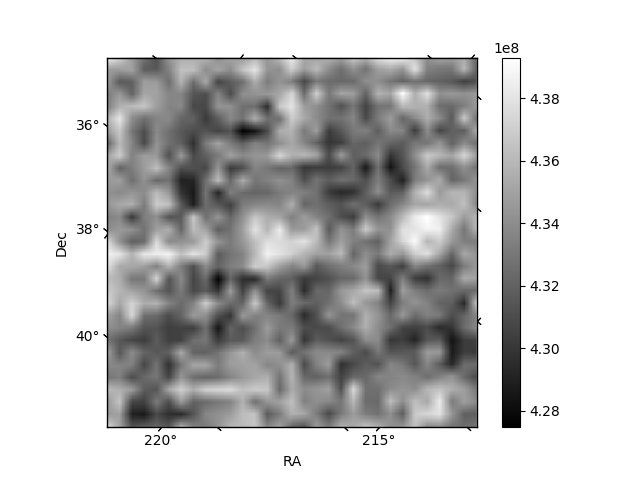
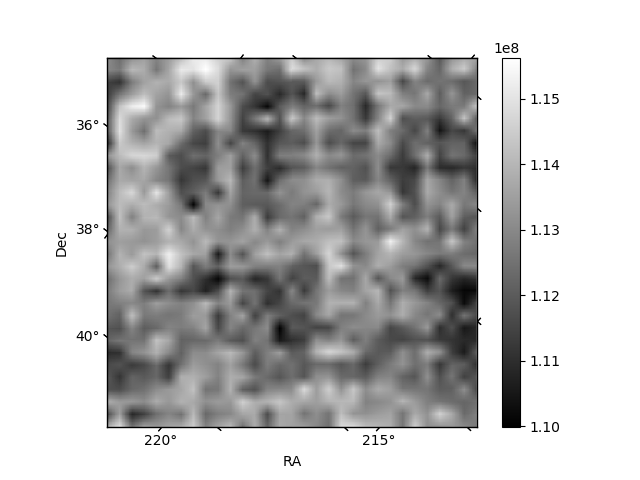
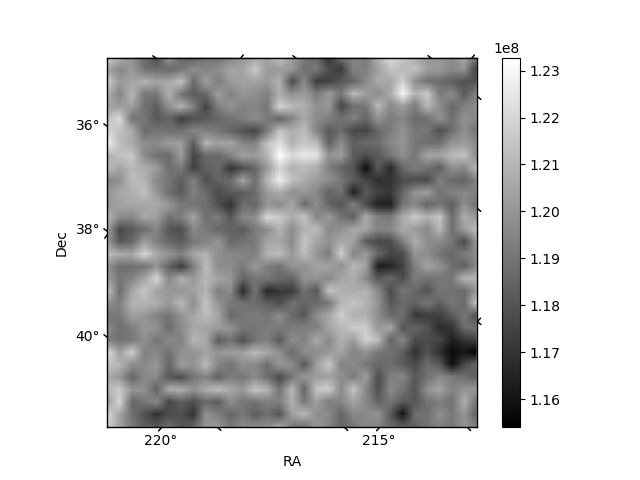
Histogram calculated using DETX and DETY for each event in the final _common_clean file
| Quadrant A | 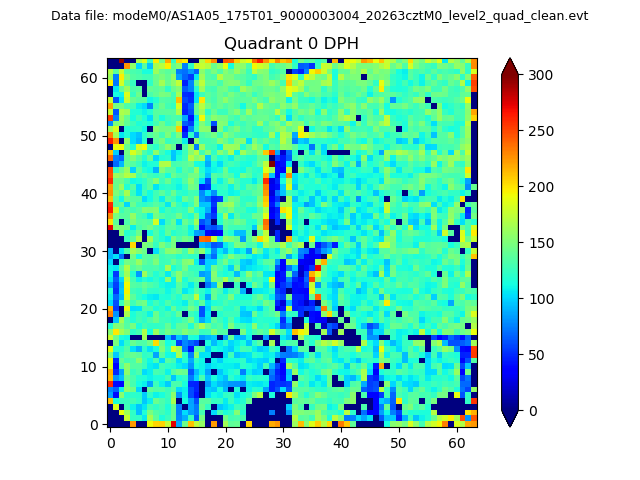 |
 |
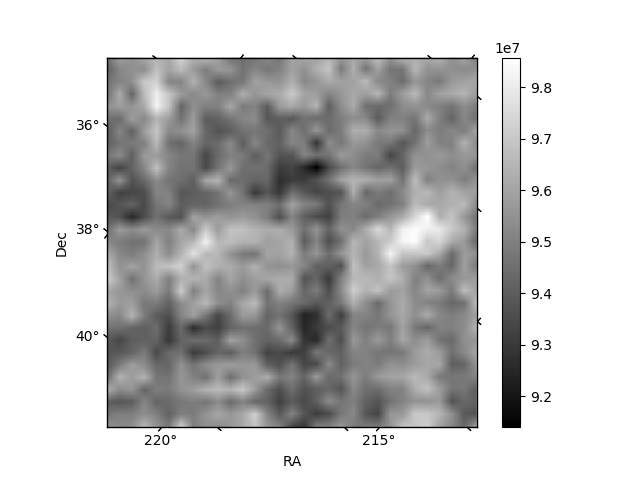
Quadrant B |
|---|---|---|---|
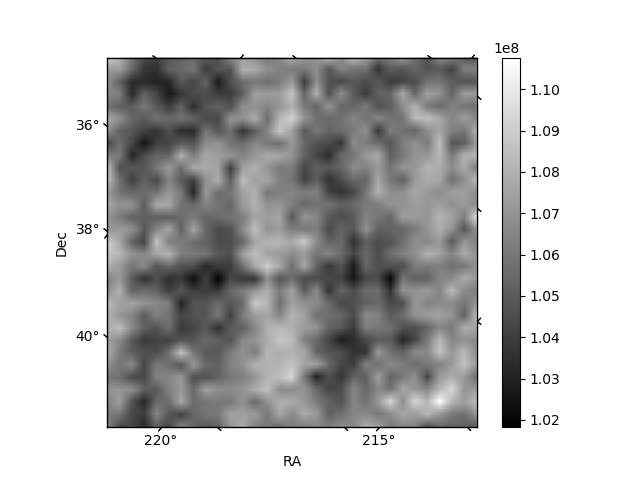
| Quadrant D | 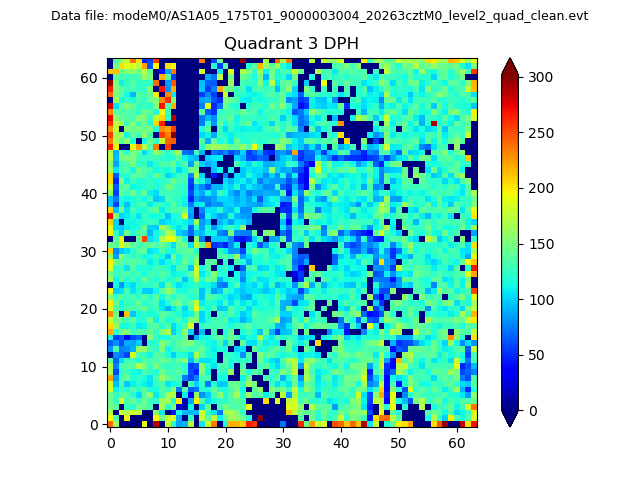 |
 |
Quadrant C |
| Plot type | Count rate plots | Images |
|---|---|---|
| Comparison with Poisson distribution Blue bars denote a histogram of data divided into 1 sec bins. Red curve is a Poisson curve with rate = median count rate of data. |
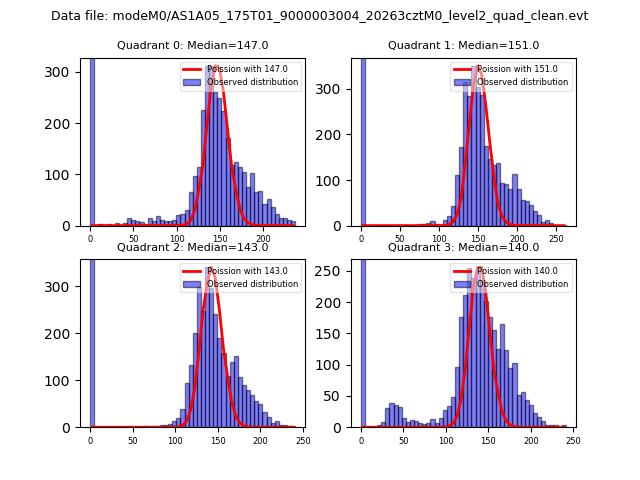 |
 |
| Quadrant-wise count rates Data is divided into 100 sec bins |
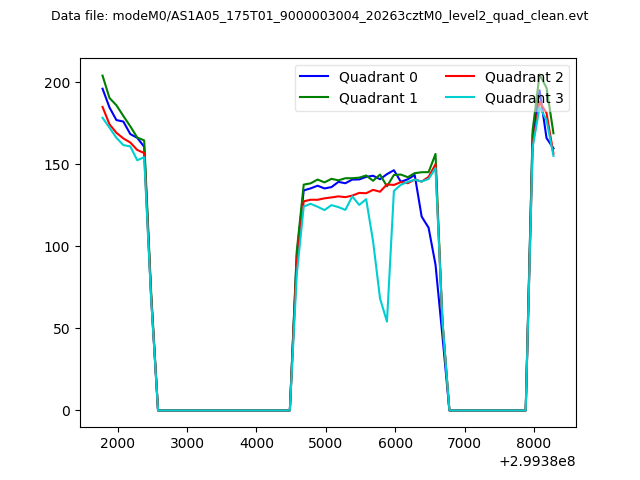 |
|
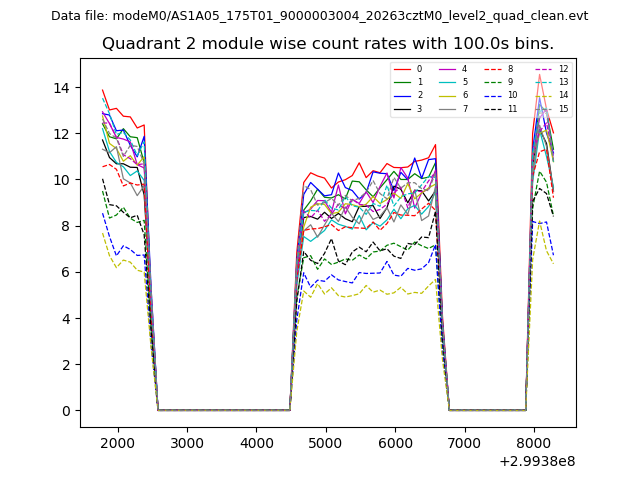
| Module-wise count rates for Quadrant A Data is divided into 100 sec bins |
 |
 |
| Module-wise count rates for Quadrant B Data is divided into 100 sec bins |
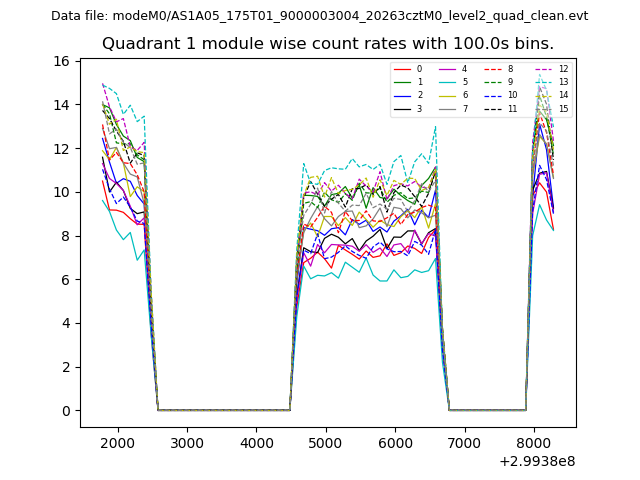 |
 |
| Module-wise count rates for Quadrant C Data is divided into 100 sec bins |
 |
 |
| Module-wise count rates for Quadrant D Data is divided into 100 sec bins |
 |
 |
| Parameter | Plot |
|---|---|
| CZT HV Monitor | 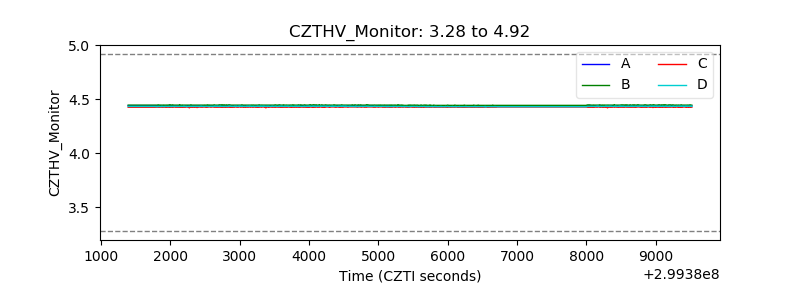 |
| D_VDD | 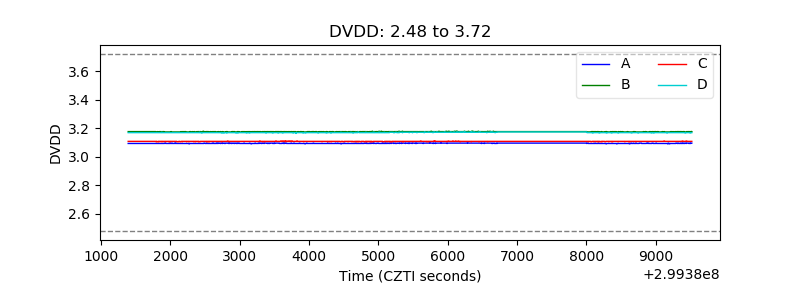 |
| Temperature 1 | 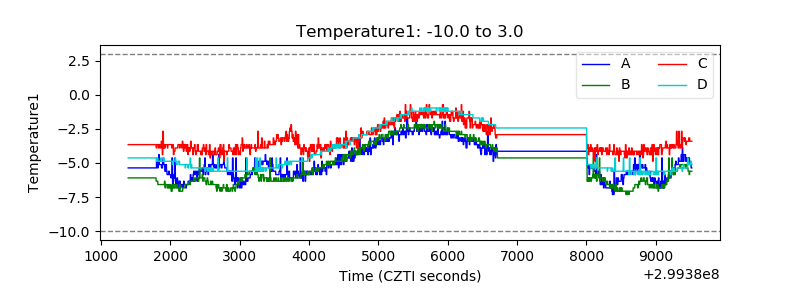 |
| Veto HV Monitor | 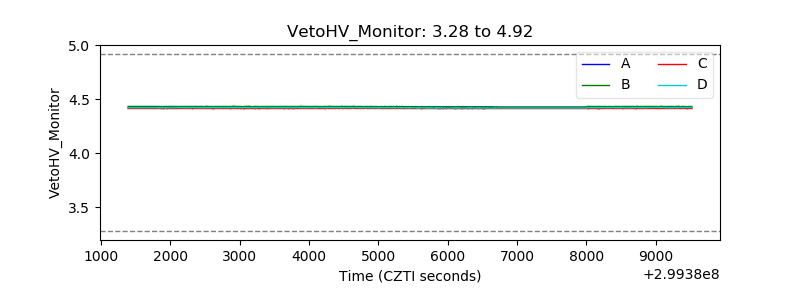 |
| Veto LLD |  |
| Alpha Counter | 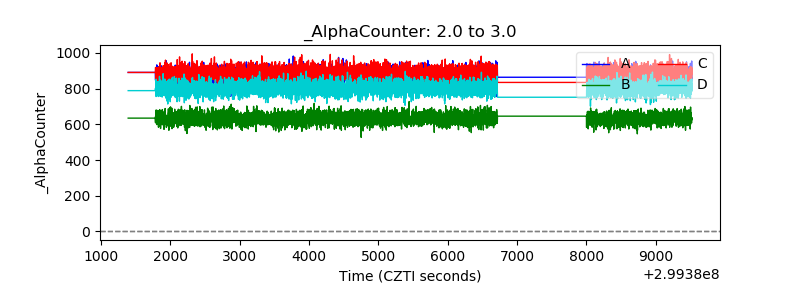 |
| _CPM_Rate | 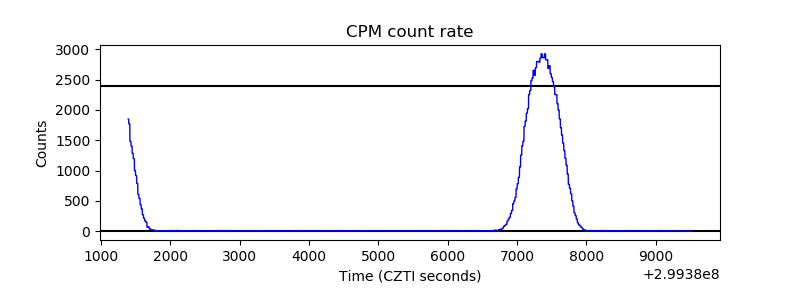 |
| CZT Counter | 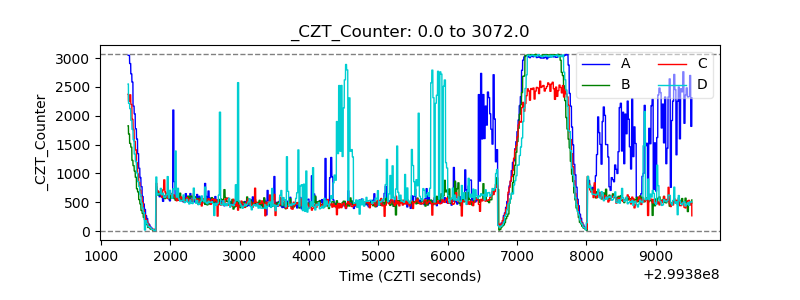 |
| +2.5 Volts monitor |  |
| +5 Volts monitor |  |
| _ROLL_ROT |  |
| _Roll_DEC | 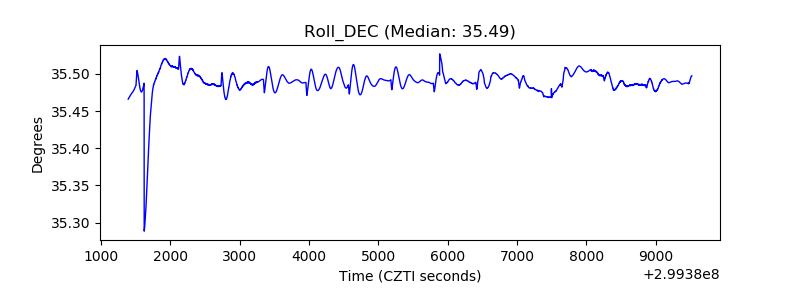 |
| _Roll_RA | 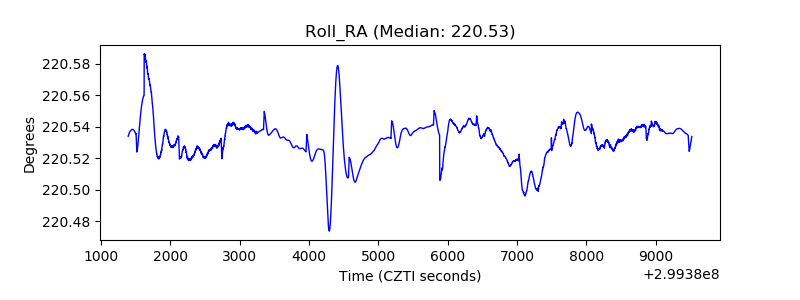 |
| Veto Counter |  |